AI PPT Maker
Templates
PPT Bundles
Design Services
Business PPTs
Business Plan
Management
Strategy
Introduction PPT
Roadmap
Self Introduction
Timelines
Process
Marketing
Agenda
Technology
Medical
Startup Business Plan
Cyber Security
Dashboards
SWOT
Proposals
Education
Pitch Deck
Digital Marketing
KPIs
Project Management
Product Management
Artificial Intelligence
Target Market
Communication
Supply Chain
Google Slides
Research Services
 One Pagers
All Categories
-
Home
- Customer Favorites
- Revenue Dashboard
Revenue Dashboard

Business Strategy Development Process Business Management Dashboards Profit Themes PDF
Deliver an awe inspiring pitch with this creative business strategy development process business management dashboards profit themes pdf bundle. Topics like customers by region, sales by product category, new customers signups can be discussed with this completely editable template. It is available for immediate download depending on the needs and requirements of the user.
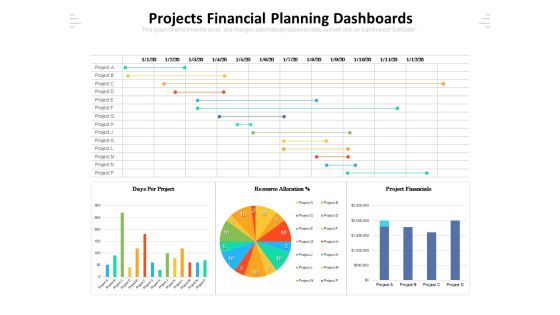
Projects Financial Planning Dashboards Ppt PowerPoint Presentation Gallery Show PDF
Presenting this set of slides with name projects financial planning dashboards ppt powerpoint presentation gallery show pdf. The topics discussed in these slides are financials, resource, allocation. This is a completely editable PowerPoint presentation and is available for immediate download. Download now and impress your audience.

Enterprise Management Business Management Dashboards Jan Slides PDF
Deliver and pitch your topic in the best possible manner with this enterprise management business management dashboards jan slides pdf. Use them to share invaluable insights on actual income vs budget, actual expenses vs budget, balance and impress your audience. This template can be altered and modified as per your expectations. So, grab it now.

Enterprise Governance Business Management Dashboards Mar Download PDF
Deliver and pitch your topic in the best possible manner with this enterprise governance business management dashboards mar download pdf. Use them to share invaluable insights on actual expenses vs budget, actual income vs budget and impress your audience. This template can be altered and modified as per your expectations. So, grab it now.

Business Strategy Development Process Business Management Dashboards Balance Download PDF
Deliver an awe inspiring pitch with this creative business strategy development process business management dashboards balance download pdf bundle. Topics like actual income vs budget, actual expenses vs budget can be discussed with this completely editable template. It is available for immediate download depending on the needs and requirements of the user.

Corporate Governance Business Management Dashboards Gride Formats PDF
Deliver an awe inspiring pitch with this creative corporate governance business management dashboards gride formats pdf bundle. Topics like actual income vs budget, actual expenses vs budget can be discussed with this completely editable template. It is available for immediate download depending on the needs and requirements of the user.

Business Management Dashboards Budget Ppt Diagram Lists PDF
Deliver and pitch your topic in the best possible manner with this business management dashboards budget ppt diagram lists pdf. Use them to share invaluable insights on budget, income, expenses and impress your audience. This template can be altered and modified as per your expectations. So, grab it now.

Criterion For Choosing Distribution Channel For Efficient Sales Administration Dashboards To Measure Performance Of Distribution Formats PDF
This slide covers the dashboards to measure performance of various distribution strategies of the organization. This includes partner performance dashboards, top products by revenue, sales by location etc. From laying roadmaps to briefing everything in detail, our templates are perfect for you. You can set the stage with your presentation slides. All you have to do is download these easy-to-edit and customizable templates. Criterion For Choosing Distribution Channel For Efficient Sales Administration Dashboards To Measure Performance Of Distribution Formats PDF will help you deliver an outstanding performance that everyone would remember and praise you for. Do download this presentation today.
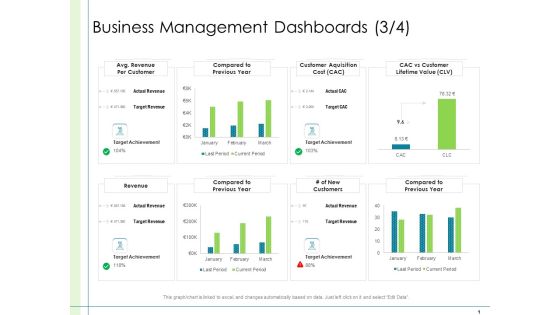
In Depth Business Assessment Business Management Dashboards Target Ppt PowerPoint Presentation Infographic Template Inspiration PDF
Deliver and pitch your topic in the best possible manner with this in depth business assessment business management dashboards target ppt powerpoint presentation infographic template inspiration pdf. Use them to share invaluable insights on avg revenue per customer, compared to previous year, customer aquisition cost, cac vs customer lifetime value, target achievement, compared to previous year, revenue, actual revenue, target revenue and impress your audience. This template can be altered and modified as per your expectations. So, grab it now.

Dashboards Related To The Zoo Financials And Operations Ppt Portfolio Graphics Example PDF
This slide shows the dashboard KPI related to the ABC Zoo which includes the forecasted revenue, competitors details, visitors attractions, capital expenditure and many more.Deliver and pitch your topic in the best possible manner with this dashboards related to the zoo financials and operations ppt portfolio graphics example pdf. Use them to share invaluable insights on capital expenditure, visitors attraction, forecasted revenue and impress your audience. This template can be altered and modified as per your expectations. So, grab it now.

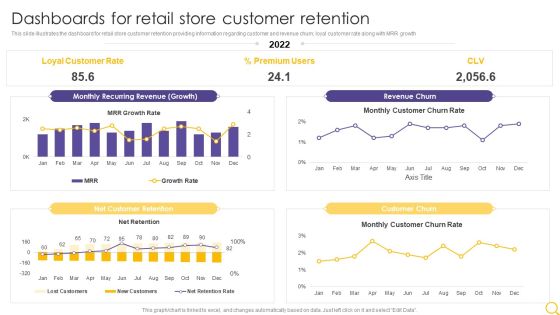
Dashboards For Retail Store Customer Retention Retail Outlet Operations Performance Evaluation Graphics PDF
This slide illustrates the dashboard for retail store customer retention providing information regarding customer and revenue churn, loyal customer rate along with MRR growth.Deliver and pitch your topic in the best possible manner with this Dashboards For Retail Store Customer Retention Retail Outlet Operations Performance Evaluation Graphics PDF. Use them to share invaluable insights on Customer Retention, Loyal Customer, Recurring Revenue and impress your audience. This template can be altered and modified as per your expectations. So, grab it now.
Retail Outlet Operational Efficiency Analytics Dashboards For Retail Store Customer Retention Topics PDF
This slide illustrates the dashboard for retail store customer retention providing information regarding customer and revenue churn, loyal customer rate along with MRR growth. Deliver and pitch your topic in the best possible manner with this Retail Outlet Operational Efficiency Analytics Dashboards For Retail Store Customer Retention Topics PDF. Use them to share invaluable insights on Loyal Customer Rate, Percent Premium Users, Revenue Churn and impress your audience. This template can be altered and modified as per your expectations. So, grab it now.

Dashboards For Retail Store Customer Retention Retail Outlet Performance Assessment Microsoft PDF
This slide illustrates the dashboard for retail store customer retention providing information regarding customer and revenue churn, loyal customer rate along with MRR growth. Deliver and pitch your topic in the best possible manner with this Dashboards For Retail Store Customer Retention Retail Outlet Performance Assessment Microsoft PDF. Use them to share invaluable insights on Customer Retention, Customer Churn, Recurring Revenue and impress your audience. This template can be altered and modified as per your expectations. So, grab it now.

Business Assessment Outline Business Management Dashboards Customers Ppt Styles Graphics Pictures PDF
Deliver an awe-inspiring pitch with this creative business assessment outline business management dashboards customers ppt styles graphics pictures pdf bundle. Topics like revenue, compared to previous year, new customers, avg. revenue per customer, compared to previous year, cac vs customer lifetime value, customer aquisition cost, target achievement can be discussed with this completely editable template. It is available for immediate download depending on the needs and requirements of the user.

Content And Permission Marketing Tactics For Enhancing Business Revenues Key Activities For Off Page SEO Background PDF
Purpose of the following slide is to display key activities that need to be conducted during the process of OFF page SEO, following steps are included in this process guest posting, social media content posting, e-mail marketing, social book marketing and image or video doc submission. The Content And Permission Marketing Tactics For Enhancing Business Revenues Key Activities For Off Page SEO Background PDF is a compilation of the most recent design trends as a series of slides. It is suitable for any subject or industry presentation, containing attractive visuals and photo spots for businesses to clearly express their messages. This template contains a variety of slides for the user to input data, such as structures to contrast two elements, bullet points, and slides for written information. Slidegeeks is prepared to create an impression.

Business Assessment Outline Business Management Dashboards Region Ppt Icon Aids PDF
Deliver and pitch your topic in the best possible manner with this business assessment outline business management dashboards region ppt icon aids pdf. Use them to share invaluable insights on top ten products by profit margin, revenue and sales last 12 months, customers by region, new customers signups, sales by product category and impress your audience. This template can be altered and modified as per your expectations. So, grab it now.
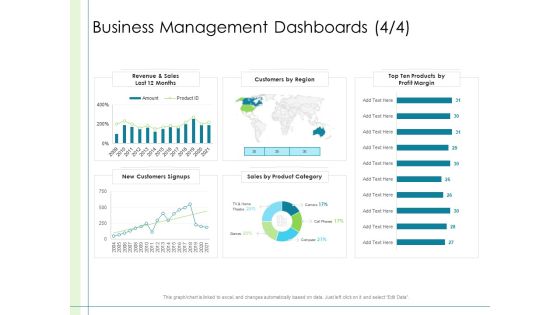
In Depth Business Assessment Business Management Dashboards Sales Ppt PowerPoint Presentation Ideas Background PDF
Deliver an awe-inspiring pitch with this creative in depth business assessment business management dashboards sales ppt powerpoint presentation ideas background pdf bundle. Topics like revenue and sales last 12 months, customers by region, top ten products by profit margin, sales by product category, new customers signups can be discussed with this completely editable template. It is available for immediate download depending on the needs and requirements of the user.

Administrative Regulation Business Management Dashboards Sales Ppt PowerPoint Presentation Inspiration Layouts PDF
Deliver an awe-inspiring pitch with this creative administrative regulation business management dashboards sales ppt powerpoint presentation inspiration layouts pdf bundle. Topics like top ten products by profit margin, revenue and sales last 12 months, customers by regione, customers signups, sales by product category can be discussed with this completely editable template. It is available for immediate download depending on the needs and requirements of the user.

Retail Store Operations Dashboards For Retail Store Customer Retention Clipart PDF
This slide illustrates the dashboard for retail store customer retention providing information regarding customer and revenue churn, loyal customer rate along with MRR growth. Make sure to capture your audiences attention in your business displays with our gratis customizable Retail Store Operations Dashboards For Retail Store Customer Retention Clipart PDF. These are great for business strategies, office conferences, capital raising or task suggestions. If you desire to acquire more customers for your tech business and ensure they stay satisfied, create your own sales presentation with these plain slides.

Dashboards Related To The Zoo Financials And Operations Ppt Outline Portfolio PDF
This slide shows the dashboard or KPI related to the ABC Zoo which includes the forecasted revenue, competitors details, visitors attractions, capital expenditure and many more. Deliver an awe-inspiring pitch with this creative dashboards related to the zoo financials and operations ppt outline portfolio pdf. bundle. Topics like forecasted revenue, visitors attraction, capital expenditure, advertising and marketing can be discussed with this completely editable template. It is available for immediate download depending on the needs and requirements of the user.

Dashboards Related To The Zoo Financials And Operations Ppt Icon Professional PDF
This slide shows the dashboard KPI related to the ABC Zoo which includes the forecasted revenue, competitors details, visitors attractions, capital expenditure and many more. Deliver and pitch your topic in the best possible manner with this dashboards related to the zoo financials and operations ppt icon professional pdf. Use them to share invaluable insights on forecasted revenue, visitors attraction and impress your audience. This template can be altered and modified as per your expectations. So, grab it now.
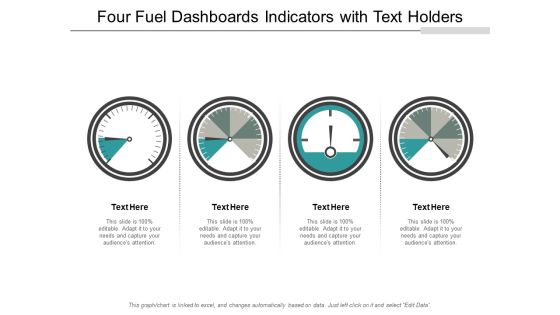
Four Fuel Dashboards Indicators With Text Holders Ppt PowerPoint Presentation File Graphics Design
This is a four fuel dashboards indicators with text holders ppt powerpoint presentation file graphics design. This is a four stage process. The stages in this process are fuel gauge, gas gauge, fuel containers.
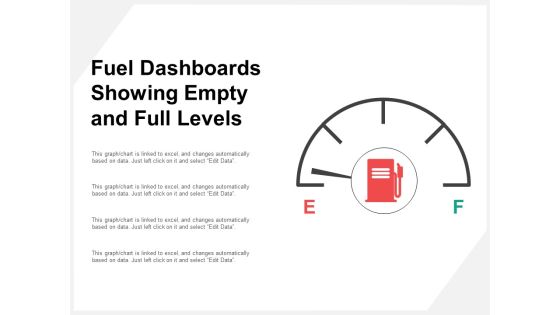
Fuel Dashboards Showing Empty And Full Levels Ppt PowerPoint Presentation Professional Slide Portrait
This is a fuel dashboards showing empty and full levels ppt powerpoint presentation professional slide portrait. This is a four stage process. The stages in this process are fuel gauge, gas gauge, fuel containers.
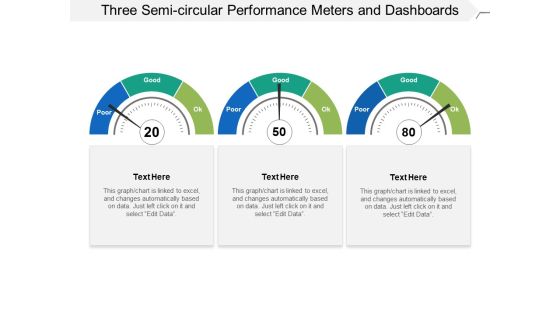
Three Semi Circular Performance Meters And Dashboards Ppt PowerPoint Presentation Slides Influencers
This is a three semi circular performance meters and dashboards ppt powerpoint presentation slides influencers. This is a three stage process. The stages in this process are fuel gauge, gas gauge, fuel containers.

Business Operations Assessment Business Management Dashboards Customers Ppt Outline Designs Download PDF
Deliver and pitch your topic in the best possible manner with this business operations assessment business management dashboards customers ppt outline designs download pdf. Use them to share invaluable insights on actual revenue, target revenue, revenue, compared to previous year, new customers, compared to previous year, compared to previous year your audience. This template can be altered and modified as per your expectations. So, grab it now.

Administrative Regulation Business Management Dashboards Customer Ppt PowerPoint Presentation Images PDF
Deliver an awe-inspiring pitch with this creative administrative regulation business management dashboards customer ppt powerpoint presentation images pdf bundle. Topics like actual revenue, target revenue, target achievement, new customers, customer acquisition cost can be discussed with this completely editable template. It is available for immediate download depending on the needs and requirements of the user.
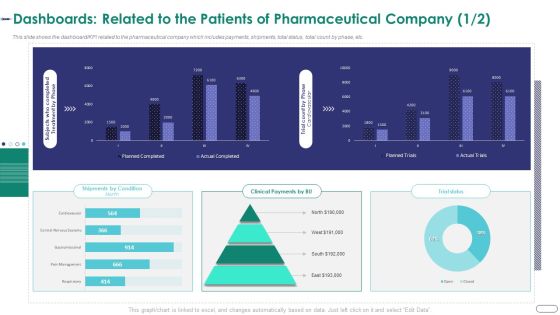
Strategies Envr Onmental Operational Challenges Dashboards Related To The Patients Of Pharmaceutical Themes PDF
This slide shows the dashboard KPI related to the pharmaceutical company which includes payments, shipments, total status, total count by phase, etc. Deliver and pitch your topic in the best possible manner with this strategies envr onmental operational challenges dashboards related to the patients of pharmaceutical themes pdf. Use them to share invaluable insights on business overview, total employees, total revenue, total profit, headquarter and impress your audience. This template can be altered and modified as per your expectations. So, grab it now.
Performance Analysis Of New Product Development Product Performance Dashboards Icons PDF
The following slide displays the dashboard which highlights the performance of the product, multiple metrics such as Revenues, New customer, gross profit, customer satisfaction and global sales breakdown. Deliver and pitch your topic in the best possible manner with this performance analysis of new product development product performance dashboards icons pdf. Use them to share invaluable insights on revenue, sales comparison, customer satisfaction, gross profit, new customers, sale by product category and impress your audience. This template can be altered and modified as per your expectations. So, grab it now.

Dashboards Major KPI Key Performance Indicators Of A Railway Company Slides PDF
Deliver and pitch your topic in the best possible manner with this dashboards major kpi key performance indicators of a railway company slides pdf. Use them to share invaluable insights on revenue, employees, key performance indicators and impress your audience. This template can be altered and modified as per your expectations. So, grab it now.

Corporate Regulation Business Management Dashboards Sales Ppt Inspiration Graphic Tips PDF
Deliver an awe inspiring pitch with this creative corporate regulation business management dashboards sales ppt inspiration graphic tips pdf bundle. Topics like revenue, sales, profit margin can be discussed with this completely editable template. It is available for immediate download depending on the needs and requirements of the user.

Business Management Dashboards Sales Business Analysis Method Ppt File Images PDF
Deliver an awe inspiring pitch with this creative business management dashboards sales business analysis method ppt file images pdf bundle. Topics like revenue, sales, profit margin can be discussed with this completely editable template. It is available for immediate download depending on the needs and requirements of the user.
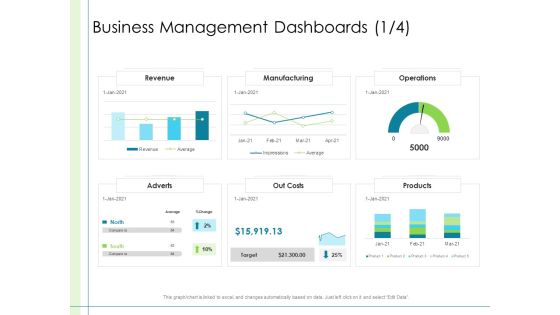
In Depth Business Assessment Business Management Dashboards Ppt PowerPoint Presentation Styles Show PDF
Deliver an awe-inspiring pitch with this creative in depth in depth business assessment business management dashboards ppt powerpoint presentation styles show pdf pdf bundle. Topics like revenue, manufacturing, operations, adverts, out costs, products, target can be discussed with this completely editable template. It is available for immediate download depending on the needs and requirements of the user.

Business Management Dashboards Costs Business Analysis Method Ppt Gallery Format Ideas PDF
Deliver and pitch your topic in the best possible manner with this business management dashboards costs business analysis method ppt gallery format ideas pdf. Use them to share invaluable insights on revenue, manufacturing, operations, products, costs and impress your audience. This template can be altered and modified as per your expectations. So, grab it now.

Evaluating New Commodity Impact On Market Product Performance Dashboards Template PDF
The following slide displays the dashboard which highlights the performance of the product, multiple metrics such as Revenues, New customer, gross profit, customer satisfaction and global sales breakdown Deliver and pitch your topic in the best possible manner with this Evaluating New Commodity Impact On Market Product Performance Dashboards Template PDF Use them to share invaluable insights on Brand Profitability, Customer Satisfaction, Gross Profit and impress your audience. This template can be altered and modified as per your expectations. So, grab it now.

Business Model Of New Consultancy Firm Dashboards Showing Consultancy Company Portrait PDF
This slide shows the dashboard related to consultancy company performance which includes budget preparation, sales and goals. Company profits and goals etc. Deliver and pitch your topic in the best possible manner with this business model of new consultancy firm dashboards showing consultancy company portrait pdf. Use them to share invaluable insights on dashboards showing consultancy company performance with key metrics and impress your audience. This template can be altered and modified as per your expectations. So, grab it now.

Dashboards Showing Consultancy Company Performance With Key Metrics Ppt Ideas Smartart PDF
This slide shows the dashboard related to consultancy company performance which includes budget preparation, sales and goals. Company profits and goals etc. Deliver an awe-inspiring pitch with this creative dashboards showing consultancy company performance with key metrics ppt ideas smartart pdf bundle. Topics like budget, products, customers can be discussed with this completely editable template. It is available for immediate download depending on the needs and requirements of the user.
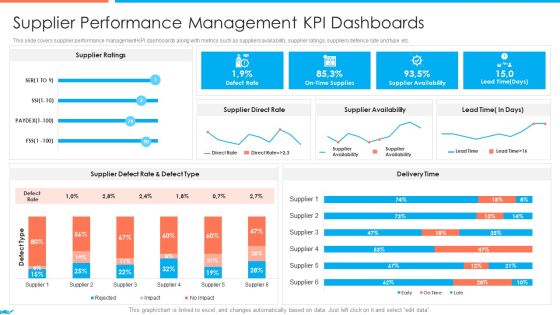
Supplier Association Management Techniques Supplier Performance Management Kpi Dashboards Guidelines PDF
This slide covers supplier performance management KPI dashboard along with metrics such as suppliers availability, supplier rating, suppliers defence rate and type etc. Deliver an awe inspiring pitch with this creative supplier association management techniques supplier performance management kpi dashboards guidelines pdf bundle. Topics like reduction in costs, increased efficiency, increase in profitability can be discussed with this completely editable template. It is available for immediate download depending on the needs and requirement of the user.

Retail Outlet Operational Efficiency Analytics Dashboards For Retail Store Customer Conversion Brochure PDF
This slide illustrates the dashboard for retail store customer conversion providing information regarding dwell time, engaged, cross and bounced shoppers, windows conversion etc. This is a Retail Outlet Operational Efficiency Analytics Dashboards For Retail Store Customer Conversion Brochure PDF template with various stages. Focus and dispense information on one stages using this creative set, that comes with editable features. It contains large content boxes to add your information on topics like Dwell Time, Customer Loyalty, Engaged Shoppers, Bounced Shoppers. You can also showcase facts, figures, and other relevant content using this PPT layout. Grab it now.
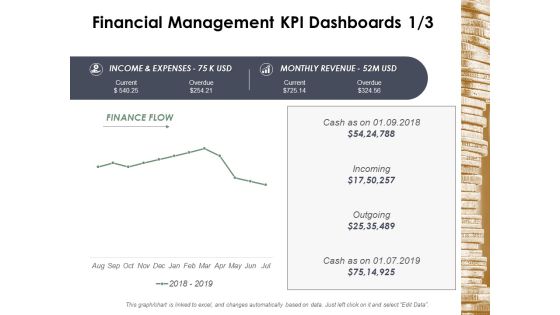
Financial Management Kpi Dashboards Business Ppt Powerpoint Presentation Infographic Template Deck
This is a financial management kpi dashboards business ppt powerpoint presentation infographic template deck. This is a four stage process. The stages in this process are finance, marketing, management, investment, analysis.
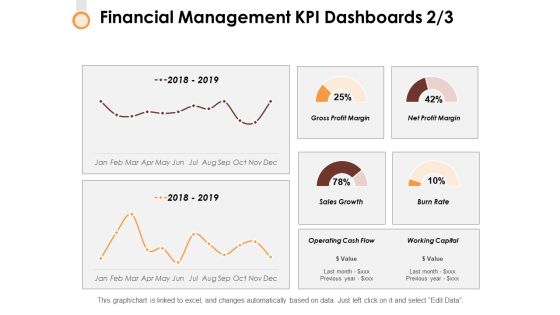
Financial Management Kpi Dashboards 2 3 Ppt PowerPoint Presentation Infographic Template Format Ideas
This is a financial management kpi dashboards 2 3 ppt powerpoint presentation infographic template format ideas. This is a two stage process. The stages in this process are finance, strategy, marketing, compare, business.

Business Review And Performance Assessment Dashboards Ppt PowerPoint Presentation Infographics Show
This is a business review and performance assessment dashboards ppt powerpoint presentation infographics show. This is a four stage process. The stages in this process are year in review, yearly highlights, countdowns.

Financial Management Kpi Dashboards Strategy Ppt Powerpoint Presentation Gallery Graphics Template
This is a financial management kpi dashboards strategy ppt powerpoint presentation gallery graphics template. This is a six stage process. The stages in this process are finance, marketing, management, investment, analysis.

Financial Management Kpi Dashboards 1 3 Ppt PowerPoint Presentation Outline Background
This is a financial management kpi dashboards 1 3 ppt powerpoint presentation outline background. This is a four stage process. The stages in this process are finance, strategy, marketing, compare, business.

Financial Management Kpi Dashboards 3 3 Ppt PowerPoint Presentation Layouts Graphics Template
This is a financial management kpi dashboards 3 3 ppt powerpoint presentation layouts graphics template. This is a two stage process. The stages in this process are finance, strategy, marketing, compare, business.
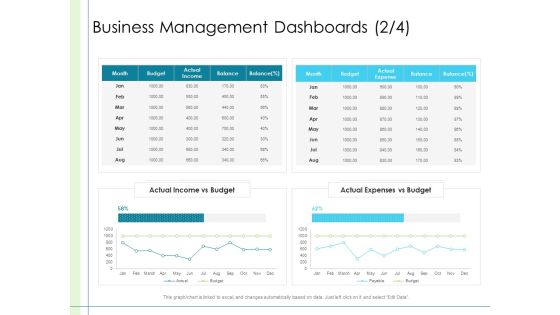
In Depth Business Assessment Business Management Dashboards Income Ppt PowerPoint Presentation Gallery Outline PDF
Deliver and pitch your topic in the best possible manner with this in depth business assessment business management dashboards income ppt powerpoint presentation gallery outline pdf. Use them to share invaluable insights on actual income vs budget, actual expenses vs budget, payable, budget and impress your audience. This template can be altered and modified as per your expectations. So, grab it now.
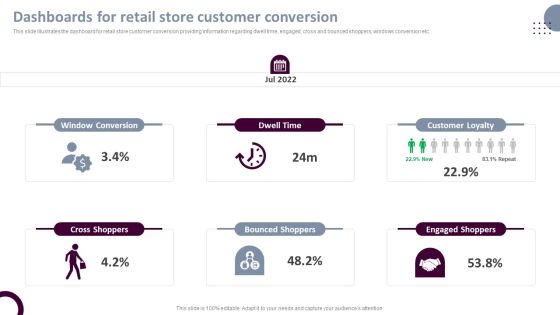
Retail Store Operations Dashboards For Retail Store Customer Conversion Professional PDF
Crafting an eye-catching presentation has never been more straightforward. Let your presentation shine with this tasteful yet straightforward Retail Store Operations Dashboards For Retail Store Customer Conversion Professional PDF template. It offers a minimalistic and classy look that is great for making a statement. The colors have been employed intelligently to add a bit of playfulness while still remaining professional. Construct the ideal Retail Store Operations Dashboards For Retail Store Customer Conversion Professional PDF that effortlessly grabs the attention of your audience Begin now and be certain to wow your customers.

Business Assessment Outline Business Management Dashboards Budget Ppt Pictures Design Templates PDF
Deliver an awe-inspiring pitch with this creative business assessment outline business management dashboards budget ppt pictures design templates pdf bundle. Topics like actual income vs budget, actual expenses vs budget, actual income vs budget can be discussed with this completely editable template. It is available for immediate download depending on the needs and requirements of the user.

Business Operations Assessment Business Management Dashboards Budget Ppt Infographics Gridlines PDF
Deliver and pitch your topic in the best possible manner with this business operations assessment business management dashboards budget ppt infographics gridlines pdf. Use them to share invaluable insights on actual income vs budget, actual expenses vs budget, payable, budget and impress your audience. This template can be altered and modified as per your expectations. So, grab it now.

Administrative Regulation Business Management Dashboards Ppt PowerPoint Presentation Model Inspiration PDF
Deliver and pitch your topic in the best possible manner with this administrative regulation business management dashboards ppt powerpoint presentation model inspiration pdf. Use them to share invaluable insights on actual income vs budget, actual expenses vs budget, payable, budget and impress your audience. This template can be altered and modified as per your expectations. So, grab it now.

Corporate Regulation Business Management Dashboards Expenses Ppt Outline Designs Download PDF
Deliver an awe inspiring pitch with this creative corporate regulation business management dashboards expenses ppt outline designs download pdf bundle. Topics like actual income vs budget, actual expenses vs budget can be discussed with this completely editable template. It is available for immediate download depending on the needs and requirements of the user.

Business Management Dashboards Expenses Business Analysis Method Ppt Professional Template PDF
Deliver an awe inspiring pitch with this creative business management dashboards expenses business analysis method ppt professional template pdf bundle. Topics like actual income vs budget, actual expenses vs budget can be discussed with this completely editable template. It is available for immediate download depending on the needs and requirements of the user.
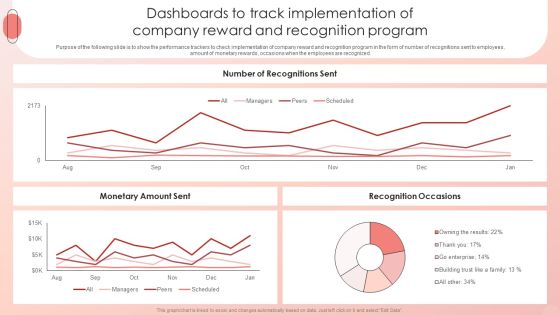
Improving HRM Process Dashboards To Track Implementation Of Company Reward Themes PDF
Purpose of the following slide is to show the performance trackers to check implementation of company reward and recognition program in the form of number of recognitions sent to employees, amount of monetary rewards, occasions when the employees are recognized. Make sure to capture your audiences attention in your business displays with our gratis customizable Improving HRM Process Dashboards To Track Implementation Of Company Reward Themes PDF. These are great for business strategies, office conferences, capital raising or task suggestions. If you desire to acquire more customers for your tech business and ensure they stay satisfied, create your own sales presentation with these plain slides.

Content Ppt PowerPoint Presentation Infographics Diagrams
This is a content ppt powerpoint presentation infographics diagrams. This is a thirteen stage process. The stages in this process are business highlights, financial highlights, products offering, sales performance dashboard, sales revenue by region.

Sales Performance Ppt PowerPoint Presentation Pictures Format Ideas
This is a sales performance ppt powerpoint presentation pictures format ideas. This is a six stage process. The stages in this process are quarterly sales review, sales by region, sales performance dashboard, sales revenue by product.
Key Components Of Customer Management With Icons Ppt PowerPoint Presentation Styles Smartart
Presenting this set of slides with name key components of customer management with icons ppt powerpoint presentation styles smartart. This is a four stage process. The stages in this process are strategy, target, goal, action plan, client, create annual target, revenue, time dashboard. This is a completely editable PowerPoint presentation and is available for immediate download. Download now and impress your audience.

Addressing Essential Features Of Yelp Platform Quote Themes PDF
This slide caters details about essential features of Yelp platform such as requesting a quote, enterprise owners dashboard, revenues estimate tool. This is a addressing essential features of yelp platform quote themes pdf template with various stages. Focus and dispense information on three stages using this creative set, that comes with editable features. It contains large content boxes to add your information on topics like requesting a quote, enterprise owners dashboard, revenues estimate tool . You can also showcase facts, figures, and other relevant content using this PPT layout. Grab it now.
Mitigating Cybersecurity Threats And Vulnerabilities Financial Performance Tracking Designs PDF
This slide presents the dashboard which will help firm in tracking the fiscal performance. This dashboard displays revenues and expenses trends and payment received analysis. Deliver and pitch your topic in the best possible manner with this mitigating cybersecurity threats and vulnerabilities financial performance tracking designs pdf. Use them to share invaluable insights on receivables analysis, revenue and expense trends and impress your audience. This template can be altered and modified as per your expectations. So, grab it now.
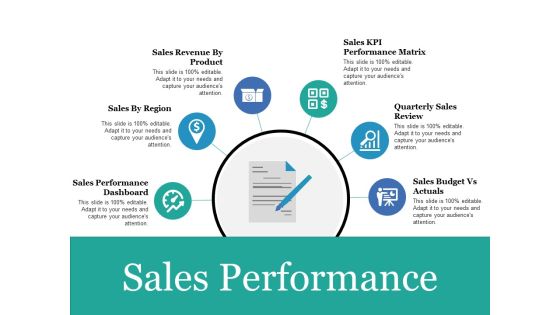
Sales Performance Ppt PowerPoint Presentation Portfolio Show
This is a sales performance ppt powerpoint presentation portfolio show. This is a six stage process. The stages in this process are sales performance dashboard, sales by region, sales revenue by product, quarterly sales review, sales budget vs actuals.
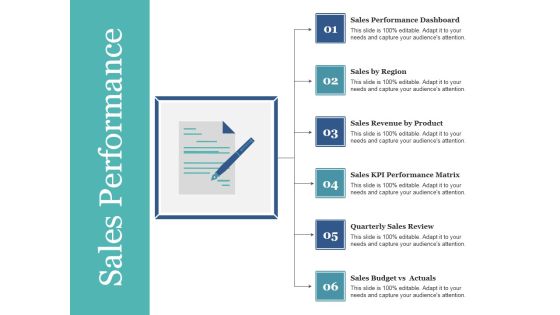
Sales Performance Ppt PowerPoint Presentation Summary Influencers
This is a sales performance ppt powerpoint presentation summary influencers. This is a six stage process. The stages in this process are sales performance dashboard, sales by region, sales revenue by product, sales kpi performance matrix, quarterly sales review.
Sales Performance Ppt PowerPoint Presentation Visual Aids Icon
This is a sales performance ppt powerpoint presentation visual aids icon. This is a six stage process. The stages in this process are quarterly sales review, sales performance dashboard, sales by region, sales revenue by product.

Customer Satisfaction Template 1 Ppt PowerPoint Presentation Icon Outline
This is a customer satisfaction template 1 ppt powerpoint presentation icon outline. This is a three stage process. The stages in this process are overall satisfaction with service, satisfaction with value for money, overall satisfaction with relationship, dashboard business.

Customer Satisfaction Template 1 Ppt PowerPoint Presentation Infographics Outfit
This is a customer satisfaction template 1 ppt powerpoint presentation infographics outfit. This is a three stage process. The stages in this process are key performance indicators, overall satisfaction with service, satisfaction with value for money.

Customer Satisfaction Template 1 Ppt PowerPoint Presentation Ideas Tips
This is a customer satisfaction template 1 ppt powerpoint presentation ideas tips. This is a three stage process. The stages in this process are key performance indicators, overall satisfaction with service, satisfaction with value for money.

Customer Satisfaction Ppt PowerPoint Presentation Model Gridlines
This is a customer satisfaction ppt powerpoint presentation model gridlines. This is a three stage process. The stages in this process are overall satisfaction with service, new question, satisfaction with value for money.

Venture Capitalist Control Board Ppt PowerPoint Presentation Complete Deck With Slides
Presenting this set of slides with name venture capitalist control board ppt powerpoint presentation complete deck with slides. The topics discussed in these slides are analysis, dashboards, revenue, strategy, portfolio. This is a completely editable PowerPoint presentation and is available for immediate download. Download now and impress your audience.

Comprehensive Development And Operations Adoption Initiatives IT Devops Activities Management Structure PDF
This slide provides information regarding essential DevOps activities management dashboard in terms of revenue by hour, storefront users, errors by host, response time by app, etc. Deliver and pitch your topic in the best possible manner with this comprehensive development and operations adoption initiatives it devops activities management structure pdf. Use them to share invaluable insights on application, revenue, average and impress your audience. This template can be altered and modified as per your expectations. So, grab it now.
Determining Crisis Management BCP Financial Performance Tracking Slide Ppt PowerPoint Presentation Layouts Guidelines PDF
This slide presents the dashboard which will help firm in tracking the fiscal performance. This dashboard displays revenues and expenses trends and payment received analysis. Deliver an awe inspiring pitch with this creative determining crisis management bcp financial performance tracking slide ppt powerpoint presentation layouts guidelines pdf. bundle. Topics like receivable analysis, revenue and expense trends, payment status, partially received, received. can be discussed with this completely editable template. It is available for immediate download depending on the needs and requirements of the user.
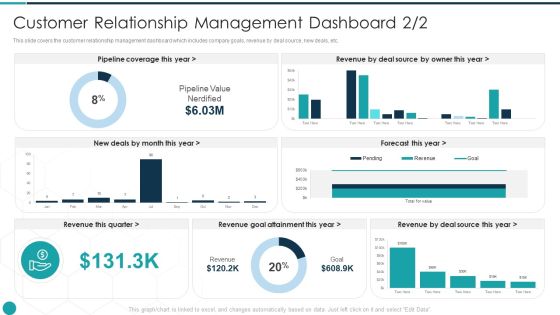
Upgrade Management Of Complex Business Associates Customer Relationship Management Download PDF
This slide covers the customer relationship management dashboard which includes company goals, revenue by deal source, new deals, etc. Deliver an awe inspiring pitch with this creative upgrade management of complex business associates customer relationship management download pdf bundle. Topics like source, revenue, goal can be discussed with this completely editable template. It is available for immediate download depending on the needs and requirements of the user.

Business To Business Sales Management Playbook B2B Sales Representatives Performance Rules PDF
This slide provides information regarding B2B sales representatives performance tracking dashboard to measure leads by region, revenue breakdown, top performers by leads, revenues, etc.Deliver an awe inspiring pitch with this creative Business To Business Sales Management Playbook B2B Sales Representatives Performance Rules PDF bundle. Topics like Leads Region, Revenue Break, Sales Reps can be discussed with this completely editable template. It is available for immediate download depending on the needs and requirements of the user.

Key Techniques To Enhance Cost Efficiency Stats Highlighting Overall Impact On Business Background PDF
The slide demonstrates a dashboard indicating the overall impact of cost efficiency strategies on business revenues and expenses. Various elements included in the dashboard are category wise business revenue, major expenses, total cost savings, etc. Find a pre designed and impeccable Key Techniques To Enhance Cost Efficiency Stats Highlighting Overall Impact On Business Background PDF. The templates can ace your presentation without additional effort. You can download these easy to edit presentation templates to make your presentation stand out from others. So, what are you waiting for Download the template from Slidegeeks today and give a unique touch to your presentation.

Content Marketing Performance Template 1 Ppt PowerPoint Presentation Styles Infographics
This is a content marketing performance template 1 ppt powerpoint presentation styles infographics. This is a eight stage process. The stages in this process are conversion rate, quality of leads, number of leads, sales revenue, website traffic, subscriber list growth, social media sharing, search engine ranking.

Table Of Contents Template 1 Ppt PowerPoint Presentation Infographic Template Gridlines
This is a table of contents template 1 ppt powerpoint presentation infographic template gridlines. This is a ten stage process. The stages in this process are targets for the next business quarter, actual versus target revenue setting strategic goals, key success indicators dashboard.

E Commerce Table Of Contents Ppt PowerPoint Presentation Diagram Templates PDF
Presenting this set of slides with name e commerce table of contents ppt powerpoint presentation diagram templates pdf. This is a seven stage process. The stages in this process are introduction, strategy and applications, business models, revenue model, payment methodologies, implementation, kpis and dashboard. This is a completely editable PowerPoint presentation and is available for immediate download. Download now and impress your audience.

Financial Ppt PowerPoint Presentation Guide
This is a financial ppt powerpoint presentation guide. This is a three stage process. The stages in this process are business, strategy, marketing, analysis, dashboard, measuring.
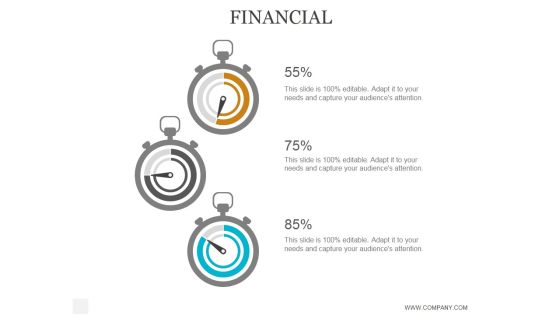
Financial Ppt PowerPoint Presentation Background Designs
This is a financial ppt powerpoint presentation background designs. This is a five stage process. The stages in this process are business, strategy, marketing, analysis, success, finance, dashboard.
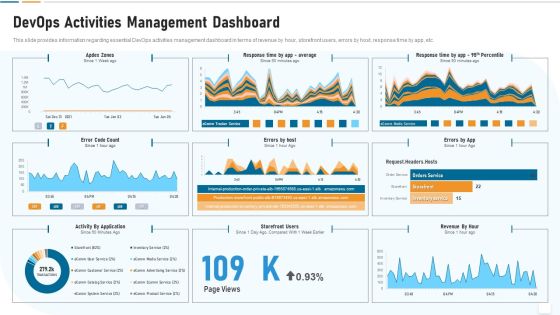
Strategic Development And Operations Execution IT Devops Activities Management Brochure PDF
This slide provides information regarding essential DevOps activities management dashboard in terms of revenue by hour, storefront users, errors by host, response time by app, etc. Deliver and pitch your topic in the best possible manner with this strategic development and operations execution it devops activities management brochure pdf. Use them to share invaluable insights on activity by application, revenue by hour, storefront users, errors by host, errors by app, error code count and impress your audience. This template can be altered and modified as per your expectations. So, grab it now.
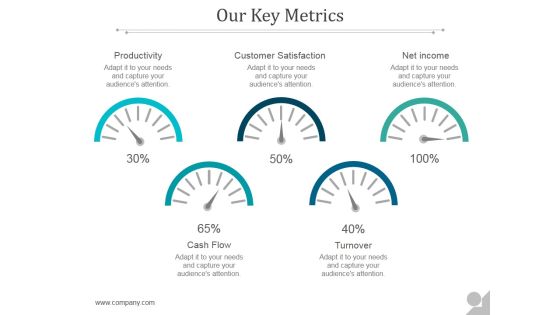
Our Key Metrics Ppt PowerPoint Presentation Examples
This is a our key metrics ppt powerpoint presentation examples. This is a five stage process. The stages in this process are productivity, customer satisfaction, net income, cash flow, turnover.
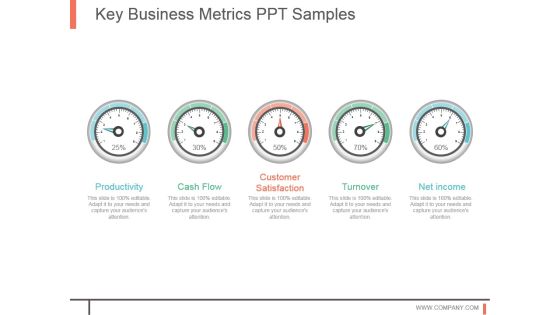
Key Business Metrics Ppt Samples
This is a key business metrics ppt samples. This is a five stage process. The stages in this process are productivity, cash flow, customer satisfaction, turnover, net income.

Our Key Metrics Ppt PowerPoint Presentation Portfolio
This is a our key metrics ppt powerpoint presentation portfolio. This is a five stage process. The stages in this process are cash flow, turnover, productivity, customer satisfaction, net income.

Financial Assessment Ppt PowerPoint Presentation Styles
This is a financial assessment ppt powerpoint presentation styles. This is a five stage process. The stages in this process are sales volume and value, variable cost of production, incremental fixed cost, contribution and profitability of the new service, claim canalization.
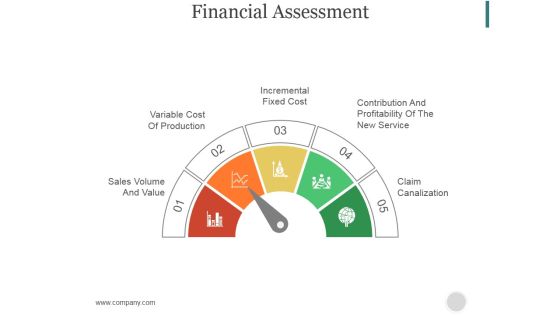
Financial Assessment Ppt PowerPoint Presentation Picture
This is a financial assessment ppt powerpoint presentation picture. This is a five stage process. The stages in this process are sales volume and value, variable cost of production, incremental fixed cost, contribution and profitability of the new service, claim canalization.

Customer Satisfaction Template Ppt PowerPoint Presentation Picture
This is a customer satisfaction template ppt powerpoint presentation picture. This is a three stage process. The stages in this process are overall satisfaction with service, satisfaction with value for money, overall satisfaction with relationship.
Project Profit Analysis Vector Icon Ppt PowerPoint Presentation Outline Graphics Template PDF
Presenting this set of slides with name project profit analysis vector icon ppt powerpoint presentation outline graphics template pdf. This is a three stage process. The stages in this process are project profit analysis vector icon. This is a completely editable PowerPoint presentation and is available for immediate download. Download now and impress your audience.

Enhance Profit Client Journey Analysis Measure Net Promoter Score Clipart PDF
The Net Promoter Score measures the willingness of customers to recommend the companys products or services to others. It helps in gauging the customers overall satisfaction with the companys product or service. This is a enhance profit client journey analysis measure net promoter score clipart pdf template with various stages. Focus and dispense information on three stages using this creative set, that comes with editable features. It contains large content boxes to add your information on topics like promoters, passives, detractors. You can also showcase facts, figures, and other relevant content using this PPT layout. Grab it now.

Balanced Scorecard Kpi S Ppt Slide Examples
This is a balanced scorecard kpi s ppt slide examples. This is a four stage process. The stages in this process are learning and growth, customer, financial, internal business processes.
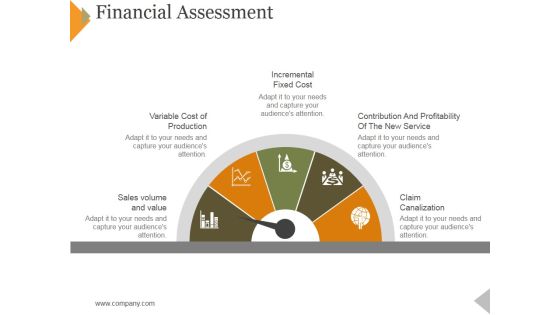
Financial Assessment Ppt PowerPoint Presentation Infographic Template Graphics Pictures
This is a financial assessment ppt powerpoint presentation infographic template graphics pictures. This is a five stage process. The stages in this process are incremental fixed cost, variable cost of production, volume and value, claim canalization.
Our Key Metrics Ppt PowerPoint Presentation Icon Slide
This is a our key metrics ppt powerpoint presentation icon slide. This is a five stage process. The stages in this process are cash flow, turnover, productivity, net income, customer satisfaction .
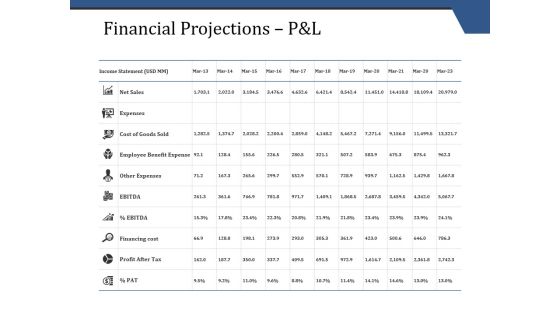
Financial Projections P And L Template 1 Ppt PowerPoint Presentation Portfolio Layouts
This is a financial projections p and l template 1 ppt powerpoint presentation portfolio layouts. This is a three stage process. The stages in this process are financial, marketing, investment, analysis, business.
Enterprise Analysis Customer Satisfaction Ppt Icon Backgrounds PDF
This is a enterprise analysis customer satisfaction ppt icon backgrounds pdf template with various stages. Focus and dispense information on three stages using this creative set, that comes with editable features. It contains large content boxes to add your information on topics like overall satisfaction with service, satisfaction with value for money, overall satisfaction with relationship. You can also showcase facts, figures, and other relevant content using this PPT layout. Grab it now.

Deal Assessment Audit Process Customer Satisfaction Icons PDF
Presenting deal assessment audit process customer satisfaction icons pdf to provide visual cues and insights. Share and navigate important information on three stages that need your due attention. This template can be used to pitch topics like overall satisfaction with service, satisfaction with value for money, overall satisfaction with relationship. In addition, this PPT design contains high-resolution images, graphics, etc, that are easily editable and available for immediate download.

Donut Pie Chart Ppt PowerPoint Presentation Infographic Template Diagrams
This is a donut pie chart ppt powerpoint presentation infographic template diagrams. This is a three stage process. The stages in this process are business, strategy, analysis, pretention, comparison.
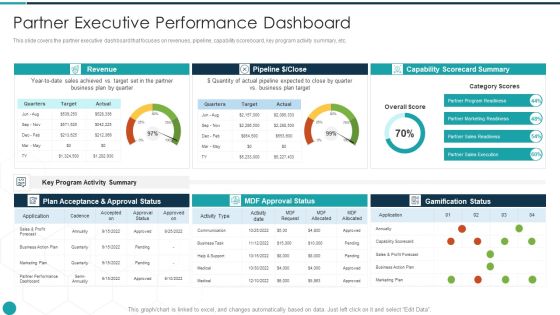
Upgrade Management Of Complex Business Associates Partner Executive Performance Ideas PDF
This slide covers the partner executive dashboard that focuses on revenues, pipeline, capability scoreboard, key program activity summary, etc. Deliver and pitch your topic in the best possible manner with this upgrade management of complex business associates partner executive performance ideas pdf. Use them to share invaluable insights on partner executive performance dashboard and impress your audience. This template can be altered and modified as per your expectations. So, grab it now.

Crisis Management Program Presentation Financial Performance Tracking Slides PDF
This slide presents the dashboard which will help firm in tracking the fiscal performance. This dashboard displays number of customers, vendors and revenues generated, expenses and profit incurred. Deliver and pitch your topic in the best possible manner with this crisis management program presentation financial performance tracking slides pdf. Use them to share invaluable insights on revenue, expense, profit, customer, financial performance tracking and impress your audience. This template can be altered and modified as per your expectations. So, grab it now.

Upgrade Management Of Complex Business Associates Actual And Planned Partner Themes PDF
This slide covers the partner executive dashboard that focuses on revenues, pipeline, capability scoreboard, along with actual and planned values quarterly. Deliver an awe inspiring pitch with this creative upgrade management of complex business associates actual and planned partner themes pdf bundle. Topics like revenue, target, plan can be discussed with this completely editable template. It is available for immediate download depending on the needs and requirements of the user.
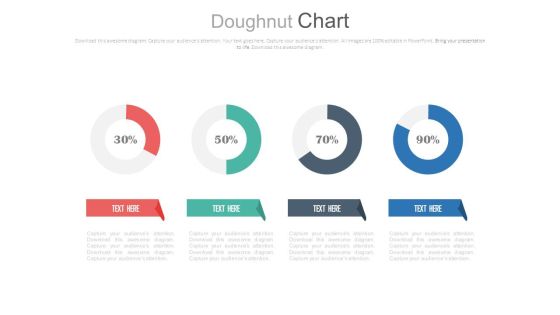
Four Circle Chart With Percentage Ratios Powerpoint Slides
This PowerPoint template has been designed with graphics of four circles and percentage ratios. You may use this dashboard slide design for topics like profit growth and financial planning. This PPT slide is powerful tool to describe your ideas.

Linear Circles Percentage Analysis Charts Powerpoint Slides
This PowerPoint template has been designed with graphics of three circles and percentage ratios. You may use this dashboard slide design for topics like profit growth and financial planning. This PPT slide is powerful tool to describe your ideas.
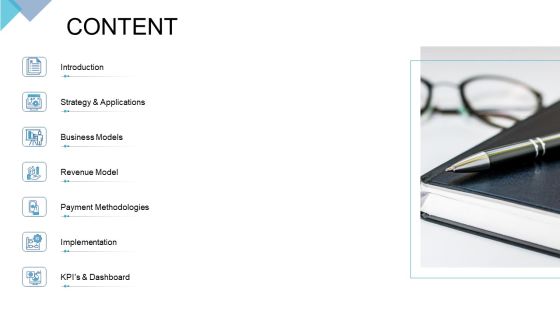
Digital Enterprise Management Content Ppt PowerPoint Presentation Layouts Graphics Design PDF
Presenting digital enterprise management content ppt powerpoint presentation layouts graphics design pdf to provide visual cues and insights. Share and navigate important information on seven stages that need your due attention. This template can be used to pitch topics like introduction, strategy and applications, business models, revenue model, payment methodologies, implementation, kpis and dashboard. In addition, this PPT design contains high-resolution images, graphics, etc, that are easily editable and available for immediate download.

Online Business Program Content Ppt Pictures Graphics PDF
Presenting online business program content ppt pictures graphics pdf to provide visual cues and insights. Share and navigate important information on seven stages that need your due attention. This template can be used to pitch topics like business models, revenue model, payment methodologies, strategy and applications, dashboard. In addition, this PPT design contains high-resolution images, graphics, etc, that are easily editable and available for immediate download.

Initiatives To Produce Effective Concept For Logistic Firm Logistics And Supply Chain Brochure PDF
The slide shows a Logistics and Supply Chain Dashboard for HCL Plus Logistics showing total revenue and costs, fleet efficiency status, delivery status, average delivery time, total shipments, average loading time, average loading weight etc. Deliver an awe inspiring pitch with this creative initiatives to produce effective concept for logistic firm logistics and supply chain brochure pdf bundle. Topics like revenue, costs, profit can be discussed with this completely editable template. It is available for immediate download depending on the needs and requirements of the user.
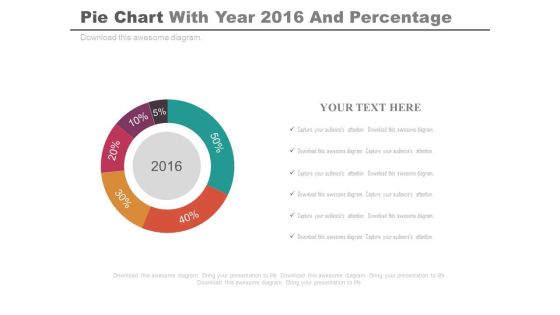
Pie Chart For Projected Profit Of 2016 Powerpoint Slides
Our above PPT slide displays graphics of Pie chart. This PowerPoint template may be used to display projected profit report of 2016. Download this template to leave permanent impression on your audience.

Four Steps For Financial Data Analysis Powerpoint Slides
This PowerPoint contains four circles with percentage values. Download this diagram slide to display financial data analysis. This template is editable, You can edit text, color, shade and style of this diagram as per you need.
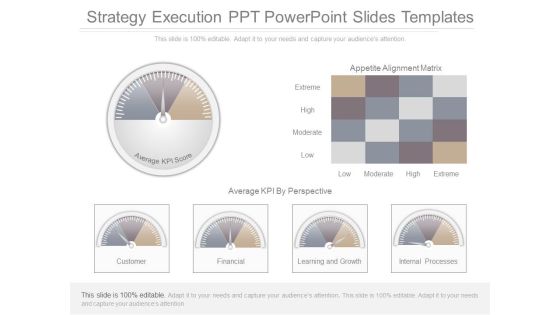
Strategy Execution Ppt Powerpoint Slides Templates
This is a strategy execution ppt powerpoint slides templates. This is a six stage process. The stages in this process are appetite alignment matrix, extreme, high, moderate, low, average kpi by prospective, customer, financial, learning and growth, internal processes, average kpi score.
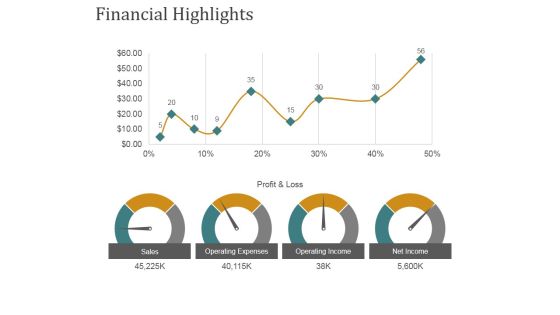
Financial Highlights Template 1 Ppt PowerPoint Presentation Gallery Templates
This is a financial highlights template 1 ppt powerpoint presentation gallery templates. This is a four stage process. The stages in this process are sales, operating expenses, operating income, net income.
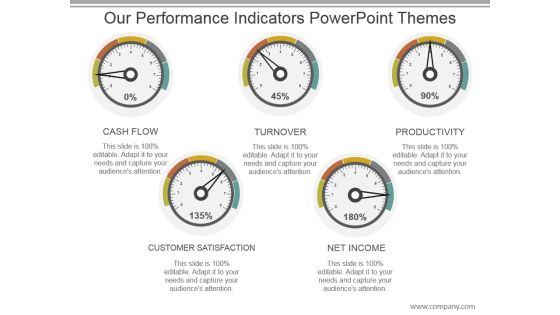
Our Performance Indicators Powerpoint Themes
This is a our performance indicators powerpoint themes. This is a five stage process. The stages in this process are cash flow, turnover, productivity, customer satisfaction, net income.

Website Performance Review Template 1 Ppt PowerPoint Presentation Portfolio Master Slide
This is a website performance review template 1 ppt powerpoint presentation portfolio master slide. This is a five stage process. The stages in this process are traffic sources, site consumption trend, online transaction, average visit time, organic branded.

Website Performance Review Slide Ppt PowerPoint Presentation Example 2015
This is a website performance review slide ppt powerpoint presentation example 2015. This is a four stage process. The stages in this process are traffic source, online transaction, conversion rate, average visit time.
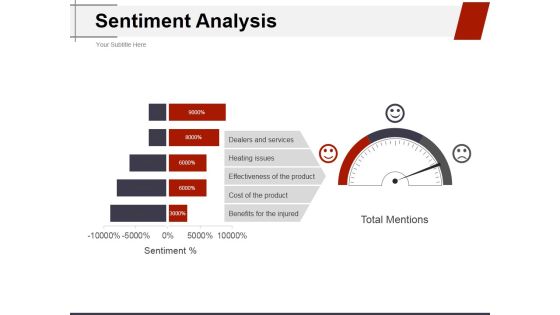
Sentiment Analysis Ppt PowerPoint Presentation Ideas Structure
This is a sentiment analysis ppt powerpoint presentation ideas structure. This is a three stage process. The stages in this process are dealers and services, heating issues, effectiveness of the product, cost of the product, benefits for the injured.
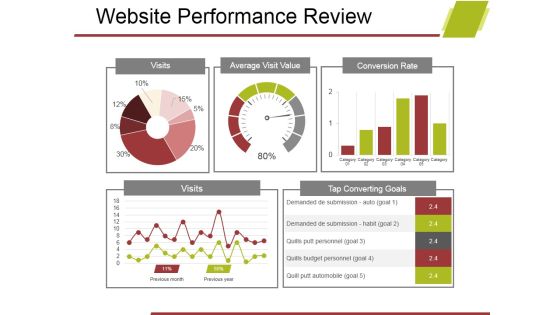
Website Performance Review Template 2 Ppt PowerPoint Presentation Model File Formats
This is a website performance review template 2 ppt powerpoint presentation model file formats. This is a five stage process. The stages in this process are visits, average visit value, conversion rate, visits, tap converting goals.

Customer Satisfaction Level In IBN Outsourcing Company For 5 Years Ppt Show Ideas PDF
This slide shows a Customer Attrition Rate Dashboard with KPIs such as Company Revenue , Customer Attrition Rate in 2021 , Annual Growth Rate , Average Customer Queue Time , Onboarding Process Effectiveness etc.Deliver and pitch your topic in the best possible manner with this customer satisfaction level in ibn outsourcing company for 5 years ppt show ideas pdf. Use them to share invaluable insights on customer satisfaction level, 2017 to 2021 and impress your audience. This template can be altered and modified as per your expectations. So, grab it now.
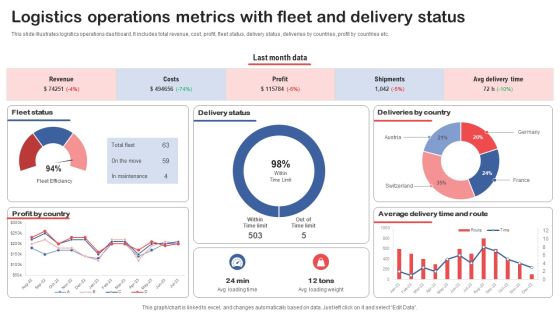
Logistics Operations Metrics With Fleet And Delivery Status Slides PDF
This slide illustrates logistics operations dashboard. It includes total revenue, cost, profit, fleet status, delivery status, deliveries by countries, profit by countries etc. Pitch your topic with ease and precision using this Logistics Operations Metrics With Fleet And Delivery Status Slides PDF. This layout presents information on Fleet Status, Delivery Status, Deliveries By Country. It is also available for immediate download and adjustment. So, changes can be made in the color, design, graphics or any other component to create a unique layout.

Online Marketing Report With Return On Investment Inspiration PDF
This slide shows digital marketing dashboard which includes total revenues, marketing spend, profits, lead generation, website traffic, cost per acquisition, pay per action with different channels such as display , fairs, search, social, television, etc.Showcasing this set of slides titled Online Marketing Report With Return On Investment Inspiration PDF The topics addressed in these templates are Leads Generation, Cost Acquisition, Return Investment All the content presented in this PPT design is completely editable. Download it and make adjustments in color, background, font etc. as per your unique business setting.
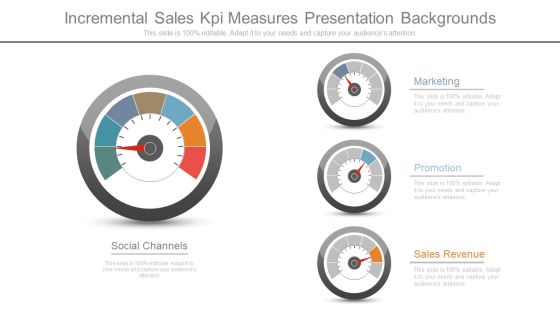
Incremental Sales Kpi Measures Presentation Backgrounds
This is a incremental sales kpi measures presentation backgrounds. This is a four stage process. The stages in this process are marketing, promotion, sales revenue, social channels.
Kpi Tracking Software Services Ppt Powerpoint Graphics
This is a kpi tracking software services ppt powerpoint graphics. This is a three stage process. The stages in this process are operations, revenue, manufacturing.

Four Companies With Web Services Powerpoint Slides
This PowerPoint template display graphics of four corporate buildings. You may use this PPT slide for financial and strategic analysis for web services companies. This dashboard slide may useful for multilevel status report creation and approval process.
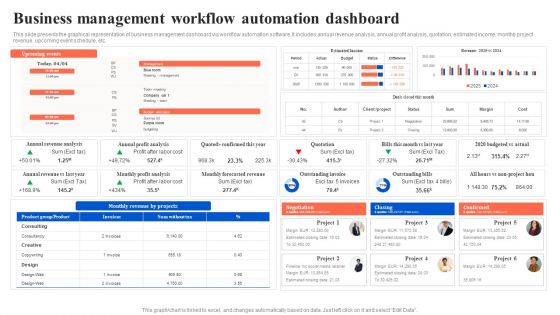
Workflow Automation For Optimizing Organizational Processes Business Management Workflow Infographics PDF
This slide presents the graphical representation of business management dashboard via workflow automation software. It includes annual revenue analysis, annual profit analysis, quotation, estimated income, monthly project revenue, upcoming event schedule, etc. Here you can discover an assortment of the finest PowerPoint and Google Slides templates. With these templates, you can create presentations for a variety of purposes while simultaneously providing your audience with an eye catching visual experience. Download Workflow Automation For Optimizing Organizational Processes Business Management Workflow Infographics PDF to deliver an impeccable presentation. These templates will make your job of preparing presentations much quicker, yet still, maintain a high level of quality. Slidegeeks has experienced researchers who prepare these templates and write high quality content for you. Later on, you can personalize the content by editing the Workflow Automation For Optimizing Organizational Processes Business Management Workflow Infographics PDF.

Deployment Of Process Automation To Increase Organisational Performance Business Management Workflow Themes PDF
This slide presents the graphical representation of business management dashboard via workflow automation software. It includes annual revenue analysis, annual profit analysis, quotation, estimated income, monthly project revenue, upcoming event schedule, etc. Presenting this PowerPoint presentation, titled Deployment Of Process Automation To Increase Organisational Performance Business Management Workflow Themes PDF, with topics curated by our researchers after extensive research. This editable presentation is available for immediate download and provides attractive features when used. Download now and captivate your audience. Presenting this Deployment Of Process Automation To Increase Organisational Performance Business Management Workflow Themes PDF. Our researchers have carefully researched and created these slides with all aspects taken into consideration. This is a completely customizable Deployment Of Process Automation To Increase Organisational Performance Business Management Workflow Themes PDF that is available for immediate downloading. Download now and make an impact on your audience. Highlight the attractive features available with our PPTs.
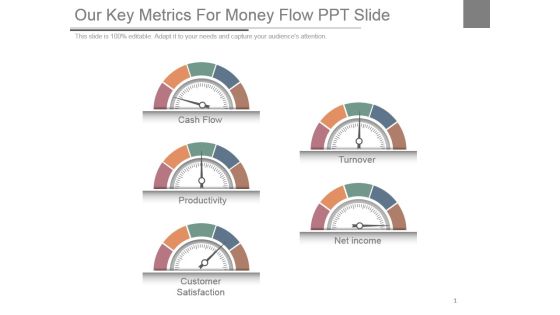
Our Key Metrics For Money Flow Ppt Slide
This is a our key metrics for money flow ppt slide. This is a five stage process. The stages in this process are cash flow, productivity, customer satisfaction, turnover, net income.

Financial Metrics And Kpi Template Presentation Visual Aids
This is a financial metrics and kpi template presentation visual aids. This is a three stage process. The stages in this process are operating profit last 12 months, total income act vs forecast between 2009 and 2010, income by qtr by tr between 2007 and 2010.

Project Results With Growth Rate And Net Income Inspiration PDF
Showcasing this set of slides titled project results with growth rate and net income inspiration pdf. The topics addressed in these templates are standard users, growth rate, ca users locations, net income, projection. All the content presented in this PPT design is completely editable. Download it and make adjustments in color, background, font etc. as per your unique business setting.

Three Stopwatches To Display Profit Trends Powerpoint Slides
This PowerPoint template has been designed with graphics of three stopwatches. Use this PPT slide to depict profit trends. Download this template to make impressive presentations.

Picture Of Working Overtime To Improve Income Ppt PowerPoint Presentation File Graphic Tips PDF
Presenting picture of working overtime to improve income ppt powerpoint presentation file graphic tips pdf to dispense important information. This template comprises three stages. It also presents valuable insights into the topics including picture of working overtime to improve income. This is a completely customizable PowerPoint theme that can be put to use immediately. So, download it and address the topic impactfully.

Financial Growth Analysis Circular Chart Powerpoint Slides
Visually support your presentation with our above template containing graphics of circular chart. This diagram slide helps to display financial growth analysis. Etch your views in the brains of your audience with this diagram slide.

Column Chart For Financial Analysis Powerpoint Slides
This PowerPoint template has been designed with graphics of column chart with percentage values. You may use this business slide design for topics like financial analysis and planning. This PPT slide is powerful tool to describe your ideas.

Our Key Performance Indicators Powerpoint Slide Designs
This is a our key performance indicators powerpoint slide designs. This is a five stage process. The stages in this process are cash flow, turnover, productivity, customer satisfaction, net income.

Concentric Chart With Five Financial Steps Powerpoint Slides
This PowerPoint slide contains diagram of concentric chart with five financial steps This professional slide helps to exhibit financial planning for business. Use this PowerPoint template to make impressive presentations.
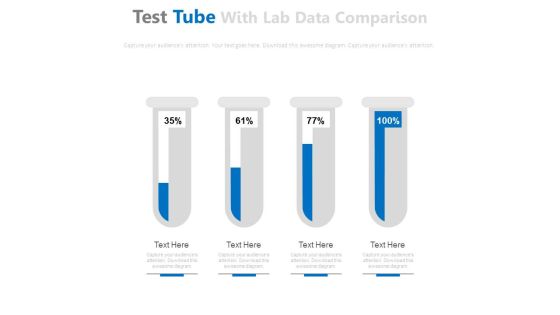
Test Tubes For Financial Ratio Analysis Powerpoint Slides
This PowerPoint template has been designed with graphics of test tubes. Use this PPT slide to depict financial ratio analysis. Download this PPT template to make impressive presentations.

Customer Service Key Performance Indicators Ppt Example
This is a customer service key performance indicators ppt example. This is a three stage process. The stages in this process are overall satisfaction with service, satisfaction with value for money, overall satisfaction with relationship.
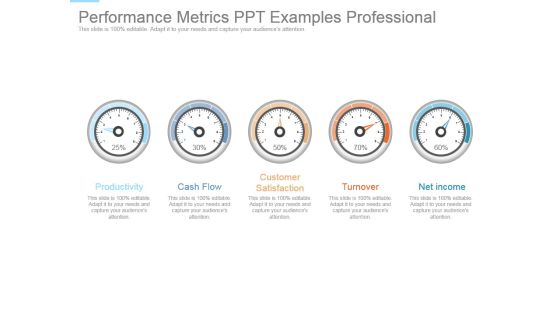
Performance Metrics Ppt Examples Professional
This is a performance metrics ppt examples professional. This is a five stage process. The stages in this process are productivity, cash flow, customer satisfaction, turnover, net income.

Marketing Performance Measures Diagram Ppt Example
This is a marketing performance measures diagram ppt example. This is a four stage process. The stages in this process are low, moderate, good, maximum.

Supply Chain Metrics And Kpi Examples Presentation Visuals
This is a supply chain metrics and kpi examples presentation visuals. This is a four stage process. The stages in this process are carrying cost of inventory, inventory turnover, order tracking, rate of return.
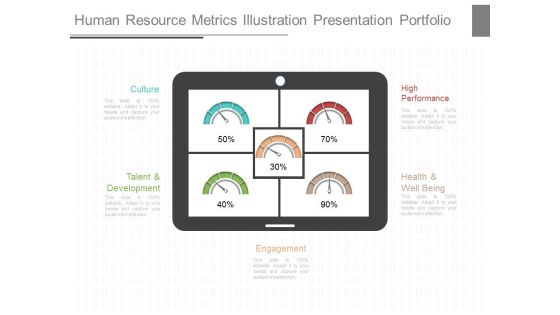
Human Resource Metrics Illustration Presentation Portfolio
This is a human resource metrics illustration presentation portfolio. This is a five stage process. The stages in this process are culture, high performance, talent and development, health and well being, engagement.
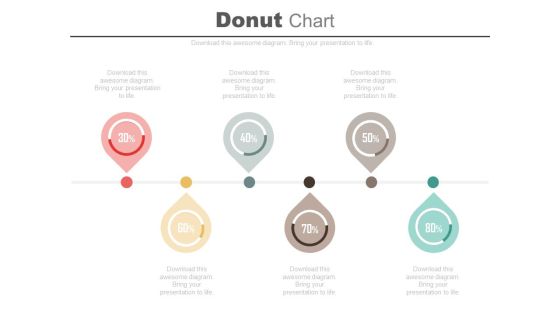
Six Pointers Percentage Timeline Diagram Powerpoint Slides
Profitability indicator ratios have been displayed this business slide. This PowerPoint template contains linear pointers timeline diagram. Use this professional diagram slide to build an exclusive presentation.

Implementation Of Growth Strategy Example Ppt Images Gallery
This is a implementation of growth strategy example ppt images gallery. This is a five stage process. The stages in this process are necessity of fit , importance of integrating strategy, strategy formulation, focus on structure, control issues, loss, profit.
Four Circles With Percentage Values And Icons Powerpoint Slides
This PowerPoint template displays info graphic diagram of linear circles. This diagram may be used to exhibit financial growth and analysis. Grab center stage with this slide and capture the attention of your audience.

Balanced Scorecard Success Layout Ppt Slide Show
This is a balanced scorecard success layout ppt slide show. This is a four stage process. The stages in this process are clinical quality, customer loyalty, financial viability, operational effectiveness.
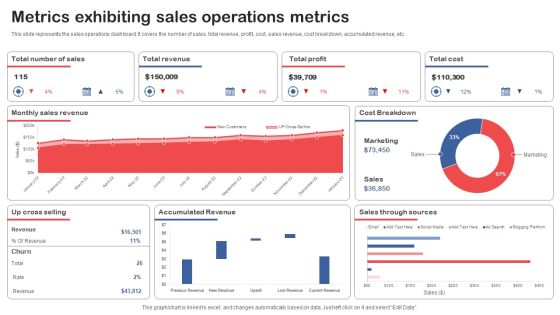
Metrics Exhibiting Sales Operations Metrics Topics PDF
This slide represents the sales operations dashboard. It covers the number of sales, total revenue, profit, cost, sales revenue, cost breakdown, accumulated revenue, etc. Showcasing this set of slides titled Metrics Exhibiting Sales Operations Metrics Topics PDF. The topics addressed in these templates are Total Revenue, Total Profit, Total Cost. All the content presented in this PPT design is completely editable. Download it and make adjustments in color, background, font etc. as per your unique business setting.
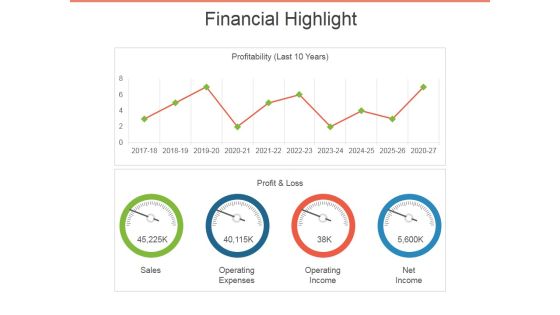
Financial Highlight Template 2 Ppt PowerPoint Presentation Outline Visuals
This is a financial highlight template 2 ppt powerpoint presentation outline visuals. This is a two stage process. The stages in this process are sales, profit and loss, operating expenses, operating income, net income.
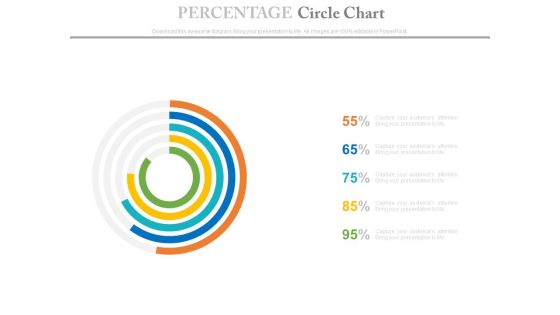
Percentage Data Circle Chart Powerpoint Slides
This PowerPoint template has been designed with circle chart. Download this PPT chart to depict financial ratio analysis. This PowerPoint slide is of great help in the business sector to make realistic presentations and provides effective way of presenting your newer thoughts.

Creating Successful Advertising Campaign Customer Satisfaction Score Graphics PDF
Following slide illustrates customer satisfaction score achieved by the firm in financial year 2019. It includes the statistics of customer satisfaction based on the survey done by the firm. Deliver an awe inspiring pitch with this creative creating successful advertising campaign customer satisfaction score graphics pdf bundle. Topics like customer satisfaction score can be discussed with this completely editable template. It is available for immediate download depending on the needs and requirements of the user.

Website Performance Review Template 2 Ppt PowerPoint Presentation Gallery Objects
This is a website performance review template 2 ppt powerpoint presentation gallery objects. This is a three stage process. The stages in this process are margin, revenue, expense, support, other operational.

Strategic Plan To Establish And Promote Brand Awareness Campaign Sessions And Conversion Structure PDF
Following slide illustrates campaign session and conversion performance dashboard. It covers details such as revenues, cost per click, transactions, impressions, sessions and conversion performance. Find a pre designed and impeccable Strategic Plan To Establish And Promote Brand Awareness Campaign Sessions And Conversion Structure PDF. The templates can ace your presentation without additional effort. You can download these easy to edit presentation templates to make your presentation stand out from others. So, what are you waiting for Download the template from Slidegeeks today and give a unique touch to your presentation.
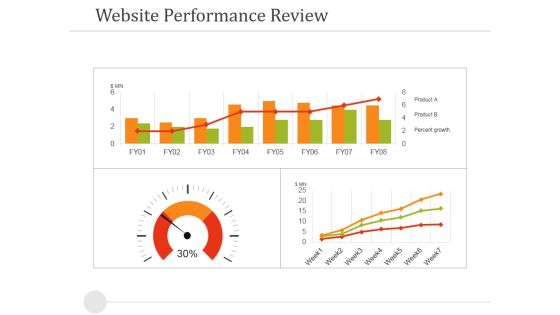
Website Performance Review Template 1 Ppt PowerPoint Presentation Portfolio Guide
This is a website performance review template 1 ppt powerpoint presentation portfolio guide. This is a four stage process. The stages in this process are website performance review, dashboard, business, marketing, finance.

Financial Summary Ppt PowerPoint Presentation Information
This is a financial summary ppt powerpoint presentation information. This is a two stage process. The stages in this process are revenue and gross profit, quarterly revenue split, revenue spilt by geography, revenue split by product mix, revenue split by segment sector.
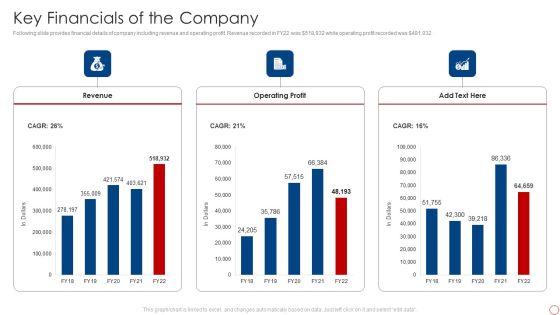
Kpis For Evaluating Business Sustainability Key Financials Of The Company Rules PDF
Following slide provides financial details of company including revenue and operating profit. Revenue recorded in FY22 was dollar 518,932 while operating profit recorded was dollar 481,932. Deliver and pitch your topic in the best possible manner with this Kpis For Evaluating Business Sustainability Financial Performance Indicator Dashboard Demonstration PDF. Use them to share invaluable insights on Revenue, Operating Profit and impress your audience. This template can be altered and modified as per your expectations. So, grab it now.

Comprehensive Guide To Enhance Campaign Sessions And Conversion Performance Portrait PDF
Following slide illustrates campaign session and conversion performance dashboard. It covers details such as revenues, cost per click, transactions, impressions, sessions and conversion performance. Slidegeeks is here to make your presentations a breeze with Comprehensive Guide To Enhance Campaign Sessions And Conversion Performance Portrait PDF With our easy-to-use and customizable templates, you can focus on delivering your ideas rather than worrying about formatting. With a variety of designs to choose from, youre sure to find one that suits your needs. And with animations and unique photos, illustrations, and fonts, you can make your presentation pop. So whether youre giving a sales pitch or presenting to the board, make sure to check out Slidegeeks first.
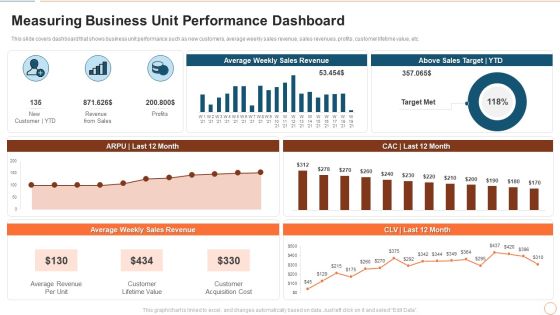
Illustrating Product Leadership Plan Incorporating Innovative Techniques Measuring Business Unit Professional PDF
This slide covers dashboard that shows business unit performance such as new customers, average weekly sales revenue, sales revenues, profits, customer lifetime value, etc. Deliver an awe inspiring pitch with this creative illustrating product leadership plan incorporating innovative techniques measuring business unit professional pdf bundle. Topics like average revenue per unit, customer lifetime value, customer acquisition cost can be discussed with this completely editable template. It is available for immediate download depending on the needs and requirements of the user.

Formulating Competitive Plan Of Action For Effective Product Leadership Measuring Business Unit Slides PDF
This slide covers dashboard that shows business unit performance such as new customers, average weekly sales revenue, sales revenues, profits, customer lifetime value, etc. Deliver an awe inspiring pitch with this creative formulating competitive plan of action for effective product leadership measuring business unit slides pdf bundle. Topics like average revenue per unit, customer lifetime value, customer acquisition cost can be discussed with this completely editable template. It is available for immediate download depending on the needs and requirements of the user.
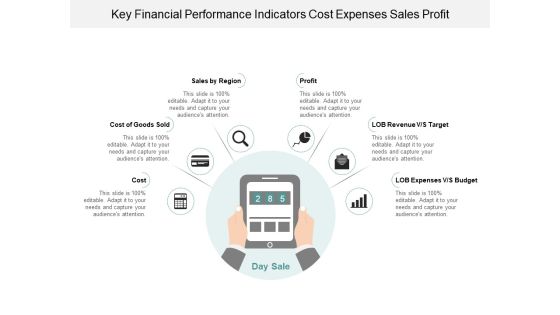
Key Financial Performance Indicators Cost Expenses Sales Profit Ppt Powerpoint Presentation Infographic Template Graphic Images
This is a key financial performance indicators cost expenses sales profit ppt powerpoint presentation infographic template graphic images. This is a six stage process. The stages in this process are dashboard, kpi, metrics.

Profitability Key Performance Indicators Financial Activities Cash Flow Ppt Powerpoint Presentation Portfolio Clipart Images
This is a profitability key performance indicators financial activities cash flow ppt powerpoint presentation portfolio clipart images. This is a five stage process. The stages in this process are dashboard, kpi, metrics.

Financial Kpis For Business Growth Liquidity Efficiency And Solvency Ppt Powerpoint Presentation Summary Gridlines
This is a financial kpis for business growth liquidity efficiency and solvency ppt powerpoint presentation summary gridlines. This is a seven stage process. The stages in this process are dashboard, kpi, metrics.
KPI Metrics Vector Icon Ppt PowerPoint Presentation Layouts Slide
This is a kpi metrics vector icon ppt powerpoint presentation layouts slide. This is a three stage process. The stages in this process are kpi proposal, kpi plan, kpi scheme.
Monthly Services Business Marketing Strategy Implementation Timeline Professional PDF
Following slide demonstrates dashboard for monitoring services company sales strategy impact on maximizing business profits. It includes elements such as number of sales, revenue, profit, cost, monthly sales revenue, cost breakdown, up and cross sell, revenue collected and sales by communication channel. Showcasing this set of slides titled Monthly Services Business Marketing Strategy Implementation Timeline Professional PDF. The topics addressed in these templates are Strategy, Lead Generation, Customer Retention. All the content presented in this PPT design is completely editable. Download it and make adjustments in color, background, font etc. as per your unique business setting.
Empty Funds Finance PowerPoint Template 0610
Cash gauge on the dashboard approaching empty value
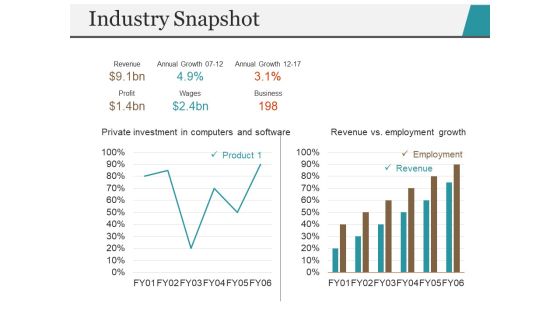
Industry Snapshot Template 1 Ppt PowerPoint Presentation Professional Design Inspiration
This is a industry snapshot template 1 ppt powerpoint presentation professional design inspiration. This is a two stage process. The stages in this process are revenue vs employment growth, employment, revenue, business, annual growth.
Information Technology Service Integration Post Acquisition Merger Customer Service Measuring Icons PDF
This slide illustrates customer service dashboard covering informational stats about NPS score, growth rate, customer distribution, top customer locations, inbound leads and revenue by type. Deliver an awe inspiring pitch with this creative information technology service integration post acquisition merger customer service measuring icons pdf bundle. Topics like customer service measuring kpi dashboard can be discussed with this completely editable template. It is available for immediate download depending on the needs and requirements of the user.

Post Merger Information Technology Service Delivery Amalgamation Customer Performance Measuring Themes PDF
This slide illustrates customer service dashboard covering informational stats about NPS score, growth rate, customer distribution, top customer locations, inbound leads and revenue by type. Deliver an awe inspiring pitch with this creative post merger information technology service delivery amalgamation customer performance measuring themes pdf bundle. Topics like customer performance measuring service dashboard can be discussed with this completely editable template. It is available for immediate download depending on the needs and requirements of the user.

Financial Statement Ppt PowerPoint Presentation Professional Clipart
This is a financial statement ppt powerpoint presentation professional clipart. This is a five stage process. The stages in this process are revenue trends, revenue growth, deal drop off by stage, trends of sales cycle times.

Financial Statement Ppt PowerPoint Presentation Outline File Formats
This is a financial statement ppt powerpoint presentation outline file formats. This is a five stage process. The stages in this process are trends of sales cycle times, quarter over quarter revenue growth, revenue trends, deal drop off by stage.
Developing Significant Business Product And Customer Performance Tracking Clipart PDF
This slide provides information regarding dashboard utilized by firm to monitor performance of products offered and customer associated. The performance is tracked through revenues generated, new customer acquired, customer satisfaction, sales comparison, etc. Deliver and pitch your topic in the best possible manner with this Developing Significant Business Product And Customer Performance Tracking Clipart PDF. Use them to share invaluable insights on Revenue, New Customer, Revenue and impress your audience. This template can be altered and modified as per your expectations. So, grab it now.

Effective Company Event Communication Plan Email Marketing Action Steps And Best Practices Information PDF
This slide covers metrics for analyzing the event revenue and registrations. It includes KPIs such as gross revenue, gross revenue from promos, total refund, total registration, visits to purchase conversion, check-in- status, etc. Deliver and pitch your topic in the best possible manner with this Effective Company Event Communication Plan Email Marketing Action Steps And Best Practices Information PDF Use them to share invaluable insights on Registration Analysis, Revenue Analysis, Gross Revenue and impress your audience. This template can be altered and modified as per your expectations. So, grab it now.
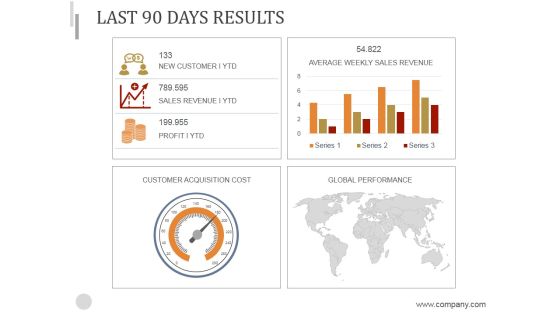
Last 90 Days Results Ppt PowerPoint Presentation Background Image
This is a last 90 days results ppt powerpoint presentation background image. This is a four stage process. The stages in this process are customer acquisition cost, global performance, average weekly sales revenue.

Technology Innovation Human Resource System HR Key Performance Indicators Ppt Styles Designs Download PDF
The dashboard focus on monitoring the internal hire rate, percentage of eligible candidate, revenue per employee and workforce below job standard. Presenting technology innovation human resource system hr key performance indicators ppt styles designs download pdf to provide visual cues and insights. Share and navigate important information on four stages that need your due attention. This template can be used to pitch topics like revenue per employee, performance standards, internal rate. In addition, this PPT design contains high-resolution images, graphics, etc, that are easily editable and available for immediate download.
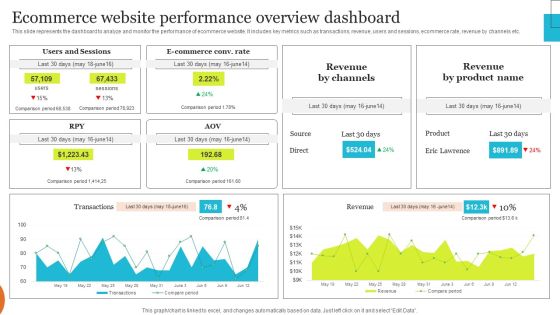
Implementing Effective Ecommerce Managemnet Platform Ecommerce Website Performance Overview Template PDF
This slide represents the dashboard to analyze and monitor the performance of ecommerce website. It includes key metrics such as transactions, revenue, users and sessions, ecommerce rate, revenue by channels etc. Boost your pitch with our creative Implementing Effective Ecommerce Managemnet Platform Ecommerce Website Performance Overview Template PDF. Deliver an awe-inspiring pitch that will mesmerize everyone. Using these presentation templates you will surely catch everyones attention. You can browse the ppts collection on our website. We have researchers who are experts at creating the right content for the templates. So you do not have to invest time in any additional work. Just grab the template now and use them.

Essentials Of Statistics For Business And Economics Ppt Powerpoint Presentation Pictures Styles
This is a essentials of statistics for business and economics ppt powerpoint presentation pictures styles. This is a three stage process. The stages in this process are business metrics, business kpi, business dashboard.
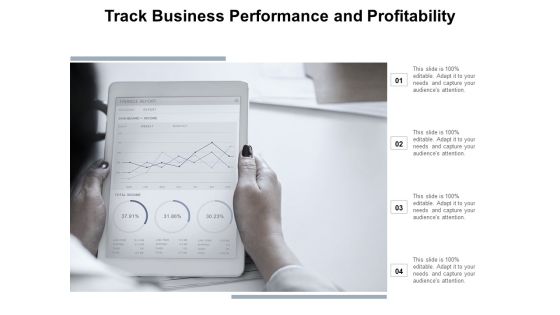
Track Business Performance And Profitability Ppt Powerpoint Presentation File Master Slide
This is a track business performance and profitability ppt powerpoint presentation file master slide. This is a four stage process. The stages in this process are business metrics, business kpi, business dashboard.

Metrics To Measure Business Performance Key Financials Of The Company Elements PDF
Following slide provides financial details of company including revenue and operating profit. Revenue recorded in FY22 was dollar 518,932 while operating profit recorded was dollar 481,932. Deliver an awe inspiring pitch with this creative Metrics To Measure Business Performance Key Financials Of The Company Elements PDF bundle. Topics like Revenue, Operating Profit can be discussed with this completely editable template. It is available for immediate download depending on the needs and requirements of the user.

Enterprise Sustainability Performance Metrics Key Financials Of The Company Rules PDF
Following slide provides financial details of company including revenue and operating profit. Revenue recorded in FY22 was dollar518,932 while operating profit recorded was dollar481,932.Deliver an awe inspiring pitch with this creative Enterprise Sustainability Performance Metrics Key Financials Of The Company Rules PDF bundle. Topics like Operating, Profit, Revenue can be discussed with this completely editable template. It is available for immediate download depending on the needs and requirements of the user.

Sales Data Requirements For Analytics For Business Growth Information PDF
This slide provides information about sales data requirement analysis for business growth which contains different KPIs such as total revenue, revenue by product, percentage of revenue from existing customers and new business. Pitch your topic with ease and precision using this sales data requirements for analytics for business growth information pdf. This layout presents information on customers, revenue, business. It is also available for immediate download and adjustment. So, changes can be made in the color, design, graphics or any other component to create a unique layout.

Data Statistics Charts And Key Performance Indicators Ppt Powerpoint Presentation Layouts Guide
This is a data statistics charts and key performance indicators ppt powerpoint presentation layouts guide. This is a four stage process. The stages in this process are business metrics, business kpi, business dashboard.
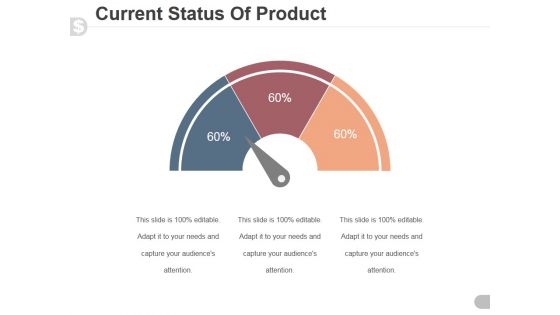
Current Status Of Product Ppt PowerPoint Presentation Designs Download
This is a current status of product ppt powerpoint presentation designs download. This is a three stage process. The stages in this process are speedometer, dashboard, business, marketing, finance.

Bar Chart With Magnifying Glass For Financial Analysis Ppt Powerpoint Presentation Infographics Designs Download
This is a bar chart with magnifying glass for financial analysis ppt powerpoint presentation infographics designs download. This is a three stage process. The stages in this process are business metrics, business kpi, business dashboard.

B2B Sales Procedure Counselling Core Drivers Of Sales Performance Management Infographics PDF
This slide provides the glimpse about the core drivers of sales performance management plan which focuses on revenue model, process, talent, technology and measurements. Deliver an awe-inspiring pitch with this creative b2b sales procedure counselling core drivers of sales performance management infographics pdf bundle. Topics like revenue model, revenue process, talent, technology, measurement can be discussed with this completely editable template. It is available for immediate download depending on the needs and requirements of the user.

Financial Charts And Graphs For Statistical Analysis Ppt Powerpoint Presentation Show Layout
This is a financial charts and graphs for statistical analysis ppt powerpoint presentation show layout. This is a four stage process. The stages in this process are business metrics, business kpi, business dashboard.
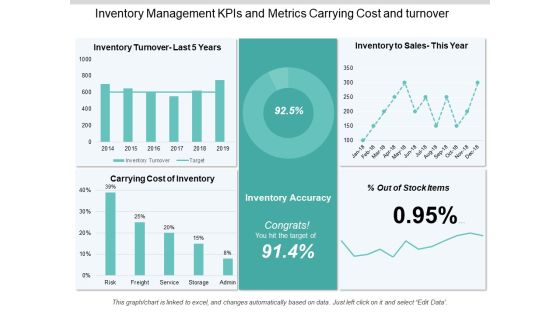
Inventory Management Kpis And Metrics Carrying Cost And Turnover Ppt PowerPoint Presentation Information
This is a inventory management kpis and metrics carrying cost and turnover ppt powerpoint presentation information. This is a five stage process. The stages in this process are logistics performance, logistics dashboard, logistics kpis.

Kpis In Shipping Perfect Order Rate And On Time Shipment Ppt PowerPoint Presentation Show Guide
This is a kpis in shipping perfect order rate and on time shipment ppt powerpoint presentation show guide. This is a six stage process. The stages in this process are logistics performance, logistics dashboard, logistics kpis.
Logistics Kpis And Metrics Percentage Of Orders Delivered Ppt PowerPoint Presentation Icon
This is a logistics kpis and metrics percentage of orders delivered ppt powerpoint presentation icon. This is a five stage process. The stages in this process are logistics performance, logistics dashboard, logistics kpis.

Calculator With Business Reports For Operational Efficiency Ppt Powerpoint Presentation Ideas Infographic Template
This is a calculator with business reports for operational efficiency ppt powerpoint presentation ideas infographic template. This is a four stage process. The stages in this process are business metrics, business kpi, business dashboard.

Metrics For Project Success Benefits And Return Of Investment Ppt PowerPoint Presentation Pictures Structure
This is a metrics for project success benefits and return of investment ppt powerpoint presentation pictures structure. This is a four stage process. The stages in this process are project dashboard, project kpis, project metrics.

Metrics In Project Management Planning Design Development Ppt PowerPoint Presentation Outline Show
This is a metrics in project management planning design development ppt powerpoint presentation outline show. This is a two stage process. The stages in this process are project dashboard, project kpis, project metrics.

