Revenue Dashboard

Logistics Dashboard For XYZ Logistic Company Orders Ppt Infographic Template Diagrams PDF
The slide shows the logistic measurement dashboard for measuring order status, total orders, overdue shipments, global financial performance etc. Deliver and pitch your topic in the best possible manner with this logistics dashboard for xyz logistic company orders ppt infographic template diagrams pdf. Use them to share invaluable insights on global financial performance, orders, inventory and impress your audience. This template can be altered and modified as per your expectations. So, grab it now.

Logistics Dashboard For XYZ Logistic Company Inventory Ppt Infographic Template Background PDF
The slide shows the logistic measurement dashboard for measuring order status, total orders, overdue shipments, global financial performance etc.Deliver and pitch your topic in the best possible manner with this logistics dashboard for XYZ logistic company inventory ppt infographic template background pdf. Use them to share invaluable insights on global financial performance, orders, volume today and impress your audience. This template can be altered and modified as per your expectations. So, grab it now.

Initiating Hazard Managing Structure Firm Operational Risk Management Dashboard Brochure PDF
This slide illustrates dashboard for operational risk management. It includes information about total risk events, financial impact, risks by rating and risks by month. Deliver an awe-inspiring pitch with this creative initiating hazard managing structure firm operational risk management dashboard brochure pdf bundle. Topics like financial impact, operational risk, risk events, risk rating can be discussed with this completely editable template. It is available for immediate download depending on the needs and requirements of the user.
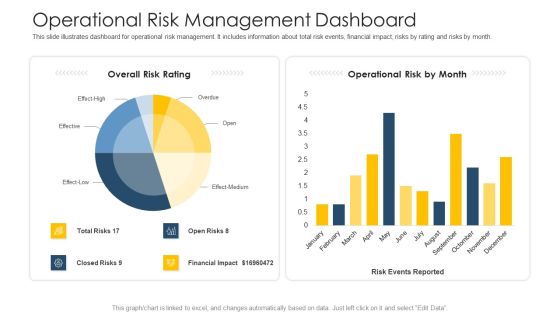
Establishing Operational Risk Framework Banking Operational Risk Management Dashboard Slides PDF
This slide illustrates dashboard for operational risk management. It includes information about total risk events, financial impact, risks by rating and risks by month. Deliver and pitch your topic in the best possible manner with this establishing operational risk framework banking operational risk management dashboard slides pdf. Use them to share invaluable insights on financial impact, operational risk, overall risk rating and impress your audience. This template can be altered and modified as per your expectations. So, grab it now.
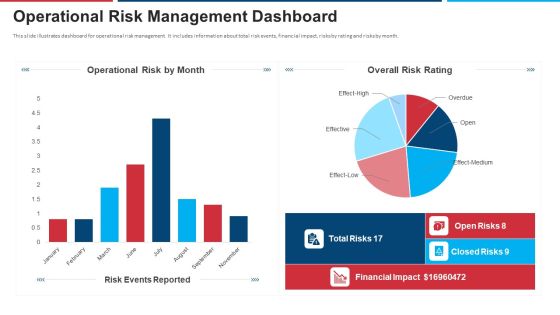
Mitigation Strategies For Operational Threat Operational Risk Management Dashboard Ppt Layouts Example PDF
This slide illustrates dashboard for operational risk management. It includes information about total risk events, financial impact, risks by rating and risks by month. Deliver and pitch your topic in the best possible manner with this mitigation strategies for operational threat operational risk management dashboard ppt layouts example pdf. Use them to share invaluable insights on financial, effective, operational risk, overall risk rating and impress your audience. This template can be altered and modified as per your expectations. So, grab it now.

Coffee Shop Business Dashboard Category Blueprint For Opening A Coffee Shop Ppt Slides PDF
This slide shows the coffee shop business dashboard which includes sales month, gross margin by category, sales and profit details, etc. Deliver and pitch your topic in the best possible manner with this coffee shop business dashboard category blueprint for opening a coffee shop ppt slides pdf. Use them to share invaluable insights on sales, plan, gross margin and impress your audience. This template can be altered and modified as per your expectations. So, grab it now.

Coffee Shop Business Dashboard Category Business Plan For Opening A Coffeehouse Ppt Slides Graphics Example PDF
This slide shows the coffee shop business dashboard which includes sales month, gross margin by category, sales and profit details, etc. Deliver and pitch your topic in the best possible manner with this coffee shop business dashboard category business plan for opening a coffeehouse ppt slides graphics example pdf. Use them to share invaluable insights on sales, plan, gross margin and impress your audience. This template can be altered and modified as per your expectations. So, grab it now.
Administering Logistics Activities In SCM Supply Chain Activity Tracking Dashboard Elements PDF
This slide shows the dashboard that depicts supply chain management which includes retailer and warehouse capacity, delivery status from supplier to warehouse, time to reach there, etc. Deliver and pitch your topic in the best possible manner with this Administering Logistics Activities In SCM Supply Chain Activity Tracking Dashboard Elements PDF. Use them to share invaluable insights on Warehouse Capacity, Profitability, Sustainability and impress your audience. This template can be altered and modified as per your expectations. So, grab it now.

CRM Pipeline Administration Tracking Sales Pipeline And Lead Activity Dashboard Formats PDF
This slide covers information regarding dashboard associated to tracking lead activity across sales pipeline. Make sure to capture your audiences attention in your business displays with our gratis customizable CRM Pipeline Administration Tracking Sales Pipeline And Lead Activity Dashboard Formats PDF. These are great for business strategies, office conferences, capital raising or task suggestions. If you desire to acquire more customers for your tech business and ensure they stay satisfied, create your own sales presentation with these plain slides.
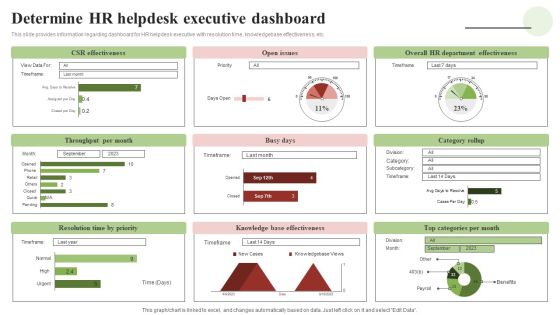
Transforming Human Resource Service Delivery Procedure Determine HR Helpdesk Executive Dashboard Background PDF
This slide provides information regarding dashboard for HR helpdesk executive with resolution time, knowledgebase effectiveness, etc. Make sure to capture your audiences attention in your business displays with our gratis customizable Transforming Human Resource Service Delivery Procedure Determine HR Helpdesk Executive Dashboard Background PDF. These are great for business strategies, office conferences, capital raising or task suggestions. If you desire to acquire more customers for your tech business and ensure they stay satisfied, create your own sales presentation with these plain slides.

Fiscal And Operational Assessment Infrastructure KPI Dashboard Showing Resource Allocation Mockup PDF
Deliver an awe inspiring pitch with this creative fiscal and operational assessment infrastructure kpi dashboard showing resource allocation mockup pdf bundle. Topics like resource allocation, project financial, days per project can be discussed with this completely editable template. It is available for immediate download depending on the needs and requirements of the user.
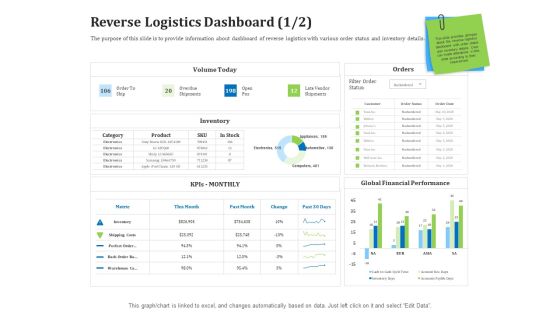
Reverse Logistics Management Reverse Logistics Dashboard Days Ppt Infographics Files PDF
The purpose of this slide is to provide information about dashboard of reverse logistics with various order status and inventory details. Deliver an awe inspiring pitch with this creative reverse logistics management reverse logistics dashboard days ppt infographics files pdf bundle. Topics like global, financial, performance, metric, inventory can be discussed with this completely editable template. It is available for immediate download depending on the needs and requirements of the user.
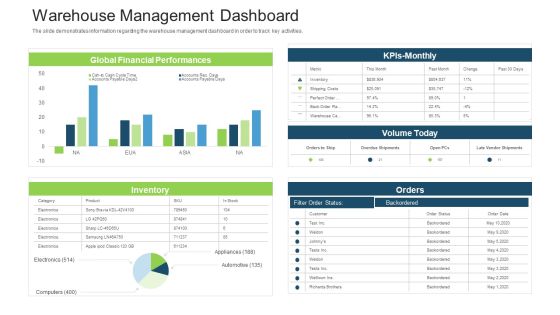
Stock Control System Warehouse Management Dashboard Ppt Visual Aids Outline PDF
The slide demonstrates information regarding the warehouse management dashboard in order to track key activities. Deliver and pitch your topic in the best possible manner with this stock control system warehouse management dashboard ppt visual aids outline pdf. Use them to share invaluable insights on kpls monthly, orders, inventory, global financial performances, volume today and impress your audience. This template can be altered and modified as per your expectations. So, grab it now.

Stock Repository Management For Inventory Control Warehouse Management Dashboard Brochure PDF
The slide demonstrates information regarding the warehouse management dashboard in order to track key activities. Deliver and pitch your topic in the best possible manner with this stock repository management for inventory control warehouse management dashboard brochure pdf. Use them to share invaluable insights on financial performances, inventory, warehouse and impress your audience. This template can be altered and modified as per your expectations. So, grab it now.
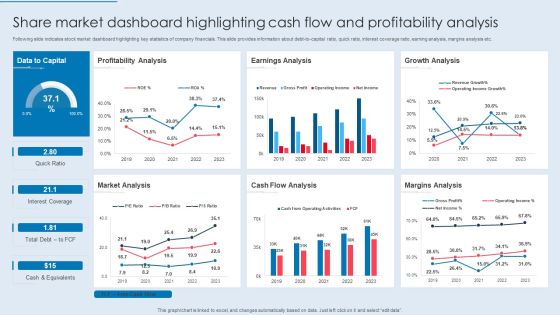
Share Market Dashboard Highlighting Cash Flow And Profitability Analysis Information PDF
Following slide indicates stock market dashboard highlighting key statistics of company financials. This slide provides information about debt-to-capital ratio, quick ratio, interest coverage ratio, earning analysis, margins analysis etc. Showcasing this set of slides titled Share Market Dashboard Highlighting Cash Flow And Profitability Analysis Information PDF. The topics addressed in these templates are Profitability Analysis, Earnings Analysis, Growth Analysis. All the content presented in this PPT design is completely editable. Download it and make adjustments in color, background, font etc. as per your unique business setting.

Stock Market Analysis Dashboard With Market Capitalization And Net Profit Elements PDF
Following slide showcase comprehensive stock market dashboard which will assist companies for the comparison purpose. The metrics covered in the slide are top stocks by market capitalization, EPS, net profit and PE ratio. Pitch your topic with ease and precision using this Stock Market Analysis Dashboard With Market Capitalization And Net Profit Elements PDF. This layout presents information on Company, Net Profit, Market Capitalization. It is also available for immediate download and adjustment. So, changes can be made in the color, design, graphics or any other component to create a unique layout.

Analyzing The Economic Project Management Dashboard With Budget And Upcoming Graphics PDF
The following slide shows a project management dashboard with information related to project planning, project design, projected launch date, overdue tasks, workload distribution, upcoming deadlines etc. If you are looking for a format to display your unique thoughts, then the professionally designed Analyzing The Economic Project Management Dashboard With Budget And Upcoming Graphics PDF is the one for you. You can use it as a Google Slides template or a PowerPoint template. Incorporate impressive visuals, symbols, images, and other charts. Modify or reorganize the text boxes as you desire. Experiment with shade schemes and font pairings. Alter, share or cooperate with other people on your work. Download Analyzing The Economic Project Management Dashboard With Budget And Upcoming Graphics PDF and find out how to give a successful presentation. Present a perfect display to your team and make your presentation unforgettable.

R2R Dashboard With Income Statement Ppt PowerPoint Presentation Show Slide Download PDF
Following slide outlines a comprehensive R2R dashboard used for taking financial decisions. The various metrics covered in this slide are total income, expenses, net profit, cash at end of month, income and expenses, quick ratio, current ratio etc.Showcasing this set of slides titled R2R Dashboard With Income Statement Ppt PowerPoint Presentation Show Slide Download PDF. The topics addressed in these templates are Operating Expenses, Total Experience, Accounts Receivable. All the content presented in this PPT design is completely editable. Download it and make adjustments in color, background, font etc. as per your unique business setting.

Dashboard Indicating Online Store Accounts Overview Financial Management Strategies Clipart PDF
The following slide showcases ecommerce accounts management dashboard. It provides information about income, expenses, cash collected, cash spent, tax collected, tax claim, stock sold, invoice, etc.From laying roadmaps to briefing everything in detail, our templates are perfect for you. You can set the stage with your presentation slides. All you have to do is download these easy-to-edit and customizable templates. Dashboard Indicating Online Store Accounts Overview Financial Management Strategies Clipart PDF will help you deliver an outstanding performance that everyone would remember and praise you for. Do download this presentation today.

Business Dashboard Showing Income And Expenditure Ppt PowerPoint Presentation Pictures Good PDF
Presenting this set of slides with name business dashboard showing income and expenditure ppt powerpoint presentation pictures good pdf. The topics discussed in these slides are actual income, business spending by category, estimated taxes, business income, taxes and licenses, assets, car and truck. This is a completely editable PowerPoint presentation and is available for immediate download. Download now and impress your audience.
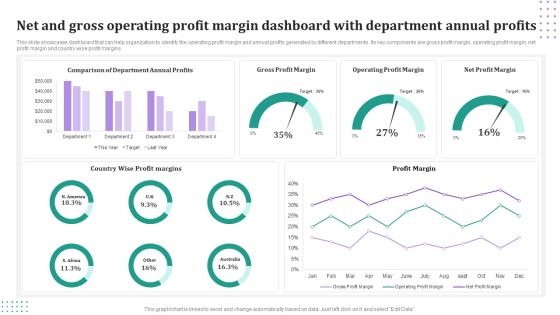
Net And Gross Operating Profit Margin Dashboard With Department Annual Profits Mockup PDF
This slide showcases dashboard that can help organization to identify the operating profit margin and annual profits generated by different departments. Its key components are gross profit margin, operating profit margin, net profit margin and country wise profit margins. Pitch your topic with ease and precision using this Net And Gross Operating Profit Margin Dashboard With Department Annual Profits Mockup PDF. This layout presents information on Gross Profit Margin, Operating Profit Margin, Net Profit Margin. It is also available for immediate download and adjustment. So, changes can be made in the color, design, graphics or any other component to create a unique layout.

KPI Dashboard To Analyze Performance Of Healthcare Financial Department Summary PDF
The following slide showcases key performance indicator KPI dashboard which can be used to analyze the financial performance of hospital. The metrics covered in the slide are net profit margin, income and expenses, etc. Do you have an important presentation coming up Are you looking for something that will make your presentation stand out from the rest Look no further than KPI Dashboard To Analyze Performance Of Healthcare Financial Department Summary PDF. With our professional designs, you can trust that your presentation will pop and make delivering it a smooth process. And with Slidegeeks, you can trust that your presentation will be unique and memorable. So why wait Grab KPI Dashboard To Analyze Performance Of Healthcare Financial Department Summary PDF today and make your presentation stand out from the rest.

Guide To Healthcare Services Administration KPI Dashboard To Analyze Performance Healthcare Financial Demonstration PDF
The following slide showcases key performance indicator KPI dashboard which can be used to analyze the financial performance of hospital. The metrics covered in the slide are net profit margin, income and expenses, etc. Here you can discover an assortment of the finest PowerPoint and Google Slides templates. With these templates, you can create presentations for a variety of purposes while simultaneously providing your audience with an eye catching visual experience. Download Guide To Healthcare Services Administration KPI Dashboard To Analyze Performance Healthcare Financial Demonstration PDF to deliver an impeccable presentation. These templates will make your job of preparing presentations much quicker, yet still, maintain a high level of quality. Slidegeeks has experienced researchers who prepare these templates and write high quality content for you. Later on, you can personalize the content by editing the Guide To Healthcare Services Administration KPI Dashboard To Analyze Performance Healthcare Financial Demonstration PDF.

Product Overview Management System Dashboard Showing Profit And Loss Topics PDF
This slide shows the dashboard of product information management system. It highlights information related to profit and loss, net income, expenses etc. along with order status of products. Showcasing this set of slides titled Product Overview Management System Dashboard Showing Profit And Loss Themes PDF. The topics addressed in these templates are Profit Loss, Order Status, Expenses. All the content presented in this PPT design is completely editable. Download it and make adjustments in color, background, font etc. as per your unique business setting.
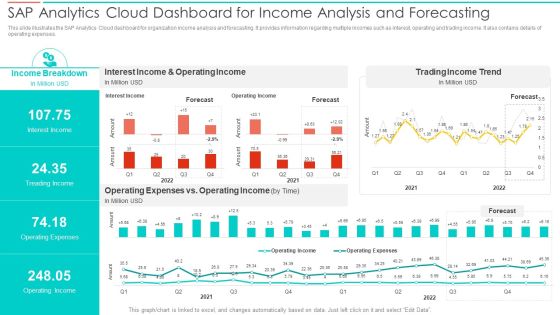
SAC Planning And Implementation SAP Analytics Cloud Dashboard For Income Analysis Summary PDF
This slide illustrates the SAP Analytics Cloud dashboard for organization income analysis and forecasting. It provides information regarding multiple incomes such as interest, operating and trading income. It also contains details of operating expenses. Deliver an awe inspiring pitch with this creative SAC Planning And Implementation SAP Analytics Cloud Dashboard For Income Analysis Summary PDF bundle. Topics like Income Breakdown, Interest Income, Operating Income, Trading Income Trend can be discussed with this completely editable template. It is available for immediate download depending on the needs and requirements of the user.
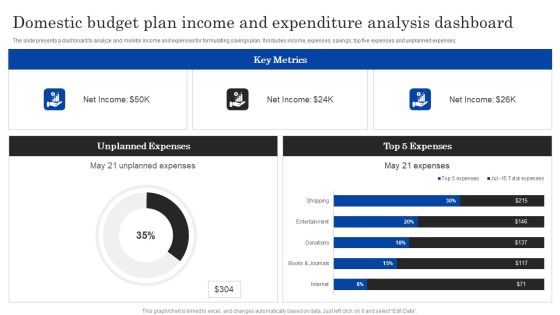
Domestic Budget Plan Income And Expenditure Analysis Dashboard Ppt PowerPoint Presentation Layouts Clipart Images PDF
The slide presents a dashboard to analyze and monitor income and expenses for formulating savings plan. It includes income, expenses, savings, top five expenses and unplanned expenses.Pitch your topic with ease and precision using this Domestic Budget Plan Income And Expenditure Analysis Dashboard Ppt PowerPoint Presentation Layouts Clipart Images PDF. This layout presents information on Unplanned Expenses, Expenses, Key Metrics. It is also available for immediate download and adjustment. So, changes can be made in the color, design, graphics or any other component to create a unique layout.

Deploying AML Transaction Monitoring Dashboard For Monitoring Fraud And Money Rules PDF
This slide showcases dashboard for monitoring fraudulent and money laundering transactions. It provides information about legitimacy, total transaction, unusual transactions, bank, client, investigation, in peer review, etc. Do you have an important presentation coming up Are you looking for something that will make your presentation stand out from the rest Look no further than Deploying AML Transaction Monitoring Dashboard For Monitoring Fraud And Money Rules PDF. With our professional designs, you can trust that your presentation will pop and make delivering it a smooth process. And with Slidegeeks, you can trust that your presentation will be unique and memorable. So why wait Grab Deploying AML Transaction Monitoring Dashboard For Monitoring Fraud And Money Rules PDF today and make your presentation stand out from the rest.

Formulating Money Laundering Dashboard To Monitor Bank Transactions And Activities Clipart PDF
This slide showcases dashboard to review bank transactions and activities. It provides information about credit, check, ATM, debit card, transaction volume, decline rate, visa, maestro, network end points, etc. Do you have an important presentation coming up Are you looking for something that will make your presentation stand out from the rest Look no further than Formulating Money Laundering Dashboard To Monitor Bank Transactions And Activities Clipart PDF. With our professional designs, you can trust that your presentation will pop and make delivering it a smooth process. And with Slidegeeks, you can trust that your presentation will be unique and memorable. So why wait Grab Formulating Money Laundering Dashboard To Monitor Bank Transactions And Activities Clipart PDF today and make your presentation stand out from the rest.

Sap Analytics Cloud Dashboard For Income Analysis And Forecasting Formats PDF
This slide illustrates the SAP Analytics Cloud dashboard for organization income analysis and forecasting. It provides information regarding multiple incomes such as interest, operating and trading income. It also contains details of operating expenses. The best PPT templates are a great way to save time, energy, and resources. Slidegeeks have 100 percent editable powerpoint slides making them incredibly versatile. With these quality presentation templates, you can create a captivating and memorable presentation by combining visually appealing slides and effectively communicating your message. Download Sap Analytics Cloud Dashboard To Asses Digital Marketing Campaigns Performance Ideas PDF from Slidegeeks and deliver a wonderful presentation.
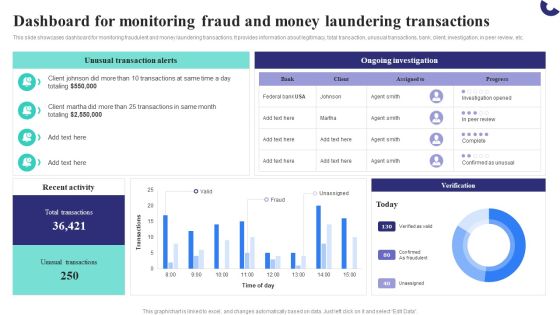
Formulating Money Laundering Dashboard For Monitoring Fraud And Money Laundering Microsoft PDF
This slide showcases dashboard for monitoring fraudulent and money laundering transactions. It provides information about legitimacy, total transaction, unusual transactions, bank, client, investigation, in peer review, etc. Slidegeeks is here to make your presentations a breeze with Formulating Money Laundering Dashboard For Monitoring Fraud And Money Laundering Microsoft PDF With our easy-to-use and customizable templates, you can focus on delivering your ideas rather than worrying about formatting. With a variety of designs to choose from, youre sure to find one that suits your needs. And with animations and unique photos, illustrations, and fonts, you can make your presentation pop. So whether youre giving a sales pitch or presenting to the board, make sure to check out Slidegeeks first.

Brand Personality Improvement To Increase Profits Brand Equity Performance Assessment Dashboard Diagrams PDF
This slide provides information regarding brand equity performance assessment dashboard that highlights customer lifecycle value, customer adoption rate, mentions, engagement, etc. Do you have to make sure that everyone on your team knows about any specific topic I yes, then you should give Brand Personality Improvement To Increase Profits Brand Equity Performance Assessment Dashboard Diagrams PDF a try. Our experts have put a lot of knowledge and effort into creating this impeccable Brand Personality Improvement To Increase Profits Brand Equity Performance Assessment Dashboard Diagrams PDF. You can use this template for your upcoming presentations, as the slides are perfect to represent even the tiniest detail. You can download these templates from the Slidegeeks website and these are easy to edit. So grab these today.
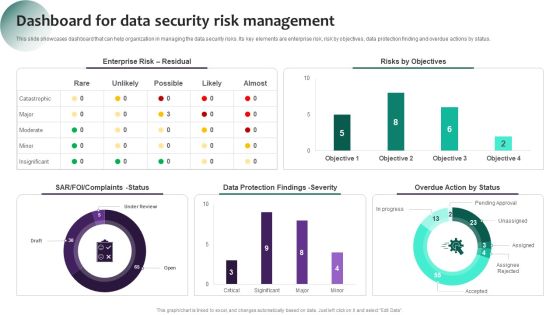
Information Systems Security And Risk Management Plan Dashboard For Data Security Risk Management Information PDF
This slide showcases dashboard that can help organization in managing the data security risks. Its key elements are enterprise risk, risk by objectives, data protection finding and overdue actions by status. If you are looking for a format to display your unique thoughts, then the professionally designed Information Systems Security And Risk Management Plan Dashboard For Data Security Risk Management Information PDF is the one for you. You can use it as a Google Slides template or a PowerPoint template. Incorporate impressive visuals, symbols, images, and other charts. Modify or reorganize the text boxes as you desire. Experiment with shade schemes and font pairings. Alter, share or cooperate with other people on your work. Download Information Systems Security And Risk Management Plan Dashboard For Data Security Risk Management Information PDF and find out how to give a successful presentation. Present a perfect display to your team and make your presentation unforgettable.
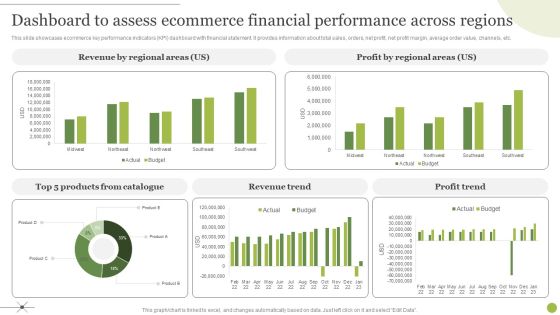
Managing E Commerce Business Accounting Dashboard To Assess Ecommerce Financial Performance Across Regions Graphics PDF
This slide showcases ecommerce key performance indicators KPI dashboard with financial statement. It provides information about total sales, orders, net profit, net profit margin, average order value, channels, etc. Do you have to make sure that everyone on your team knows about any specific topic I yes, then you should give Managing E Commerce Business Accounting Dashboard To Assess Ecommerce Financial Performance Across Regions Graphics PDF a try. Our experts have put a lot of knowledge and effort into creating this impeccable Managing E Commerce Business Accounting Dashboard To Assess Ecommerce Financial Performance Across Regions Graphics PDF. You can use this template for your upcoming presentations, as the slides are perfect to represent even the tiniest detail. You can download these templates from the Slidegeeks website and these are easy to edit. So grab these today.
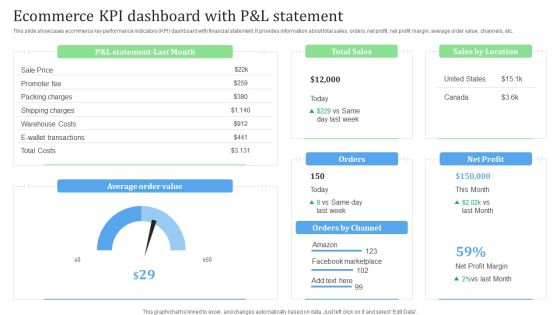
Ecommerce KPI Dashboard With P And L Statement Financial Management Strategies Background PDF
This slide showcases ecommerce key performance indicators KPI dashboard with financial statement. It provides information about total sales, orders, net profit, net profit margin, average order value, channels, etc.Whether you have daily or monthly meetings, a brilliant presentation is necessary. Ecommerce KPI Dashboard With P And L Statement Financial Management Strategies Background PDF can be your best option for delivering a presentation. Represent everything in detail using Ecommerce KPI Dashboard With P And L Statement Financial Management Strategies Background PDF and make yourself stand out in meetings. The template is versatile and follows a structure that will cater to your requirements. All the templates prepared by Slidegeeks are easy to download and edit. Our research experts have taken care of the corporate themes as well. So, give it a try and see the results.
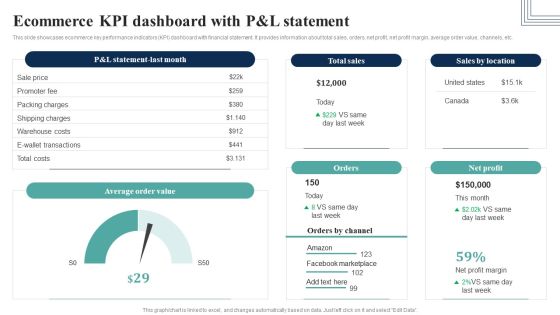
How Electronic Commerce Financial Procedure Can Be Enhanced Ecommerce Kpi Dashboard Slides PDF
This slide showcases ecommerce key performance indicators KPI dashboard with financial statement. It provides information about total sales, orders, net profit, net profit margin, average order value, channels, etc.Create an editable How Electronic Commerce Financial Procedure Can Be Enhanced Ecommerce Kpi Dashboard Slides PDF that communicates your idea and engages your audience. Whether you are presenting a business or an educational presentation, pre-designed presentation templates help save time. How Electronic Commerce Financial Procedure Can Be Enhanced Ecommerce Kpi Dashboard Slides PDF is highly customizable and very easy to edit, covering many different styles from creative to business presentations. Slidegeeks has creative team members who have crafted amazing templates. So, go and get them without any delay.
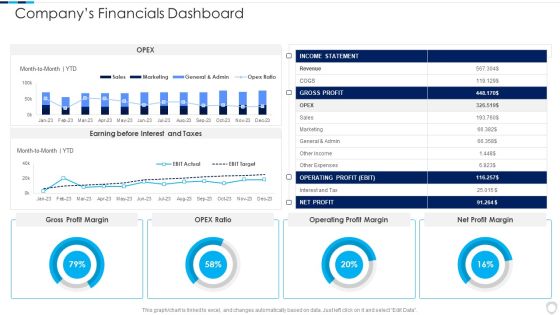
Financial Report Of An IT Firm Companys Financials Dashboard Infographics PDF
Deliver an awe inspiring pitch with this creative Financial Report Of An IT Firm Companys Financials Dashboard Infographics PDF bundle. Topics like Operating Profit, Gross Profit, Income Statement can be discussed with this completely editable template. It is available for immediate download depending on the needs and requirements of the user.

Financial Asset Management System Dashboard Showing Debt And Equity Ratio Graphics PDF
This slide shows the dashboard of financial asset management representing total accounts receivable and payable, equity and debt ratio, profit and loss summary, net working capital etc. Showcasing this set of slides titled Financial Asset Management System Dashboard Showing Debt And Equity Ratio Graphics PDF. The topics addressed in these templates are Financial Asset, Management System, Debt And Equity Ratio. All the content presented in this PPT design is completely editable. Download it and make adjustments in color, background, font etc. as per your unique business setting.

Software Implementation Strategy Digital Marketing Software Key Metrics Dashboard Template PDF
This slide represents the dashboard to track and measure the performance and efficiency of digital marketing software. It includes details related to KPIs such as social media followers, Facebook demographics etc. Crafting an eye catching presentation has never been more straightforward. Let your presentation shine with this tasteful yet straightforward Software Implementation Strategy Digital Marketing Software Key Metrics Dashboard Template PDF template. It offers a minimalistic and classy look that is great for making a statement. The colors have been employed intelligently to add a bit of playfulness while still remaining professional. Construct the idealSoftware Implementation Strategy Digital Marketing Software Key Metrics Dashboard Template PDF that effortlessly grabs the attention of your audience Begin now and be certain to wow your customers.
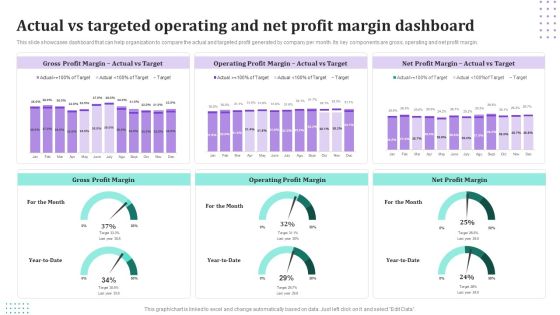
Actual Vs Targeted Operating And Net Profit Margin Dashboard Information PDF
This slide showcases dashboard that can help organization to compare the actual and targeted profit generated by company per month. Its key components are gross, operating and net profit margin. Showcasing this set of slides titled Actual Vs Targeted Operating And Net Profit Margin Dashboard Information PDF. The topics addressed in these templates are Gross Profit Margin, Operating Profit Margin, Net Profit Margin. All the content presented in this PPT design is completely editable. Download it and make adjustments in color, background, font etc. as per your unique business setting.
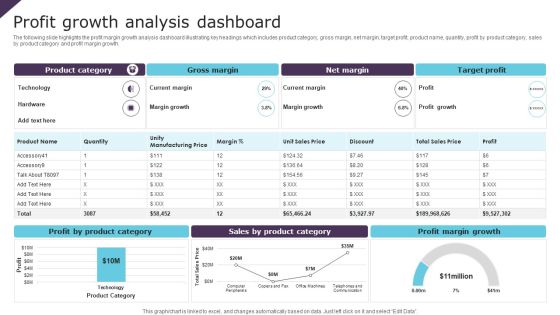
Profit Growth Analysis Dashboard Ppt PowerPoint Presentation File Design Templates PDF
The following slide highlights the profit margin growth analysis dashboard illustrating key headings which includes product category, gross margin, net margin, target profit, product name, quantity, profit by product category, sales by product category and profit margin growth. Showcasing this set of slides titled Profit Growth Analysis Dashboard Ppt PowerPoint Presentation File Design Templates PDF. The topics addressed in these templates are Gross Margin, Net Margin, Target Profit. All the content presented in this PPT design is completely editable. Download it and make adjustments in color, background, font etc. as per your unique business setting.

Financial Kpi Dashboard To Measure Brand Performance Brand Value Estimation Guide Inspiration PDF
Mentioned slide showcases KPI dashboard that can be used to check the financial performance of a brand. Metrics covered in the dashboard are return on assets, working capital ratio, return on equity etc.Are you in need of a template that can accommodate all of your creative concepts This one is crafted professionally and can be altered to fit any style. Use it with Google Slides or PowerPoint. Include striking photographs, symbols, depictions, and other visuals. Fill, move around, or remove text boxes as desired. Test out color palettes and font mixtures. Edit and save your work, or work with colleagues. Download Financial Kpi Dashboard To Measure Brand Performance Brand Value Estimation Guide Inspiration PDF and observe how to make your presentation outstanding. Give an impeccable presentation to your group and make your presentation unforgettable.

Assessing Debt And Equity Fundraising Alternatives For Business Growth Financial Dashboard To Evaluate Internal Designs PDF
This slide showcases dashboard that can help organization to calculate the internal rate of return on invested capital. Company can use it to communicate the return on investment to investors. Create an editable Assessing Debt And Equity Fundraising Alternatives For Business Growth Financial Dashboard To Evaluate Internal Designs PDF that communicates your idea and engages your audience. Whether you are presenting a business or an educational presentation, pre designed presentation templates help save time.Assessing Debt And Equity Fundraising Alternatives For Business Growth Financial Dashboard To Evaluate Internal Designs PDF is highly customizable and very easy to edit, covering many different styles from creative to business presentations. Slidegeeks has creative team members who have crafted amazing templates. So, go and get them without any delay.

Guide To Develop And Estimate Brand Value Financial KPI Dashboard To Measure Brand Performance Formats PDF
Mentioned slide showcases KPI dashboard that can be used to check the financial performance of a brand. Metrics covered in the dashboard are return on assets, working capital ratio, return on equity etc.Coming up with a presentation necessitates that the majority of the effort goes into the content and the message you intend to convey. The visuals of a PowerPoint presentation can only be effective if it supplements and supports the story that is being told. Keeping this in mind our experts created Guide To Develop And Estimate Brand Value Financial KPI Dashboard To Measure Brand Performance Formats PDF to reduce the time that goes into designing the presentation. This way, you can concentrate on the message while our designers take care of providing you with the right template for the situation.
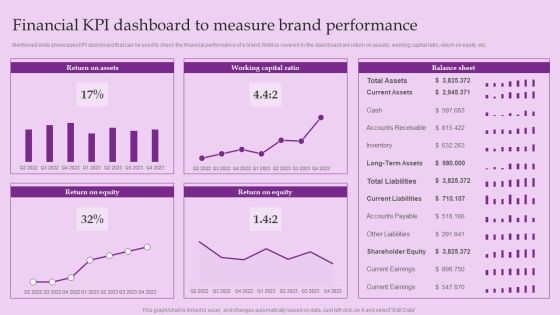
Financial KPI Dashboard To Measure Brand Performance Brand And Equity Evaluation Techniques Elements PDF
Mentioned slide showcases KPI dashboard that can be used to check the financial performance of a brand. Metrics covered in the dashboard are return on assets, working capital ratio, return on equity etc.Coming up with a presentation necessitates that the majority of the effort goes into the content and the message you intend to convey. The visuals of a PowerPoint presentation can only be effective if it supplements and supports the story that is being told. Keeping this in mind our experts created Financial KPI Dashboard To Measure Brand Performance Brand And Equity Evaluation Techniques Elements PDF to reduce the time that goes into designing the presentation. This way, you can concentrate on the message while our designers take care of providing you with the right template for the situation.

Roadmap For Financial Accounting Transformation Sales And Profit Margin Analysis Dashboard Pictures PDF
Deliver an awe inspiring pitch with this creative roadmap for financial accounting transformation sales and profit margin analysis dashboard pictures pdf bundle. Topics like profitability indicator ratios, costs and expenses, expenses breakdown can be discussed with this completely editable template. It is available for immediate download depending on the needs and requirements of the user.

Accounting Ratio Assessment Dashboard With Profit Margin Ppt PowerPoint Presentation Summary Design Ideas PDF
Showcasing this set of slides titled Accounting Ratio Assessment Dashboard With Profit Margin Ppt PowerPoint Presentation Summary Design Ideas PDF. The topics addressed in these templates are Gross Profit, Operating Profit, Interest Tax. All the content presented in this PPT design is completely editable. Download it and make adjustments in color, background, font etc. as per your unique business setting.

Kpi Dashboard To Track Social Media Performance Of Non Profit Business Portrait PDF
This slide shows the KPI dashboard to monitor social media performance of a non profit business. It includes social media platforms such as Facebook, YouTube, LinkedIn, etc. Showcasing this set of slides titled Kpi Dashboard To Track Social Media Performance Of Non Profit Business Portrait PDF. The topics addressed in these templates are Channel Views, Instagram Overview, Favorites. All the content presented in this PPT design is completely editable. Download it and make adjustments in color, background, font etc. as per your unique business setting.
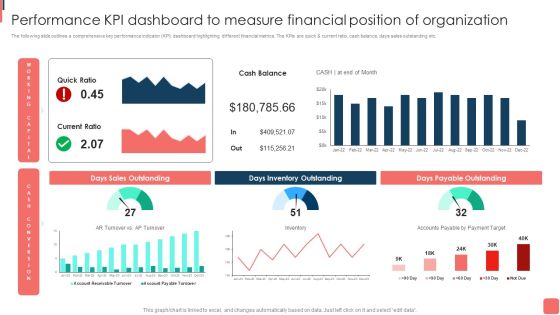
Effective Financial Planning Assessment Techniques Performance Kpi Dashboard To Measure Financial Graphics PDF
The following slide outlines a comprehensive key performance indicator KPI dashboard highlighting different financial metrics. The KPIs are quick and current ratio, cash balance, days sales outstanding etc. The best PPT templates are a great way to save time, energy, and resources. Slidegeeks have 100 precent editable powerpoint slides making them incredibly versatile. With these quality presentation templates, you can create a captivating and memorable presentation by combining visually appealing slides and effectively communicating your message. Download Effective Financial Planning Assessment Techniques Performance Kpi Dashboard To Measure Financial Graphics PDF from Slidegeeks and deliver a wonderful presentation.

KPI Dashboard To Analyze Financial Improvements Effective Planning For Monetary Portrait PDF
This slide showcases the KPIs that would help our business organization to evaluate improvements with the new financial strategy implementation. It includes total income, total expenses, accounts receivable, etc.Find highly impressive KPI Dashboard To Analyze Financial Improvements Effective Planning For Monetary Portrait PDF on Slidegeeks to deliver a meaningful presentation. You can save an ample amount of time using these presentation templates. No need to worry to prepare everything from scratch because Slidegeeks experts have already done a huge research and work for you. You need to download KPI Dashboard To Analyze Financial Improvements Effective Planning For Monetary Portrait PDF for your upcoming presentation. All the presentation templates are 100precent editable and you can change the color and personalize the content accordingly. Download now,

Brand Personality Improvement To Increase Profits Performance Monitoring Dashboard To Track Inspiration PDF
This slide provides information regarding monitoring dashboard to track brand performance through monitoring of session, new users, bounce rate, etc. From laying roadmaps to briefing everything in detail, our templates are perfect for you. You can set the stage with your presentation slides. All you have to do is download these easy to edit and customizable templates. Brand Personality Improvement To Increase Profits Performance Monitoring Dashboard To Track Inspiration PDF will help you deliver an outstanding performance that everyone would remember and praise you for. Do download this presentation today.

Company Risk Assessment Plan Financial Risk Management Key Metrics Dashboard Brochure PDF
This slide covers dashboard to manage and monitor financial risks faced by the enterprise. It includes details related to kpis such as risk heat map, risk rating breakdown, top 5 vulnerabilities etc. Crafting an eye catching presentation has never been more straightforward. Let your presentation shine with this tasteful yet straight forward Company Risk Assessment Plan Financial Risk Management Key Metrics Dashboard Brochure PDF template. It offers a minimalistic and classy look that is great for making a statement. The colors have been employed intelligently to add a bit of playfulness while still remaining professional. Construct the ideal Company Risk Assessment Plan Financial Risk Management Key Metrics Dashboard Brochure PDF that effortlessly grabs the attention of your audience. Begin now and be certain to wow your customers.

Business Dashboard Showing Gross Profit Margin Ppt PowerPoint Presentation Pictures Objects PDF
Presenting this set of slides with name business dashboard showing gross profit margin ppt powerpoint presentation pictures objects pdf. The topics discussed in these slides are gross profit margin, operating profit margin, net profit margin, opex, marketing, income statement. This is a completely editable PowerPoint presentation and is available for immediate download. Download now and impress your audience.
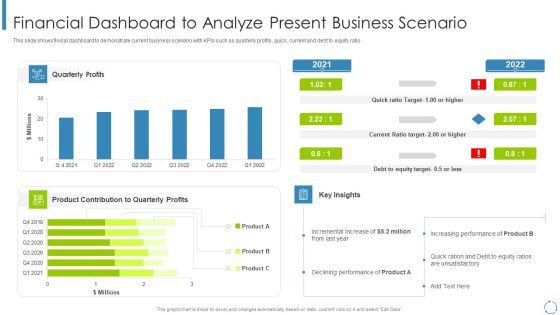
Internal And External Business Environment Analysis Financial Dashboard To Analyze Present Business Scenario Topics PDF
This slide shows finical dashboard to demonstrate current business scenario with KPIs such as quarterly profits, quick, current and debt to equity ratio Deliver and pitch your topic in the best possible manner with this internal and external business environment analysis financial dashboard to analyze present business scenario topics pdf Use them to share invaluable insights on product contribution to quarterly, incremental increase, declining performance and impress your audience. This template can be altered and modified as per your expectations. So, grab it now.

Call Center Metrics And Metrics Dashboard With Tickets Raised Graphics PDF
Mentioned slide outlines a KPI dashboard showcasing the call center performance. The metrics covered in the slide are total dropped calls, waiting calls, total calls, team performance, recurring calls, tickets raised. Showcasing this set of slides titled Call Center Metrics And Metrics Dashboard With Tickets Raised Graphics PDF. The topics addressed in these templates are Call Management Data, Monthly Statics, Performance Records. All the content presented in this PPT design is completely editable. Download it and make adjustments in color, background, font etc. as per your unique business setting.

Improving Technology Based Recruitment Dashboard For Managing Human Capital Summary PDF
This slide showcases dashboard for which can help recruiters in managing human capital. It provides details about cost visibility, compensation, contingent worker, retention risk, diversity scorecard, female, disabled, millennial, etc. The Improving Technology Based Recruitment Dashboard For Managing Human Capital Summary PDF is a compilation of the most recent design trends as a series of slides. It is suitable for any subject or industry presentation, containing attractive visuals and photo spots for businesses to clearly express their messages. This template contains a variety of slides for the user to input data, such as structures to contrast two elements, bullet points, and slides for written information. Slidegeeks is prepared to create an impression.
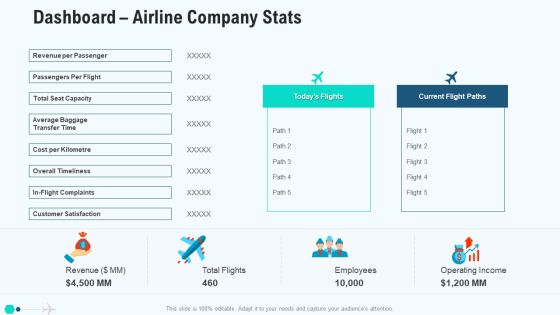
Profit Decrease In Commercial Airline Firm Case Study Solution Dashboard Airline Company Stats Infographics PDF
Deliver an awe inspiring pitch with this creative profit decrease in commercial airline firm case study solution dashboard airline company stats infographics pdf bundle. Topics like employees, operating income, customer satisfaction can be discussed with this completely editable template. It is available for immediate download depending on the needs and requirements of the user.

ATS Administration To Improve Asset Management Dashboard To Track System Guidelines PDF
This slide covers KPI dashboard to track system performance. It involves detail such as total number of assets, value of assets and purchases in fiscal year. Get a simple yet stunning designed ATS Administration To Improve Asset Management Dashboard To Track System Guidelines PDF. It is the best one to establish the tone in your meetings. It is an excellent way to make your presentations highly effective. So, download this PPT today from Slidegeeks and see the positive impacts. Our easy-to-edit ATS Administration To Improve Asset Management Dashboard To Track System Guidelines PDF can be your go-to option for all upcoming conferences and meetings. So, what are you waiting for Grab this template today.

Real Estate Business Monthly Sales Forecast Dashboard Ppt Layouts Grid PDF
This slide represents the dashboard showing the data related to sales forecasting for the real estate business. It shows details related to the set target, sales targets won, open and forecasted and also shows the graph representing the sales pipeline for the year. Showcasing this set of slides titled Real Estate Business Monthly Sales Forecast Dashboard Ppt Layouts Grid PDF. The topics addressed in these templates are Next Billing Data, Pipeline, Current Fiscal Year. All the content presented in this PPT design is completely editable. Download it and make adjustments in color, background, font etc. as per your unique business setting.

Analyzing And Deploying Effective CMS Customer Checkout Behavior KPI Dashboard Elements PDF
This slide represents the dashboard to help management in analyzing the point at which customers leave the checkout process. It includes details related to KPIs such as shipping drop off, payment drop off etc. If you are looking for a format to display your unique thoughts, then the professionally designed Analyzing And Deploying Effective CMS Customer Checkout Behavior KPI Dashboard Elements PDF is the one for you. You can use it as a Google Slides template or a PowerPoint template. Incorporate impressive visuals, symbols, images, and other charts. Modify or reorganize the text boxes as you desire. Experiment with shade schemes and font pairings. Alter, share or cooperate with other people on your work. Download Analyzing And Deploying Effective CMS Customer Checkout Behavior KPI Dashboard Elements PDF and find out how to give a successful presentation. Present a perfect display to your team and make your presentation unforgettable.

Multiple Point Of Sale System Dashboard Depicting Restaurants Daily Performance Mockup PDF
This Slide represents point of sale system dashboard depicting restaurants daily performance which can be beneficial for eateries to manage their regular sales. It includes information about sales, expenditure, menu, customer data, bookings and reports. Persuade your audience using this Multiple Point Of Sale System Dashboard Depicting Restaurants Daily Performance Mockup PDF. This PPT design covers four stages, thus making it a great tool to use. It also caters to a variety of topics including Expenditure, Sales, Customer Data. Download this PPT design now to present a convincing pitch that not only emphasizes the topic but also showcases your presentation skills.
 Home
Home