Revenue Dashboard

Sales Performance Dashboard With Weekly Revenue Ppt PowerPoint Presentation File Pictures PDF
Showcasing this set of slides titled sales performance dashboard with weekly revenue ppt powerpoint presentation file pictures pdf. The topics addressed in these templates are sales, performance, revenue. All the content presented in this PPT design is completely editable. Download it and make adjustments in color, background, font etc. as per your unique business setting.

Substructure Segment Analysis Infrastructure KPI Dashboard Showing Project Revenue Summary PDF
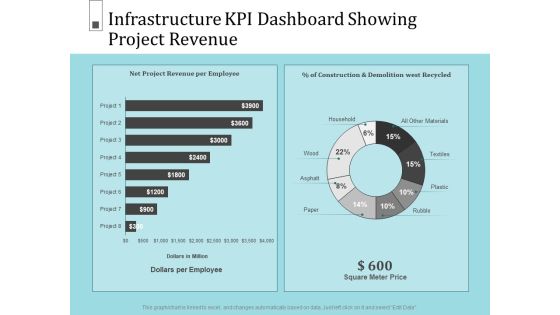
Deliver and pitch your topic in the best possible manner with this substructure segment analysis infrastructure kpi dashboard showing project revenue summary pdf. Use them to share invaluable insights on square meter price, dollars per employee, net project revenue per employee and impress your audience. This template can be altered and modified as per your expectations. So, grab it now.
Infrastructure Project Management In Construction Infrastructure KPI Dashboard Showing Project Revenue Portrait PDF
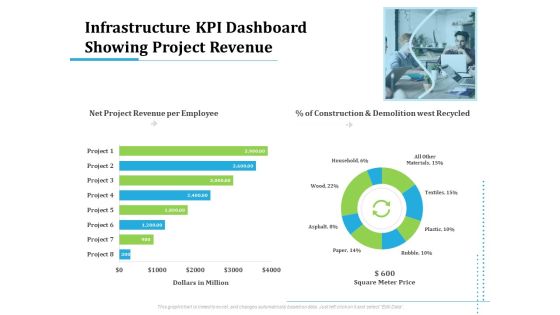
Deliver an awe inspiring pitch with this creativeinfrastructure project management in construction infrastructure kpi dashboard showing project revenue portrait pdf. bundle. Topics like net project revenue per employee, construction and demolition west recycled, project can be discussed with this completely editable template. It is available for immediate download depending on the needs and requirements of the user.
Information Technology Functions Management Infrastructure KPI Dashboard Showing Project Revenue Ppt Show Information PDF
Deliver an awe-inspiring pitch with this creative information technology functions management infrastructure kpi dashboard showing project revenue ppt show information pdf bundle. Topics like net project revenue per employee, construction and demolition west recycled, dollars million, square meter price, project can be discussed with this completely editable template. It is available for immediate download depending on the needs and requirements of the user.

Utilizing Infrastructure Management Using Latest Methods Infrastructure KPI Dashboard Showing Project Revenue Background PDF
Deliver an awe-inspiring pitch with this creative utilizing infrastructure management using latest methods infrastructure kpi dashboard showing project revenue background pdf bundle. Topics like net project revenue per employee, construction and demolition west recycled, dollars million, square meter price, project can be discussed with this completely editable template. It is available for immediate download depending on the needs and requirements of the user.
Retail KPI Dashboard Showing Sales Revenue Customers And Out Of Stock Items Introduction PDF
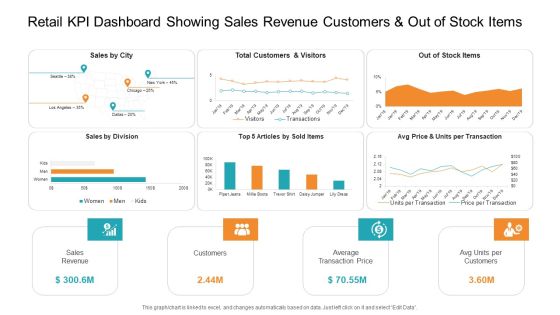
Deliver an awe-inspiring pitch with this creative retail KPI dashboard showing sales revenue customers and out of stock items introduction pdf. bundle. Topics like sales revenue, average transaction price, sales by division can be discussed with this completely editable template. It is available for immediate download depending on the needs and requirements of the user.
Retail KPI Dashboard Showing Sales Revenue Customers And Out Of Stock Items Guidelines PDF
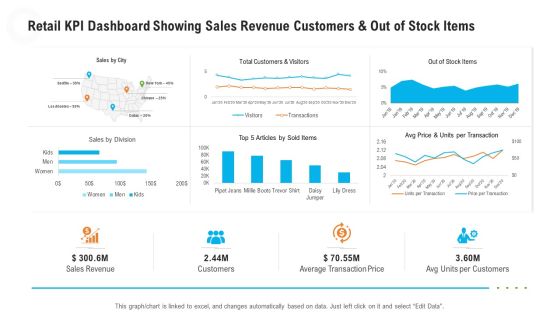
Deliver an awe-inspiring pitch with this creative retail KPI dashboard showing sales revenue customers and out of stock items guidelines pdf. bundle. Topics like sales revenue, average transaction price can be discussed with this completely editable template. It is available for immediate download depending on the needs and requirements of the user.

Civil Infrastructure Designing Services Management Infrastructure Kpi Dashboard Showing Project Revenue Topics PDF
Deliver an awe inspiring pitch with this creative civil infrastructure designing services management infrastructure kpi dashboard showing project revenue topics pdf bundle. Topics like revenue, employee, materials can be discussed with this completely editable template. It is available for immediate download depending on the needs and requirements of the user.

Construction Management Services And Action Plan Infrastructure KPI Dashboard Showing Project Revenue Graphics PDF
Deliver an awe inspiring pitch with this creative construction management services and action plan infrastructure kpi dashboard showing project revenue graphics pdf bundle. Topics like construction and demolition west recycled, net project revenue per employee can be discussed with this completely editable template. It is available for immediate download depending on the needs and requirements of the user.
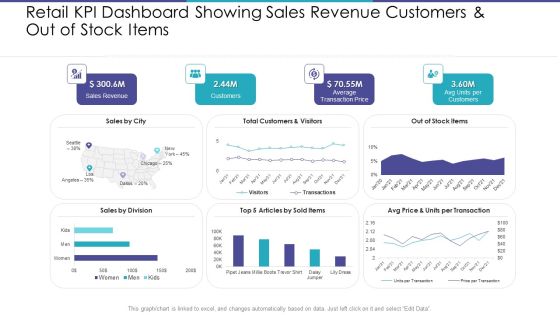
Retail KPI Dashboard Showing Sales Revenue Customers And Out Of Stock Items Elements PDF
Deliver an awe-inspiring pitch with this creative retail kpi dashboard showing sales revenue customers and out of stock items elements pdf. bundle. Topics like sales revenue, average transaction price, avg units per customers can be discussed with this completely editable template. It is available for immediate download depending on the needs and requirements of the user.

Infrastructure Building Administration Infrastructure KPI Dashboard Showing Project Revenue Clipart PDF
Deliver an awe inspiring pitch with this creative infrastructure building administration infrastructure kpi dashboard showing project revenue clipart pdf bundle. Topics like square meter price, net project revenue per employee, dollars per employee can be discussed with this completely editable template. It is available for immediate download depending on the needs and requirements of the user.

Customer Business Service Delivery Framework Dashboard With Total Revenue Structure PDF
Pitch your topic with ease and precision using this Customer Business Service Delivery Framework Dashboard With Total Revenue Structure PDF. This layout presents information on Requests Answered, Total Requests, Total Revenue. It is also available for immediate download and adjustment. So, changes can be made in the color, design, graphics or any other component to create a unique layout.

International Business Extension Dashboard To Track Revenue After Global Expansion Introduction PDF
This slide showcase dashboard that can help organization track revenue after global expansion. Its key components are average revenue per customer, customer acquisition cost, customer lifetime value and new customers acquired. Crafting an eye-catching presentation has never been more straightforward. Let your presentation shine with this tasteful yet straightforward International Business Extension Dashboard To Track Revenue After Global Expansion Introduction PDF template. It offers a minimalistic and classy look that is great for making a statement. The colors have been employed intelligently to add a bit of playfulness while still remaining professional. Construct the ideal International Business Extension Dashboard To Track Revenue After Global Expansion Introduction PDF that effortlessly grabs the attention of your audience Begin now and be certain to wow your customers.

Assessing International Market Dashboard To Track Revenue After Global Expansion Template PDF
This slide showcase dashboard that can help organization track revenue after global expansion. Its key components are average revenue per customer, customer acquisition cost, customer lifetime value and new customers acquired. Crafting an eye-catching presentation has never been more straightforward. Let your presentation shine with this tasteful yet straightforward Assessing International Market Dashboard To Track Revenue After Global Expansion Template PDF template. It offers a minimalistic and classy look that is great for making a statement. The colors have been employed intelligently to add a bit of playfulness while still remaining professional. Construct the ideal Assessing International Market Dashboard To Track Revenue After Global Expansion Template PDF that effortlessly grabs the attention of your audience Begin now and be certain to wow your customers.

Expansion Strategic Plan Dashboard To Track Revenue After Global Expansion Rules PDF
This slide showcase dashboard that can help organization track revenue after global expansion. Its key components are average revenue per customer, customer acquisition cost, customer lifetime value and new customers acquired. Create an editable Expansion Strategic Plan Dashboard To Track Revenue After Global Expansion Rules PDF that communicates your idea and engages your audience. Whether youre presenting a business or an educational presentation, pre-designed presentation templates help save time. Expansion Strategic Plan Dashboard To Track Revenue After Global Expansion Rules PDF is highly customizable and very easy to edit, covering many different styles from creative to business presentations. Slidegeeks has creative team members who have crafted amazing templates. So, go and get them without any delay.
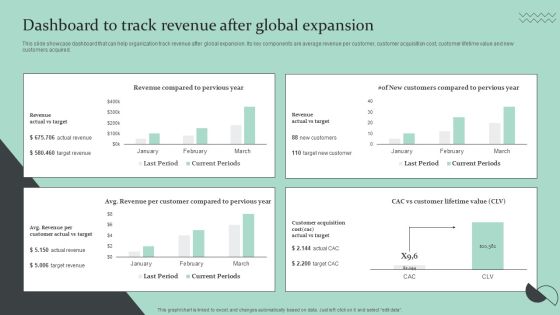
Strategic Global Expansion Business Plan Dashboard To Track Revenue After Global Expansion Topics PDF
This slide showcase dashboard that can help organization track revenue after global expansion. Its key components are average revenue per customer, customer acquisition cost, customer lifetime value and new customers acquired. Here you can discover an assortment of the finest PowerPoint and Google Slides templates. With these templates, you can create presentations for a variety of purposes while simultaneously providing your audience with an eye catching visual experience. Download Strategic Global Expansion Business Plan Dashboard To Track Revenue After Global Expansion Topics PDF to deliver an impeccable presentation. These templates will make your job of preparing presentations much quicker, yet still, maintain a high level of quality. Slidegeeks has experienced researchers who prepare these templates and write high quality content for you. Later on, you can personalize the content by editing the Strategic Global Expansion Business Plan Dashboard To Track Revenue After Global Expansion Topics PDF.

Business Dashboard Showing Total Revenue Ppt PowerPoint Presentation Visual Aids Icon PDF
Presenting this set of slides with name business dashboard showing total revenue ppt powerpoint presentation visual aids icon pdf. The topics discussed in these slides are total revenue, 22 product types share in total revenue, 6 product lines product types revenue share within product line, profit and quatity running total, product line color key. This is a completely editable PowerPoint presentation and is available for immediate download. Download now and impress your audience.

Dashboard To Track Revenue After Global Expansion Ppt PowerPoint Presentation File Example PDF
This slide showcase dashboard that can help organization track revenue after global expansion. Its key components are average revenue per customer, customer acquisition cost, customer lifetime value and new customers acquired.Take your projects to the next level with our ultimate collection of Dashboard To Track Revenue After Global Expansion Ppt PowerPoint Presentation File Example PDF. Slidegeeks has designed a range of layouts that are perfect for representing task or activity duration, keeping track of all your deadlines at a glance. Tailor these designs to your exact needs and give them a truly corporate look with your own brand colors they all make your projects stand out from the rest.

Estimating Business Overall Kpi Metrics Dashboard Highlighting Organization Revenue Clipart PDF
The following slide outlines key performance indicator KPI dashboard showcasing various financial metrics of the organization. The key metrics are gross revenue, product revenue, service revenue, gross profit, net profit etc. Formulating a presentation can take up a lot of effort and time, so the content and message should always be the primary focus. The visuals of the PowerPoint can enhance the presenters message, so our Estimating Business Overall Kpi Metrics Dashboard Highlighting Organization Revenue Clipart PDF was created to help save time. Instead of worrying about the design, the presenter can concentrate on the message while our designers work on creating the ideal templates for whatever situation is needed. Slidegeeks has experts for everything from amazing designs to valuable content, we have put everything into Estimating Business Overall Kpi Metrics Dashboard Highlighting Organization Revenue Clipart PDF.

IT And Cloud Facilities Management Infrastructure KPI Dashboard Showing Project Revenue Clipart PDF
Deliver an awe-inspiring pitch with this creative it and cloud facilities management infrastructure kpi dashboard showing project revenue clipart pdf bundle. Topics like days per project, project financial, resource allocation, delivery timeline and resources, project can be discussed with this completely editable template. It is available for immediate download depending on the needs and requirements of the user.
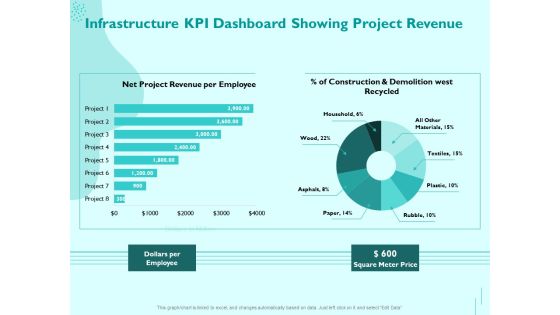
Managing IT Operating System Infrastructure KPI Dashboard Showing Project Revenue Diagrams PDF
Presenting this set of slides with name managing it operating system infrastructure kpi dashboard showing project revenue diagrams pdf. The topics discussed in these slides are dollars per employee, square meter price. This is a completely editable PowerPoint presentation and is available for immediate download. Download now and impress your audience.
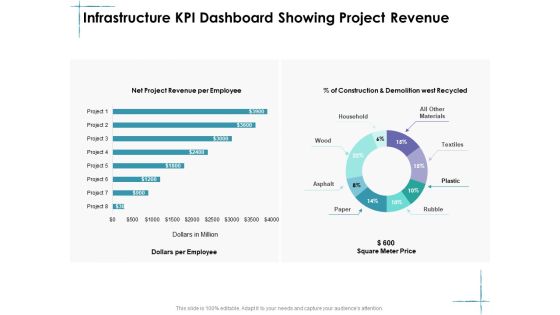
Facility Management Infrastructure KPI Dashboard Showing Project Revenue Ppt Slides Example File PDF
Deliver and pitch your topic in the best possible manner with this facility management infrastructure kpi dashboard showing project revenue ppt slides example file pdf. Use them to share invaluable insights on household, textiles, plastic, rubble, paper, asphalt and impress your audience. This template can be altered and modified as per your expectations. So, grab it now.

Infrastructure Strategies Infrastructure KPI Dashboard Showing Project Revenue Ppt Styles Show PDF
Deliver and pitch your topic in the best possible manner with this infrastructure strategies infrastructure kpi dashboard showing project revenue ppt styles show pdf. Use them to share invaluable insights on household, textiles, plastic, rubble, paper, asphalt and impress your audience. This template can be altered and modified as per your expectations. So, grab it now.
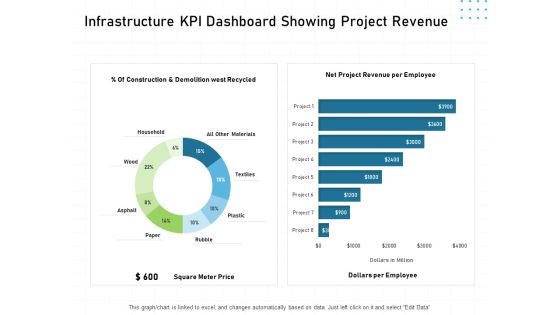
IT Infrastructure Administration Infrastructure KPI Dashboard Showing Project Revenue Ppt Summary Grid PDF
Deliver and pitch your topic in the best possible manner with this it infrastructure administration infrastructure kpi dashboard showing project revenue ppt summary grid pdf. Use them to share invaluable insights on household, textiles, plastic, rubble, paper, asphalt and impress your audience. This template can be altered and modified as per your expectations. So, grab it now.

Improving Operational Activities Enterprise Infrastructure Kpi Dashboard Showing Project Revenue Professional PDF
Deliver an awe inspiring pitch with this creative improving operational activities enterprise infrastructure kpi dashboard showing project revenue professional pdf bundle. Topics like square meter price, dollars per employee can be discussed with this completely editable template. It is available for immediate download depending on the needs and requirements of the user.

Construction Engineering And Industrial Facility Management Infrastructure KPI Dashboard Showing Project Revenue Formats PDF
Deliver and pitch your topic in the best possible manner with this construction engineering and industrial facility management infrastructure kpi dashboard showing project revenue formats pdf. Use them to share invaluable insights on all other materials, 15percent, household, asphalt and impress your audience. This template can be altered and modified as per your expectations. So, grab it now.
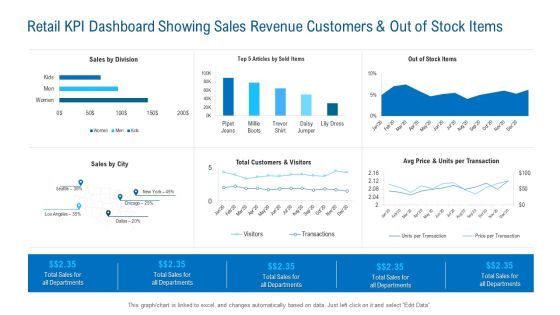
Retail KPI Dashboard Showing Sales Revenue Customers And Out Of Stock Items Rules PDF
Deliver an awe inspiring pitch with this creative retail kpi dashboard showing sales revenue customers and out of stock items rules pdf bundle. Topics like sales by division, sales by city, customers and visitors can be discussed with this completely editable template. It is available for immediate download depending on the needs and requirements of the user.
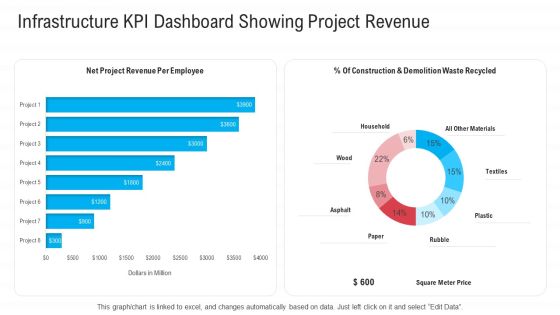
Infrastructure Designing And Administration Infrastructure KPI Dashboard Showing Project Revenue Professional PDF
Deliver and pitch your topic in the best possible manner with this infrastructure designing and administration infrastructure kpi dashboard showing project revenue professional pdf. Use them to share invaluable insights on household, textiles, plastic, rubble, paper, asphalt and impress your audience. This template can be altered and modified as per your expectations. So, grab it now.
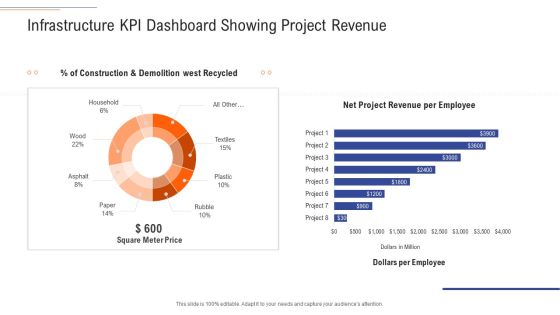
Support Services Management Infrastructure KPI Dashboard Showing Project Revenue Topics PDF
Deliver and pitch your topic in the best possible manner with this support services management infrastructure kpi dashboard showing project revenue topics pdf. Use them to share invaluable insights on household, textiles, plastic, rubble, paper, asphalt and impress your audience. This template can be altered and modified as per your expectations. So, grab it now.

KPI Metrics Dashboard Highlighting Organization Revenue Profitability And Liquidity Formats PDF
The following slide outlines key performance indicator KPI dashboard showcasing various financial metrics of the organization. The key metrics are gross revenue, product revenue, service revenue, gross profit, net profit etc. From laying roadmaps to briefing everything in detail, our templates are perfect for you. You can set the stage with your presentation slides. All you have to do is download these easy to edit and customizable templates. KPI Metrics Dashboard Highlighting Organization Revenue Profitability And Liquidity Formats PDF will help you deliver an outstanding performance that everyone would remember and praise you for. Do download this presentation today.
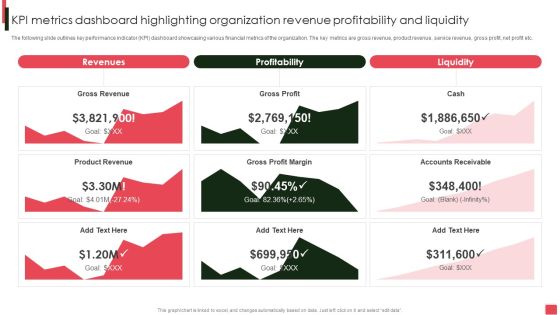
Overview Of Organizational Kpi Metrics Dashboard Highlighting Organization Revenue Brochure PDF
The following slide outlines key performance indicator KPI dashboard showcasing various financial metrics of the organization. The key metrics are gross revenue, product revenue, service revenue, gross profit, net profit etc. If your project calls for a presentation, then Slidegeeks is your go-to partner because we have professionally designed, easy-to-edit templates that are perfect for any presentation. After downloading, you can easily edit Overview Of Organizational Kpi Metrics Dashboard Highlighting Organization Revenue Brochure PDF and make the changes accordingly. You can rearrange slides or fill them with different images. Check out all the handy templates.
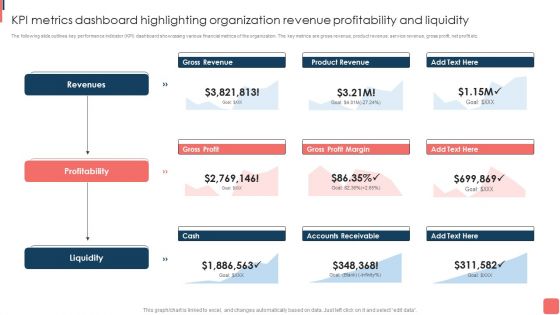
KPI Metrics Dashboard Highlighting Organization Revenue Profitability And Liquidity Template PDF
The following slide outlines key performance indicator KPI dashboard showcasing various financial metrics of the organization. The key metrics are gross revenue, product revenue, service revenue, gross profit, net profit etc. This KPI Metrics Dashboard Highlighting Organization Revenue Profitability And Liquidity Template PDF from Slidegeeks makes it easy to present information on your topic with precision. It provides customization options, so you can make changes to the colors, design, graphics, or any other component to create a unique layout. It is also available for immediate download, so you can begin using it right away. Slidegeeks has done good research to ensure that you have everything you need to make your presentation stand out. Make a name out there for a brilliant performance.

Retail Kpi Dashboard Showing Revenue Vs Units Sold Top 5 Product Categories Ppt PowerPoint Presentation Layouts Designs Download
This is a retail kpi dashboard showing revenue vs units sold top 5 product categories ppt powerpoint presentation layouts designs download. This is a four stage process. The stages in this process are finance, strategy, analysis, marketing.
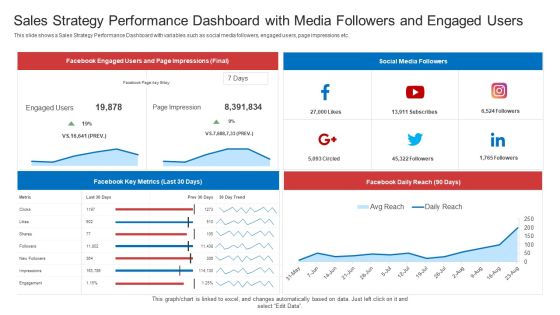
Strategic Plan To Increase Sales Volume And Revenue Sales Strategy Performance Dashboard With Media Followers And Engaged Users Topics PDF
This slide shows a Sales Strategy Performance Dashboard with variables such as social media followers, engaged users, page impressions etc. Deliver an awe inspiring pitch with this creative strategic plan to increase sales volume and revenue sales strategy performance dashboard with media followers and engaged users topics pdf bundle. Topics like facebook daily reach, facebook key metrics, facebook engaged users and page impressions, social media followers can be discussed with this completely editable template. It is available for immediate download depending on the needs and requirements of the user.
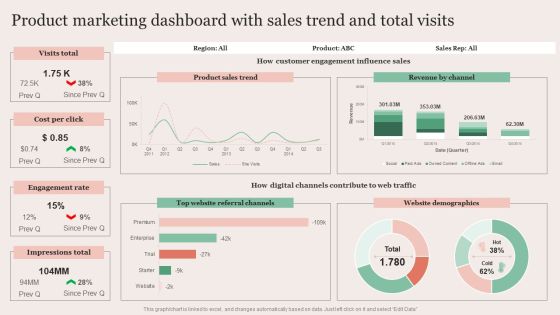
Strategic Brand Promotion For Enhanced Recognition And Revenue Growth Product Marketing Dashboard With Sales Trend Microsoft PDF
Boost your pitch with our creative Strategic Brand Promotion For Enhanced Recognition And Revenue Growth Product Marketing Dashboard With Sales Trend Microsoft PDF. Deliver an awe-inspiring pitch that will mesmerize everyone. Using these presentation templates you will surely catch everyones attention. You can browse the ppts collection on our website. We have researchers who are experts at creating the right content for the templates. So you do not have to invest time in any additional work. Just grab the template now and use them.

Content And Permission Marketing Tactics For Enhancing Business Revenues Social Media Marketing Dashboard Download PDF
The following slide displays key metrics that can help the organization to measure effectiveness of social media marketing strategy, these can be growth in engagement, audience growth etc.. Present like a pro with Content And Permission Marketing Tactics For Enhancing Business Revenues Social Media Marketing Dashboard Download PDF Create beautiful presentations together with your team, using our easy-to-use presentation slides. Share your ideas in real-time and make changes on the fly by downloading our templates. So whether you are in the office, on the go, or in a remote location, you can stay in sync with your team and present your ideas with confidence. With Slidegeeks presentation got a whole lot easier. Grab these presentations today.

Crm Dashboard Actual Vs Target Revenue Ppt PowerPoint Presentation Professional Tips
This is a crm dashboard actual vs target revenue ppt powerpoint presentation professional tips. This is a three stage process. The stages in this process are actual, target.

Crm Dashboard Actual Vs Target Revenue Ppt PowerPoint Presentation Outline Example File
This is a crm dashboard actual vs target revenue ppt powerpoint presentation outline example file. This is a three stage process. The stages in this process are actual, target.

Controlling Customer Retention Dashboard Customer Purchase Tracking Revenue Ppt Pictures Guide PDF
The firm will track down the customers activities in terms of revenues generated. Customers are bifurcated in segments such as existing, new, lost and active. Deliver an awe inspiring pitch with this creative controlling customer retention dashboard customer purchase tracking revenue ppt pictures guide pdf bundle. Topics like dashboard customer purchase tracking can be discussed with this completely editable template. It is available for immediate download depending on the needs and requirements of the user.

Digital Marketing Dashboard With Conversions And Revenue Growth Rate Ppt Outline Elements PDF
Deliver and pitch your topic in the best possible manner with this digital marketing dashboard with conversions and revenue growth rate ppt outline elements pdf. Use them to share invaluable insights on revenue, cost, growth, value and impress your audience. This template can be altered and modified as per your expectations. So, grab it now.

Dashboard To Track Sales Revenue Growth And New Customer Acquisition Guidelines PDF
Showcasing this set of slides titled Dashboard To Track Sales Revenue Growth And New Customer Acquisition Guidelines PDF. The topics addressed in these templates are New Customer, Sales Revenue, Congrats Target. All the content presented in this PPT design is completely editable. Download it and make adjustments in color, background, font etc. as per your unique business setting.
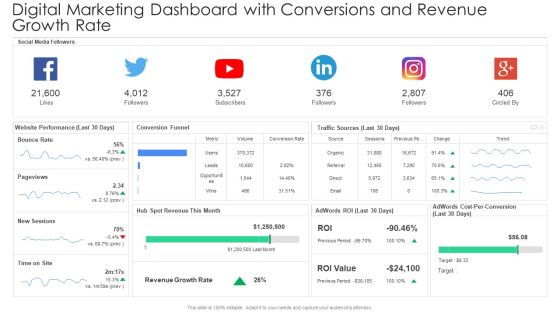
Digital Marketing Dashboard With Conversions And Revenue Growth Rate Template PDF
Deliver and pitch your topic in the best possible manner with this digital marketing dashboard with conversions and revenue growth rate template pdf. Use them to share invaluable insights on bounce rate, pageviews, new sessions and impress your audience. This template can be altered and modified as per your expectations. So, grab it now.

Effective Company Event Communication Tactics Dashboard For Tracking Event Revenue And Registrations Graphics PDF
This slide covers metrics for analyzing the event revenue and registrations. It includes KPIs such as gross revenue, gross revenue from promos, total refund, total registration, visits to purchase conversion, check-in- status, etc. Deliver and pitch your topic in the best possible manner with this Effective Company Event Communication Tactics Dashboard For Tracking Event Revenue And Registrations Graphics PDF. Use them to share invaluable insights on Gross Revenue, Registration Analysis, Purchase Conversion and impress your audience. This template can be altered and modified as per your expectations. So, grab it now.
Sales Funnel Management For Revenue Generation Tracking Customer Sales Funnel Dashboard Information PDF
This slide covers information regarding the customer sales funnel tracking with sales volume and total market. Deliver an awe inspiring pitch with this creative sales funnel management for revenue generation tracking customer sales funnel dashboard information pdf bundle. Topics like tracking customer sales funnel dashboard can be discussed with this completely editable template. It is available for immediate download depending on the needs and requirements of the user.
Planning Transnational Technique To Improve International Scope Dashboard Tracking Post Expansion Revenue Structure PDF
This slide covers the dashboard for analyzing fast food business sales by location. It includes KPIs such as the companys revenue by location, by type, top 5 expenses by account, top 5 expenses by department, cost of revenue year to date, etc. If your project calls for a presentation, then Slidegeeks is your go to partner because we have professionally designed, easy to edit templates that are perfect for any presentation. After downloading, you can easily edit Planning Transnational Technique To Improve International Scope Dashboard Tracking Post Expansion Revenue Structure PDF and make the changes accordingly. You can rearrange slides or fill them with different images. Check out all the handy templates

Company Event Communication Dashboard For Tracking Event Revenue And Registrations Ideas PDF
This slide covers metrics for analyzing the event revenue and registrations. It includes KPIs such as gross revenue, gross revenue from promos, total refund, total registration, visits to purchase conversion, check-in- status, etc. There are so many reasons you need a Company Event Communication Dashboard For Tracking Event Revenue And Registrations Ideas PDF. The first reason is you can not spend time making everything from scratch, Thus, Slidegeeks has made presentation templates for you too. You can easily download these templates from our website easily.

CRM Implementation Dashboard With Sales Pipeline And Revenue By Products Mockup PDF
The following slide showcases the CRM dashboard which includes leads, deals, sales revenue, revenue by products, total leads by source, total leads by status and lead distribution.Deliver an awe inspiring pitch with this creative CRM Implementation Dashboard With Sales Pipeline And Revenue By Products Mockup PDF bundle. Topics like Lead Distribution, Revenue By Products, Total Leads can be discussed with this completely editable template. It is available for immediate download depending on the needs and requirements of the user.

Brand Revenue Comparative Analysis With Net Promoter Score Dashboard Mockup PDF
This slide illustrates graphical representation of revenue of three brands. It includes weekly revenue line graphs and net promoter score by age of customers.Pitch your topic with ease and precision using this Brand Revenue Comparative Analysis With Net Promoter Score Dashboard Mockup PDF. This layout presents information on Brand Revenue Comparative Analysis With Net Promoter Score Dashboard. It is also available for immediate download and adjustment. So, changes can be made in the color, design, graphics or any other component to create a unique layout.
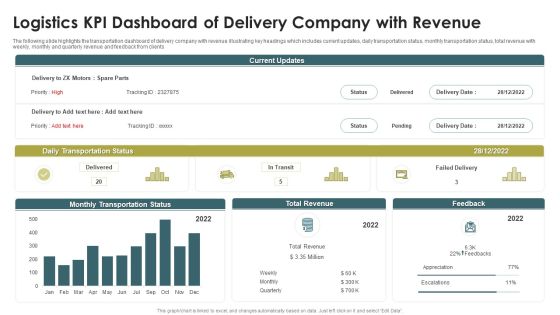
Logistics KPI Dashboard Of Delivery Company With Revenue Ppt Show PDF
The following slide highlights the transportation dashboard of delivery company with revenue illustrating key headings which includes current updates, daily transportation status, monthly transportation status, total revenue with weekly, monthly and quarterly revenue and feedback from clients. Showcasing this set of slides titled Logistics KPI Dashboard Of Delivery Company With Revenue Ppt Show PDF. The topics addressed in these templates are Daily Transportation Status, Monthly Transportation Status, Total Revenue. All the content presented in this PPT design is completely editable. Download it and make adjustments in color, background, font etc. as per your unique business setting.
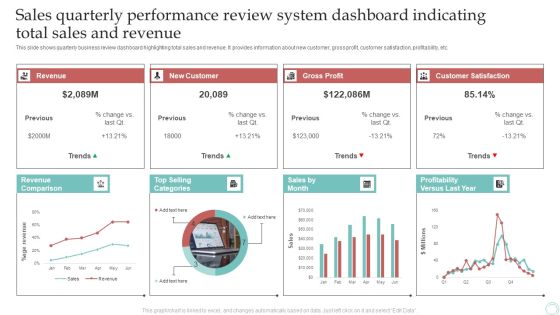
Sales Quarterly Performance Review System Dashboard Indicating Total Sales And Revenue Download PDF
This slide shows quarterly business review dashboard highlighting total sales and revenue. It provides information about new customer, gross profit, customer satisfaction, profitability, etc. Pitch your topic with ease and precision using this Sales Quarterly Performance Review System Dashboard Indicating Total Sales And Revenue Download PDF. This layout presents information on Revenue, New Customer, Gross Profit. It is also available for immediate download and adjustment. So, changes can be made in the color, design, graphics or any other component to create a unique layout.

Best Practices Increase Revenue Out Indirect Channel Sales Plan Financials Dashboard Topics PDF
Deliver an awe inspiring pitch with this creative best practices increase revenue out indirect channel sales plan financials dashboard topics pdf bundle. Topics like distribution, sales, representative, locations, revenue can be discussed with this completely editable template. It is available for immediate download depending on the needs and requirements of the user.
Enhancing Financial Institution Operations Dashboard Tracking Customer Activities And Revenue Generated Microsoft PDF
Deliver and pitch your topic in the best possible manner with this enhancing financial institution operations dashboard tracking customer activities and revenue generated microsoft pdf. Use them to share invaluable insights on target, revenue, value, achievement and impress your audience. This template can be altered and modified as per your expectations. So, grab it now.
Modifying Banking Functionalities Dashboard Tracking Customer Activities And Revenue Generated Portrait PDF
This slide contains dashboard that will allow bank to track the customer activities in terms of new customer acquired, customer acquisition cost and overall revenue generated. Deliver and pitch your topic in the best possible manner with this enhancing financial institution operations dashboard tracking customer activities and revenue generated microsoft pdf. Use them to share invaluable insights on target, revenue, value, achievement and impress your audience. This template can be altered and modified as per your expectations. So, grab it now.
Effective Company Event Communication Plan Dashboard For Tracking Event Gross Revenue Portrait PDF
This slide covers metrics for analyzing gross revenue generated throughout the event. It includes a graphical and tabular representation of revenue generated via promo codes and tracking links. Deliver an awe inspiring pitch with this creative Effective Company Event Communication Plan Dashboard For Tracking Event Gross Revenue Portrait PDF bundle. Topics like Gross Revenue, Promo Codes, Tracking Links can be discussed with this completely editable template. It is available for immediate download depending on the needs and requirements of the user.
Effective Company Event Communication Tactics Dashboard For Tracking Event Gross Revenue Introduction PDF
This slide covers metrics for analyzing gross revenue generated throughout the event. It includes a graphical and tabular representation of revenue generated via promo codes and tracking links. Deliver an awe inspiring pitch with this creative Effective Company Event Communication Tactics Dashboard For Tracking Event Gross Revenue Introduction PDF bundle. Topics like Discount Claimed, Gross Revenue, Codes Tracking can be discussed with this completely editable template. It is available for immediate download depending on the needs and requirements of the user.
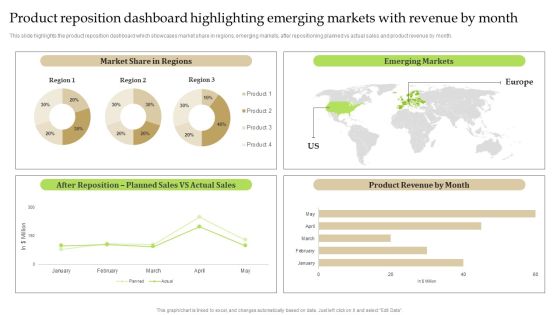
Product Reposition Dashboard Highlighting Emerging Markets With Revenue By Month Brochure PDF
This slide highlights the product reposition dashboard which showcases market share in regions, emerging markets, after repositioning planned vs actual sales and product revenue by month. Are you searching for a Product Reposition Dashboard Highlighting Emerging Markets With Revenue By Month Brochure PDF that is uncluttered, straightforward, and original Its easy to edit, and you can change the colors to suit your personal or business branding. For a presentation that expresses how much effort you have put in, this template is ideal. With all of its features, including tables, diagrams, statistics, and lists, its perfect for a business plan presentation. Make your ideas more appealing with these professional slides. Download Product Reposition Dashboard Highlighting Emerging Markets With Revenue By Month Brochure PDF from Slidegeeks today.
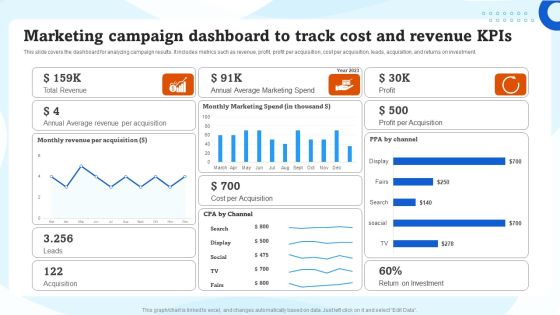
Marketing Campaign Dashboard To Track Cost And Revenue Kpis Ppt Infographics Good PDF
This slide covers the dashboard for analyzing campaign results. It includes metrics such as revenue, profit, profit per acquisition, cost per acquisition, leads, acquisition, and returns on investment. Formulating a presentation can take up a lot of effort and time, so the content and message should always be the primary focus. The visuals of the PowerPoint can enhance the presenters message, so our Marketing Campaign Dashboard To Track Cost And Revenue Kpis Ppt Infographics Good PDF was created to help save time. Instead of worrying about the design, the presenter can concentrate on the message while our designers work on creating the ideal templates for whatever situation is needed. Slidegeeks has experts for everything from amazing designs to valuable content, we have put everything into Marketing Campaign Dashboard To Track Cost And Revenue Kpis Ppt Infographics Good PDF.

Budget Analysis Dashboard With Actual And Forecasted Revenue Comparison Structure PDF
This slide displays the budget analysis report comparing the budget with the actual year to date data. It also helps in making estimations for the remaining year. It includes variance between budgeted and actual gross margin results, service revenue, profit margin, product revenue, payroll cost, etc. Pitch your topic with ease and precision using this Budget Analysis Dashboard With Actual And Forecasted Revenue Comparison Structure PDF. This layout presents information on Payroll Cost, Budget Revenue Components, Product Revenue. It is also available for immediate download and adjustment. So, changes can be made in the color, design, graphics or any other component to create a unique layout.

KPI Dashboard To Monitor E Commerce Revenue Analysis Performance Mockup PDF
This slide shows the key performance indicators dashboard which can be used to analyze current financial position of e-commerce business. It includes metrics such as revenue, expenses, profit, cash in hand, etc. Showcasing this set of slides titled KPI Dashboard To Monitor E Commerce Revenue Analysis Performance Mockup PDF. The topics addressed in these templates are Accounts Receivable, Accounts Payable, Revenue, Expenses. All the content presented in this PPT design is completely editable. Download it and make adjustments in color, background, font etc. as per your unique business setting.
Operations Of Commercial Bank Dashboard Tracking Customer Activities And Revenue Generated Inspiration PDF
This slide contains dashboard that will allow bank to track the customer activities in terms of new customer acquired, customer acquisition cost and overall revenue generated. Deliver and pitch your topic in the best possible manner with this operations of commercial bank dashboard tracking customer activities and revenue generated inspiration pdf. Use them to share invaluable insights on avg revenue per customer, customers acquisition cost, compared to previous year and impress your audience. This template can be altered and modified as per your expectations. So, grab it now.

 Home
Home