Revenue Dashboard

Digital Audit Dashboard Indicating Bounce And Churn Rate With Visitors By Channel Information PDF
This slide showcases the dashboard of website digital audit which includes the visitors, leads, customers, MRR, lifetime value, website visitors by channel and top landing page with average per customer revenue. Deliver an awe inspiring pitch with this creative Digital Audit Dashboard Indicating Bounce And Churn Rate With Visitors By Channel Information PDF bundle. Topics like Monthly Recurring Revenue, Bounce Rate, Churn Rate can be discussed with this completely editable template. It is available for immediate download depending on the needs and requirements of the user.
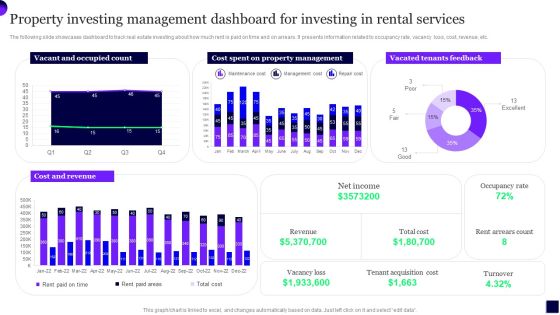
Property Investing Management Dashboard For Investing In Rental Services Template PDF
The following slide showcases dashboard to track real estate investing about how much rent is paid on time and on arrears. It presents information related to occupancy rate, vacancy loss, cost, revenue, etc. Showcasing this set of slides titled Property Investing Management Dashboard For Investing In Rental Services Template PDF. The topics addressed in these templates are Cost, Property Management, Revenue. All the content presented in this PPT design is completely editable. Download it and make adjustments in color, background, font etc. as per your unique business setting.

Dashboard For E Commerce Project Management Ppt Ideas Design Inspiration PDF
Mentioned slide illustrates a dashboard which can be used by company for e-Commerce project management. The various metrics mentioned in the slide are new orders, total revenue, expenses, new users, etc. Showcasing this set of slides titled Dashboard For E Commerce Project Management Ppt Ideas Design Inspiration PDF. The topics addressed in these templates are New Orders, Total Income, Total Expense. All the content presented in this PPT design is completely editable. Download it and make adjustments in color, background, font etc. as per your unique business setting.

Campaign Sessions And Conversion Performance Dashboard Strategic Promotion Plan To Improve Inspiration PDF
Following slide illustrates campaign session and conversion performance dashboard. It covers details such as revenues, cost per click, transactions, impressions, sessions and conversion performance.Do you have to make sure that everyone on your team knows about any specific topic I yes, then you should give Campaign Sessions And Conversion Performance Dashboard Strategic Promotion Plan To Improve Inspiration PDF a try. Our experts have put a lot of knowledge and effort into creating this impeccable Campaign Sessions And Conversion Performance Dashboard Strategic Promotion Plan To Improve Inspiration PDF. You can use this template for your upcoming presentations, as the slides are perfect to represent even the tiniest detail. You can download these templates from the Slidegeeks website and these are easy to edit. So grab these today.

Degree Of Operational Leverage Dashboard With Income Statement Ppt Infographics Layout PDF
This slide illustrates graphical representation of company revenue and income statement. It includes monthly revenue, revenue by products, revenue by country etc. Pitch your topic with ease and precision using this Degree Of Operational Leverage Dashboard With Income Statement Ppt Infographics Layout PDF. This layout presents information on Monthly Revenue, Income Statement, Product. It is also available for immediate download and adjustment. So, changes can be made in the color, design, graphics or any other component to create a unique layout.

Implementing Digital Transformation Kpi Dashboard To Track Digital Transformation Initiatives Structure PDF
Following slide provides dashboard that can be used by the businesses to measure the performance of digital transformation initiatives with the help of different KPIs. KPIs covered are social presence, click through rate, sales revenue, churn amount etc. The Implementing Digital Transformation Kpi Dashboard To Track Digital Transformation Initiatives Structure PDF is a compilation of the most recent design trends as a series of slides. It is suitable for any subject or industry presentation, containing attractive visuals and photo spots for businesses to clearly express their messages. This template contains a variety of slides for the user to input data, such as structures to contrast two elements, bullet points, and slides for written information. Slidegeeks is prepared to create an impression.
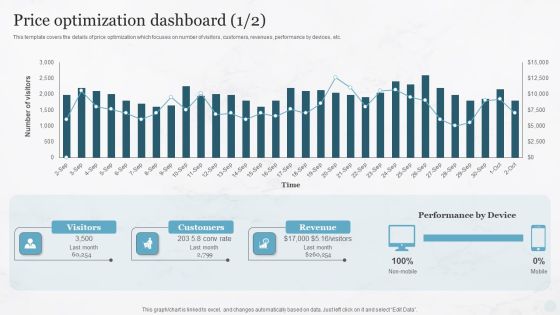
Price Optimization Dashboard Pricing Strategies For New Product In Market Infographics PDF
This template covers the details of price optimization which focuses on number of visitors, customers, revenues, performance by devices, etc.Find highly impressive Price Optimization Dashboard Pricing Strategies For New Product In Market Infographics PDF on Slidegeeks to deliver a meaningful presentation. You can save an ample amount of time using these presentation templates. No need to worry to prepare everything from scratch because Slidegeeks experts have already done a huge research and work for you. You need to download Price Optimization Dashboard Pricing Strategies For New Product In Market Infographics PDF for your upcoming presentation. All the presentation templates are 100precent editable and you can change the color and personalize the content accordingly. Download now.

Business Monthly Sales Report Summary Dashboard With Churn Rate Background PDF
The following slide highlights the monthly sales report dashboard with churn rate. It showcases details for current month sales, total revenue, current month profit, current month cost, sales revenue, current month expense, revenue churn rate and accumulated revenue.Pitch your topic with ease and precision using this Business Monthly Sales Report Summary Dashboard With Churn Rate Background PDF This layout presents information on Total Revenue, Accumulated Revenue, Marketing Medium It is also available for immediate download and adjustment. So, changes can be made in the color, design, graphics or any other component to create a unique layout.

Dashboard To Evaluate Marketing Campaign Performance Ecommerce Marketing Plan To Enhance Microsoft PDF
This slide represents dashboard to evaluate marketing campaign performance. It includes revenue, sales, total orders, order value, conversion rate etc.Do you have to make sure that everyone on your team knows about any specific topic I yes, then you should give Dashboard To Evaluate Marketing Campaign Performance Ecommerce Marketing Plan To Enhance Microsoft PDF a try. Our experts have put a lot of knowledge and effort into creating this impeccable Dashboard To Evaluate Marketing Campaign Performance Ecommerce Marketing Plan To Enhance Microsoft PDF. You can use this template for your upcoming presentations, as the slides are perfect to represent even the tiniest detail. You can download these templates from the Slidegeeks website and these are easy to edit. So grab these today.

Revolutionizing Customer Support Through Digital Transformation Customer Service Dashboard Slides PDF
This slide represents customer service dashboard showcasing user experience. It includes request volume, revenue, customer satisfaction, customer retention etc. Here you can discover an assortment of the finest PowerPoint and Google Slides templates. With these templates, you can create presentations for a variety of purposes while simultaneously providing your audience with an eye catching visual experience. Download Revolutionizing Customer Support Through Digital Transformation Customer Service Dashboard Slides PDF to deliver an impeccable presentation. These templates will make your job of preparing presentations much quicker, yet still, maintain a high level of quality. Slidegeeks has experienced researchers who prepare these templates and write high quality content for you. Later on, you can personalize the content by editing the Revolutionizing Customer Support Through Digital Transformation Customer Service Dashboard Slides PDF.

Brand Personality Improvement To Increase Profits Customer Tracking Dashboard To Monitor Brand Themes PDF
This slide provides information brand loyalty tracking dashboard in order to monitor customer engagement, average revenues, new vs. returning visitors performance, etc. Get a simple yet stunning designed Brand Personality Improvement To Increase Profits Customer Tracking Dashboard To Monitor Brand Themes PDF. It is the best one to establish the tone in your meetings. It is an excellent way to make your presentations highly effective. So, download this PPT today from Slidegeeks and see the positive impacts. Our easy to edit Brand Personality Improvement To Increase Profits Customer Tracking Dashboard To Monitor Brand Themes PDF can be your go to option for all upcoming conferences and meetings. So, what are you waiting for Grab this template today.

Brand Management To Enhance Customer Tracking Dashboard To Monitor Brand Loyalty Microsoft PDF
This slide provides information brand loyalty tracking dashboard in order to monitor customer engagement, average revenues, new vs. returning visitors performance, etc. This Brand Management To Enhance Customer Tracking Dashboard To Monitor Brand Loyalty Microsoft PDF is perfect for any presentation, be it in front of clients or colleagues. It is a versatile and stylish solution for organizing your meetings. The Brand Management To Enhance Customer Tracking Dashboard To Monitor Brand Loyalty Microsoft PDF features a modern design for your presentation meetings. The adjustable and customizable slides provide unlimited possibilities for acing up your presentation. Slidegeeks has done all the homework before launching the product for you. So, dont wait, grab the presentation templates today
Effective Brand Reputation Management Customer Tracking Dashboard To Monitor Brand Introduction PDF
This slide provides information brand loyalty tracking dashboard in order to monitor customer engagement, average revenues, new vs. Returning visitors performance, etc. Formulating a presentation can take up a lot of effort and time, so the content and message should always be the primary focus. The visuals of the PowerPoint can enhance the presenters message, so our Effective Brand Reputation Management Customer Tracking Dashboard To Monitor Brand Introduction PDF was created to help save time. Instead of worrying about the design, the presenter can concentrate on the message while our designers work on creating the ideal templates for whatever situation is needed. Slidegeeks has experts for everything from amazing designs to valuable content, we have put everything into Effective Brand Reputation Management Customer Tracking Dashboard To Monitor Brand Introduction PDF.

Business Restructuring Process Dashboard To Measure Business Financial Performance Rules PDF
This slide shows the dashboard to measure business financial performance which focuses on revenues, debt to equity, net profit margin, gross profit margin and return on equity. If you are looking for a format to display your unique thoughts, then the professionally designed Business Restructuring Process Dashboard To Measure Business Financial Performance Rules PDF is the one for you. You can use it as a Google Slides template or a PowerPoint template. Incorporate impressive visuals, symbols, images, and other charts. Modify or reorganize the text boxes as you desire. Experiment with shade schemes and font pairings. Alter, share or cooperate with other people on your work. Download Business Restructuring Process Dashboard To Measure Business Financial Performance Rules PDF and find out how to give a successful presentation. Present a perfect display to your team and make your presentation unforgettable.

Deployment Of Business Process Dashboard To Measure Business Financial Performance Microsoft PDF
This slide shows the dashboard to measure business financial performance which focuses on revenues, debt to equity, net profit margin, gross profit margin and return on equity. Do you have to make sure that everyone on your team knows about any specific topic I yes, then you should give Deployment Of Business Process Dashboard To Measure Business Financial Performance Microsoft PDF a try. Our experts have put a lot of knowledge and effort into creating this impeccable Deployment Of Business Process Dashboard To Measure Business Financial Performance Microsoft PDF. You can use this template for your upcoming presentations, as the slides are perfect to represent even the tiniest detail. You can download these templates from the Slidegeeks website and these are easy to edit. So grab these today.

Kpi Dashboard To Track Progress Of Tactics To Launch New Product Infographics PDF
Mentioned slide showcases KPI dashboard to monitor impact of product launch strategy on increasing business market share. It includes elements such as revenue, new customers, lead generation rate, customer satisfaction rate, revenue by customers, revenue and lead generation by marketing platform. Showcasing this set of slides titled Kpi Dashboard To Track Progress Of Tactics To Launch New Product Infographics PDF. The topics addressed in these templates are Quarterly Sales Comparison, Revenue Marketing, Revenue Customers. All the content presented in this PPT design is completely editable. Download it and make adjustments in color, background, font etc. as per your unique business setting.

BPR To Develop Operational Effectiveness Dashboard To Measure Business Financial Performance Elements PDF
This slide shows the dashboard to measure business financial performance which focuses on revenues, debt to equity, net profit margin, gross profit margin and return on equity. Coming up with a presentation necessitates that the majority of the effort goes into the content and the message you intend to convey. The visuals of a PowerPoint presentation can only be effective if it supplements and supports the story that is being told. Keeping this in mind our experts created BPR To Develop Operational Effectiveness Dashboard To Measure Business Financial Performance Elements PDF to reduce the time that goes into designing the presentation. This way, you can concentrate on the message while our designers take care of providing you with the right template for the situation.
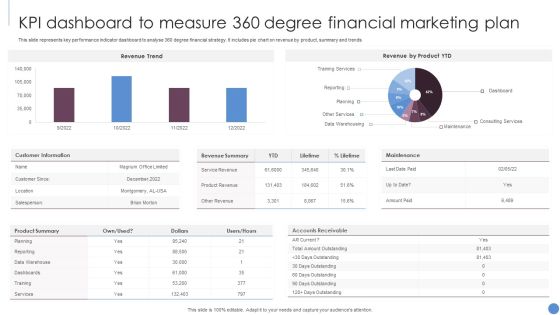
KPI Dashboard To Measure 360 Degree Financial Marketing Plan Slides PDF
This slide represents key performance indicator dashboard to analyse 360 degree financial strategy. It includes pie chart on revenue by product, summary and trends. Showcasing this set of slides titled KPI Dashboard To Measure 360 Degree Financial Marketing Plan Slides PDF. The topics addressed in these templates are Revenue Trend, Revenue Product YTD, Customer Information. All the content presented in this PPT design is completely editable. Download it and make adjustments in color, background, font etc. as per your unique business setting.

Corporate Organization Playbook Key Business Metrics Dashboard Ppt Show Rules PDF
The following dashboard displays the key business metrics such as new customers, profit, revenue per customer, and weekly revenue. Deliver an awe inspiring pitch with this creative corporate organization playbook key business metrics dashboard ppt show rules pdf bundle. Topics like new customer iytd, sales revenue i ytd, profit i ytd can be discussed with this completely editable template. It is available for immediate download depending on the needs and requirements of the user.
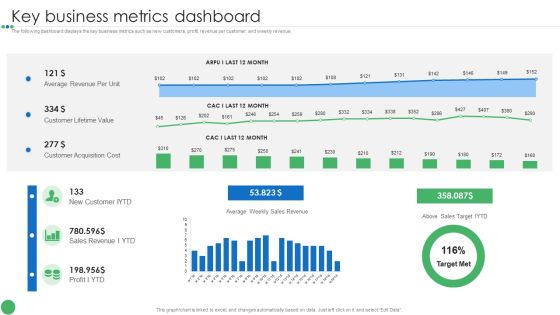
Key Business Metrics Dashboard Guide To Enhance Organic Growth By Advancing Business Procedures Pictures PDF
The following dashboard displays the key business metrics such as new customers, profit, revenue per customer, and weekly revenue.Deliver an awe inspiring pitch with this creative Key Business Metrics Dashboard Guide To Enhance Organic Growth By Advancing Business Procedures Pictures PDF bundle. Topics like Average Revenue, Customer Lifetime, Customer Acquisition can be discussed with this completely editable template. It is available for immediate download depending on the needs and requirements of the user.
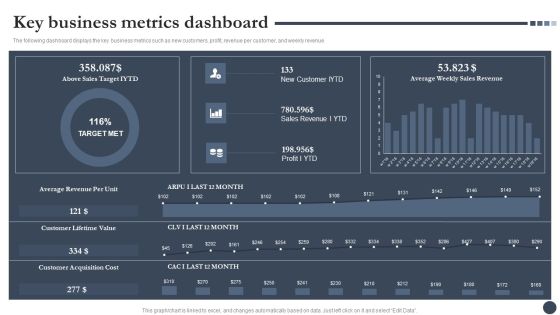
Strategic Playbook For Enterprise Administration Key Business Metrics Dashboard Pictures PDF
The following dashboard displays the key business metrics such as new customers, profit, revenue per customer, and weekly revenue. Deliver and pitch your topic in the best possible manner with this Strategic Playbook For Enterprise Administration Key Business Metrics Dashboard Pictures PDF. Use them to share invaluable insights on Average Revenue Per Unit, Customer Lifetime Value, Customer Acquisition Cost and impress your audience. This template can be altered and modified as per your expectations. So, grab it now.

Establishing Successful Brand Strategy To Captivate Consumers Business Performance Dashboard Microsoft PDF
Following slide covers business performance dashboard of the firm. It include KPIs such as average weekly sales revenue, above sales target, sales revenue and profit generated. Deliver an awe inspiring pitch with this creative establishing successful brand strategy to captivate consumers business performance dashboard microsoft pdf bundle. Topics like customer acquisition cost, customer lifetime value, average revenue per unit can be discussed with this completely editable template. It is available for immediate download depending on the needs and requirements of the user.
Successful Brand Development Plan Business Performance Measuring KPI Dashboard Icons PDF
Following slide covers business performance dashboard of the firm. It include KPIs such as average weekly sales revenue, above sales target, sales revenue and profit generated.Deliver and pitch your topic in the best possible manner with this successful brand development plan business performance measuring kpi dashboard icons pdf Use them to share invaluable insights on average revenue, customer lifetime value, customer acquisition cost and impress your audience. This template can be altered and modified as per your expectations. So, grab it now.

Financial Dashboard For Non Profit Financial Plan Budget Management Elements PDF
The below slide exhibits a financial dashboard for non profit organizations that helps managers to analyze financial performance in an effective way. Key components are revenue ratio by entity, revenue ratio by type, etc.Pitch your topic with ease and precision using this Financial Dashboard For Non Profit Financial Plan Budget Management Elements PDF. This layout presents information on Revenue Actual, Revenue Actual. It is also available for immediate download and adjustment. So, changes can be made in the color, design, graphics or any other component to create a unique layout.
KPI Dashboard To Track Services Company Strategy Business Marketing Performance Guidelines PDF
Following slide demonstrates dashboard for monitoring services company sales strategy impact on maximizing business profits. It includes elements such as number of sales, revenue, profit, cost, monthly sales revenue, cost breakdown, up and cross sell, revenue collected and sales by communication channel. Showcasing this set of slides titled KPI Dashboard To Track Services Company Strategy Business Marketing Performance Guidelines PDF. The topics addressed in these templates are Revenue, Profit, Cost. All the content presented in this PPT design is completely editable. Download it and make adjustments in color, background, font etc. as per your unique business setting.
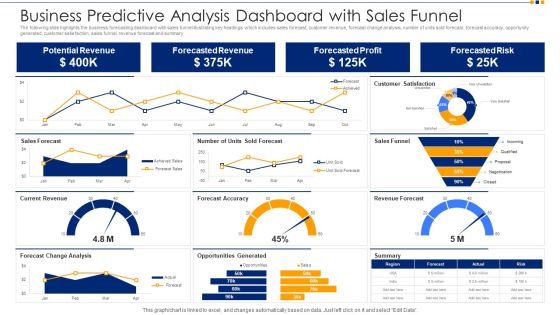
Business Predictive Analysis Dashboard With Sales Funnel Ppt Show Images PDF
The following slide highlights the business forecasting dashboard with sales funnel illustrating key headings which includes sales forecast, customer revenue, forecast change analysis, number of units sold forecast, forecast accuracy, opportunity generated, customer satisfaction, sales funnel, revenue forecast and summary. Pitch your topic with ease and precision using this business predictive analysis dashboard with sales funnel ppt show images pdf. This layout presents information on potential revenue, forecasted revenue, forecasted profit, forecasted risk. It is also available for immediate download and adjustment. So, changes can be made in the color, design, graphics or any other component to create a unique layout.
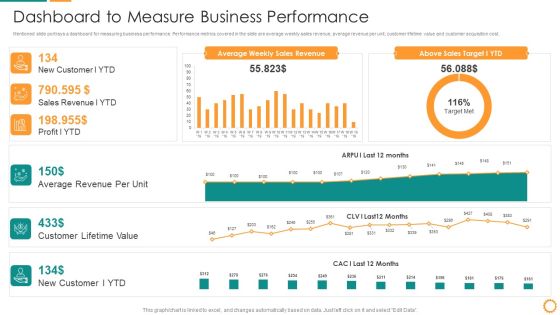
IT Consolidation Post Mergers And Acquisition Dashboard To Measure Business Performance Clipart PDF
Mentioned slide portrays a dashboard for measuring business performance. Performance metrics covered in the slide are average weekly sales revenue, average revenue per unit, customer lifetime value and customer acquisition cost. Deliver and pitch your topic in the best possible manner with this IT Consolidation Post Mergers And Acquisition Dashboard To Measure Business Performance Clipart PDF. Use them to share invaluable insights on Average Revenue, Customer Lifetime Value, Sales Revenue, Sales Target and impress your audience. This template can be altered and modified as per your expectations. So, grab it now.

Automobile Company Actual And Forecasted Monthly Sales Dashboard Ppt Infographic Template Aids PDF
This slide shows the dashboard for forecasting the sales of an automobile company for the current month. It represents details related to revenue by pipeline, new deals, sales forecast, revenue goal attainment by owner for the current month and pipeline coverage by next month. Showcasing this set of slides titled Automobile Company Actual And Forecasted Monthly Sales Dashboard Ppt Infographic Template Aids PDF. The topics addressed in these templates are Forecast Month, Revenue Goal Attainment, Revenue Goal Attainment. All the content presented in this PPT design is completely editable. Download it and make adjustments in color, background, font etc. as per your unique business setting.

Ecommerce Management Kpi Dashboard Product Ppt PowerPoint Presentation Summary Graphics PDF
Presenting this set of slides with name ecommerce management kpi dashboard product ppt powerpoint presentation summary graphics pdf. The topics discussed in these slides are revenue product, returning vs new customers, new customers, revenue product, profit and roi channel, growth. This is a completely editable PowerPoint presentation and is available for immediate download. Download now and impress your audience.

B2B Trade Management Ecommerce Management KPI Dashboard Returning Vs New Customers Brochure PDF
Deliver and pitch your topic in the best possible manner with this b2b trade management ecommerce management kpi dashboard returning vs new customers brochure pdf. Use them to share invaluable insights on profit and roi by channel, revenue product, returning vs new customers, revenue, expenses and impress your audience. This template can be altered and modified as per your expectations. So, grab it now.
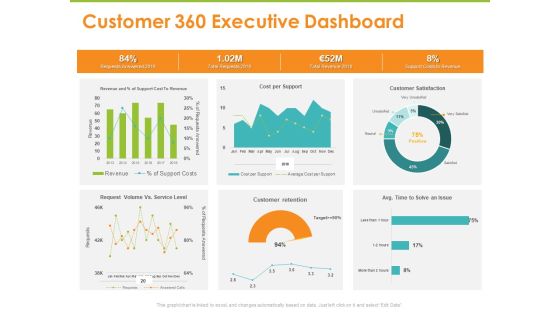
Synchronized Information About Your Customers Customer 360 Executive Dashboard Ppt PowerPoint Presentation Ideas Aids PDF
Deliver an awe-inspiring pitch with this creative synchronized information about your customers customer 360 executive dashboard ppt powerpoint presentation ideas aids pdf bundle. Topics like requests answered 2018, total requests 2018, total revenue 2018, support costs to revenue, cost per support can be discussed with this completely editable template. It is available for immediate download depending on the needs and requirements of the user.
Online Business Strategy Playbook Dashboard Tracking Essential Kpis For Ecommerce Performance Graphics PDF
This slide provides information regarding essential KPIs for ecommerce performance dashboard tracking average bounce rate, new vs. old customers, channel revenue vs. channel acquisitions costs, channel revenue vs. sales, average conversion rate, etc. Deliver an awe inspiring pitch with this creative online business strategy playbook dashboard tracking essential kpis for ecommerce performance graphics pdf bundle. Topics like Dashboard Tracking Essential KPIs for Ecommerce Performance can be discussed with this completely editable template. It is available for immediate download depending on the needs and requirements of the user.
Retail Trading Platform Dashboard Tracking Essential Kpis For Ecommerce Performance Diagrams PDF
This slide provides information regarding essential KPIs for ecommerce performance dashboard tracking average bounce rate, new vs. old customers, channel revenue vs. channel acquisitions costs, channel revenue vs. sales, average conversion rate, etc. Deliver an awe inspiring pitch with this creative retail trading platform dashboard tracking essential kpis for ecommerce performance diagrams pdf bundle. Topics like average bounce rate, average conversion rate, bounce rate, channel revenue sales can be discussed with this completely editable template. It is available for immediate download depending on the needs and requirements of the user.
Strategy Playbook For Ecommerce Business Dashboard Tracking Essential Kpis For Ecommerce Performance Rules PDF
This slide provides information regarding essential KPIs for ecommerce performance dashboard tracking average bounce rate, new vs. old customers, channel revenue vs. channel acquisitions costs, channel revenue vs. sales, average conversion rate, etc. Deliver an awe inspiring pitch with this creative Strategy Playbook For Ecommerce Business Dashboard Tracking Essential Kpis For Ecommerce Performance Rules PDF bundle. Topics like Returning Customers, Acquisition Cost, Channel Revenue can be discussed with this completely editable template. It is available for immediate download depending on the needs and requirements of the user.

Retail Weekly Sales Performance Report Dashboard To Measure Performance Ppt Gallery File Formats PDF
The following slide exhibits dashboard for small-scale retailers and product sales for chosen time period. It presents information related to revenue breakdown, total income, etc. Showcasing this set of slides titled Retail Weekly Sales Performance Report Dashboard To Measure Performance Ppt Gallery File Formats PDF. The topics addressed in these templates are Revenue Breakdown, Total Income, Total Revenue. All the content presented in this PPT design is completely editable. Download it and make adjustments in color, background, font etc. as per your unique business setting.

Automating Supply Chain Dashboard For Tracking Impact Of Transport Automation Themes PDF
This slide covers the dashboard for tracking vehicle efficiency after transport automation. It include KPIs such as truck turnaround time, average revenue per hour, truckload capacity, transit time, on-time pickup, and average revenue per mile. Deliver an awe inspiring pitch with this creative Automating Supply Chain Dashboard For Tracking Impact Of Transport Automation Themes PDF bundle. Topics like Average Revenue, Per Mile, Truck Turnaround can be discussed with this completely editable template. It is available for immediate download depending on the needs and requirements of the user.

IT Service Incorporation And Administration Dashboard To Measure Business Performance Portrait PDF
Mentioned slide portrays a dashboard for measuring business performance. Performance metrics covered in the slide are average weekly sales revenue, average revenue per unit, customer lifetime value and customer acquisition cost. Deliver and pitch your topic in the best possible manner with this it service incorporation and administration dashboard to measure business performance portrait pdf. Use them to share invaluable insights on sales, revenue, target, acquisition cost and impress your audience. This template can be altered and modified as per your expectations. So, grab it now.
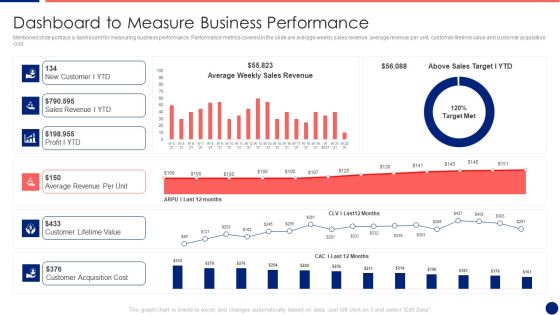
Information Technology Service Integration Post Acquisition Merger Dashboard To Measure Business Pictures PDF
Mentioned slide portrays a dashboard for measuring business performance. Performance metrics covered in the slide are average weekly sales revenue, average revenue per unit, customer lifetime value and customer acquisition cost. Deliver and pitch your topic in the best possible manner with this information technology service integration post acquisition merger dashboard to measure business pictures pdf. Use them to share invaluable insights on sales revenue, average, cost and impress your audience. This template can be altered and modified as per your expectations. So, grab it now.

Organic Business Growth Strategies Dashboard For Measuring Success Of Our Marketing Efforts Diagrams PDF
Purpose of the following slide is to display a dashboard to help analyze the marketing efforts through essential metrics such as the revenue generated, average revenue generated per unit etc. Deliver an awe inspiring pitch with this creative Organic Business Growth Strategies Dashboard For Measuring Success Of Our Marketing Efforts Diagrams PDF bundle. Topics like Average Revenue, Customer Lifetime Value, Customer Acquisition Cost can be discussed with this completely editable template. It is available for immediate download depending on the needs and requirements of the user.
Consumer Journey Mapping Techniques Referral Program Performance Tracking Dashboard Formats PDF
This slide covers the KPI dashboard for analyzing referral campaign results. It includes metrics such as total revenue generated, monthly recurring revenue, new customers, clicks, cancelled customers, paying customers, etc. Showcasing this set of slides titled Consumer Journey Mapping Techniques Referral Program Performance Tracking Dashboard Formats PDF. The topics addressed in these templates are Revenue, New Customers, Paying Customers. All the content presented in this PPT design is completely editable. Download it and make adjustments in color, background, font etc. as per your unique business setting.

Wireless Phone Information Management Plan Key Business Metrics Dashboard Professional PDF
Presenting this set of slides with name wireless phone information management plan key business metrics dashboard professional pdf. The topics discussed in these slides are revenue growth, market share, reduction in cost, nps score, product sales growth. This is a completely editable PowerPoint presentation and is available for immediate download. Download now and impress your audience.

Introducing A New Product To The Market Business Performance KPI Dashboard Brochure PDF
Following slide covers business performance dashboard of the firm. It include KPIs such as average weekly sales revenue, above sales target, sales revenue and profit generated.Deliver and pitch your topic in the best possible manner with this Introducing A New Product To The Market Business Performance KPI Dashboard Brochure PDF Use them to share invaluable insights on Business Performance KPI Dashboard and impress your audience. This template can be altered and modified as per your expectations. So, grab it now.
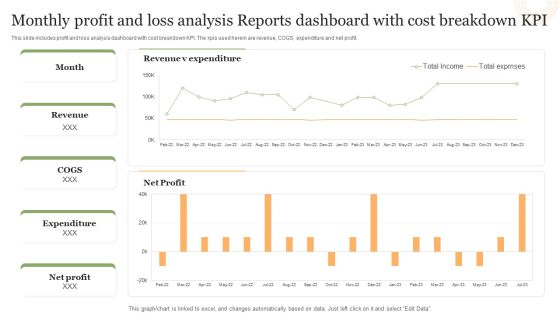
Monthly Profit And Loss Analysis Reports Dashboard With Cost Breakdown Kpi Structure PDF
This slide includes profit and loss analysis dashboard with cost breakdown KPI. The kpis used herein are revenue, COGS, expenditure and net profit.Pitch your topic with ease and precision using this Monthly Profit And Loss Analysis Reports Dashboard With Cost Breakdown Kpi Structure PDF. This layout presents information on Revenue Expenditure, Net Profit, Total Exprnses. It is also available for immediate download and adjustment. So, changes can be made in the color, design, graphics or any other component to create a unique layout.

Activity Management Customer Relationship Management Dashboard With Lead Status Portrait PDF
This slide illustrates graphical representation of activity management CRM statistical data. It includes sales team lead status, revenue meter, campaigns revenue graph. Showcasing this set of slides titled Activity Management Customer Relationship Management Dashboard With Lead Status Portrait PDF. The topics addressed in these templates are Sales Team Lead Status, Leads Sourced From Market. All the content presented in this PPT design is completely editable. Download it and make adjustments in color, background, font etc. as per your unique business setting.
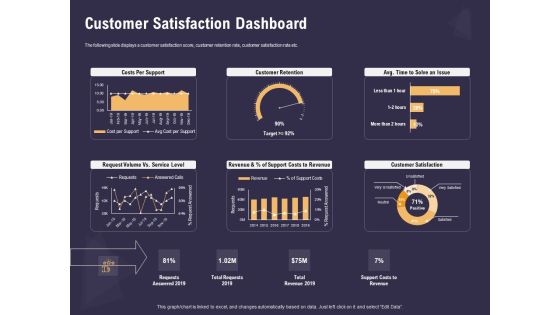
Effective Workforce Management Customer Satisfaction Dashboard Ppt PowerPoint Presentation Show Influencers PDF
Presenting this set of slides with name effective workforce management customer satisfaction dashboard ppt powerpoint presentation show influencers pdf. The topics discussed in these slides are costs per support, customer retention, avg time to solve an issue, request volume vs service level, revenue of support costs to revenue, customer satisfaction. This is a completely editable PowerPoint presentation and is available for immediate download. Download now and impress your audience.

Business Development And Promotion Orchestration For Customer Profile Nurturing Managing Account Dashboard Leads Designs PDF
The dashboard will provide overall scenario of all accounts and track new leads, top campaigns, expected revenue earned, etc. Deliver an awe inspiring pitch with this creative business development and promotion orchestration for customer profile nurturing managing account dashboard leads designs pdf bundle. Topics like managing account dashboard can be discussed with this completely editable template. It is available for immediate download depending on the needs and requirements of the user.

Agile Group For Product Development Measuring Business Unit Performance Dashboard Pictures PDF
This slide covers dashboard that shows business unit performance such as new customers, average weekly sales revenue, sales revenues, profits, customer lifetime value, etc. Deliver and pitch your topic in the best possible manner with this agile group for product development measuring business unit performance dashboard pictures pdf. Use them to share invaluable insights on average revenue per unit, customer lifetime value, customer acquisition cost and impress your audience. This template can be altered and modified as per your expectations. So, grab it now.
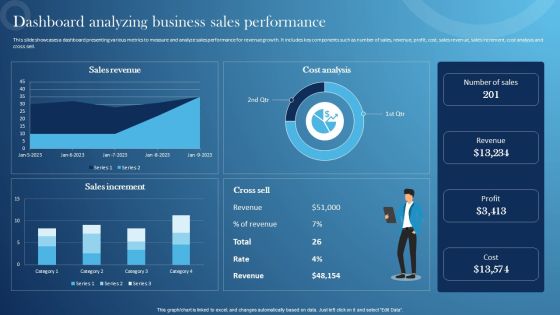
Inspecting Sales Optimization Areas Dashboard Analyzing Business Sales Performance Slides PDF
This slide showcases a dashboard presenting various metrics to measure and analyze sales performance for revenue growth. It includes key components such as number of sales, revenue, profit, cost, sales revenue, sales increment, cost analysis and cross sell. Create an editable Inspecting Sales Optimization Areas Dashboard Analyzing Business Sales Performance Slides PDF that communicates your idea and engages your audience. Whether youre presenting a business or an educational presentation, pre-designed presentation templates help save time. Inspecting Sales Optimization Areas Dashboard Analyzing Business Sales Performance Slides PDF is highly customizable and very easy to edit, covering many different styles from creative to business presentations. Slidegeeks has creative team members who have crafted amazing templates. So, go and get them without any delay.
Process Enhancement Plan To Boost Sales Performance Monthly Sales Performance Tracking And Monitoring Dashboard Professional PDF
This slide showcases a dashboard presenting various metrics to measure and analyze sales performance for revenue growth. It includes key components such as number of sales, revenue, profit, cost, sales revenue, sales increment, cost analysis and cross sell. Create an editable Process Enhancement Plan To Boost Sales Performance Monthly Sales Performance Tracking And Monitoring Dashboard Professional PDF that communicates your idea and engages your audience. Whether youre presenting a business or an educational presentation, pre designed presentation templates help save time. Process Enhancement Plan To Boost Sales Performance Monthly Sales Performance Tracking And Monitoring Dashboard Professional PDF is highly customizable and very easy to edit, covering many different styles from creative to business presentations. Slidegeeks has creative team members who have crafted amazing templates. So, go and get them without any delay.
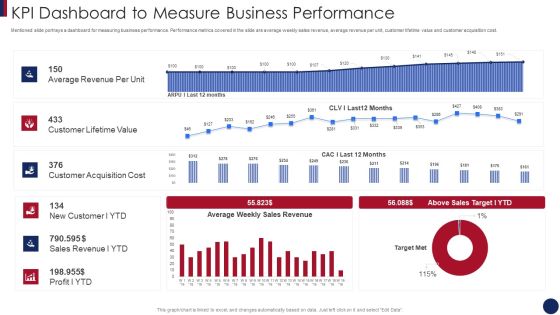
Post Merger Information Technology Service Delivery Amalgamation KPI Dashboard To Measure Business Template PDF
Mentioned slide portrays a dashboard for measuring business performance. Performance metrics covered in the slide are average weekly sales revenue, average revenue per unit, customer lifetime value and customer acquisition cost. Deliver an awe inspiring pitch with this creative post merger information technology service delivery amalgamation kpi dashboard to measure business template pdf bundle. Topics like kpi dashboard to measure business performance can be discussed with this completely editable template. It is available for immediate download depending on the needs and requirements of the user.

Deploying B2B Advertising Techniques For Lead Generation Social Media Marketing Kpi Dashboard Analyse Pictures PDF
This slide covers ecommerce marketing KPI dashboard to track performance. It involves details such as ecommerce revenue generated, number of new customers, repeat buying rate, attribute revenue and conversion rate and attributed revenue and conversion rate by marketing channel. Slidegeeks is here to make your presentations a breeze with Deploying B2B Advertising Techniques For Lead Generation Social Media Marketing Kpi Dashboard Analyse Pictures PDF With our easy to use and customizable templates, you can focus on delivering your ideas rather than worrying about formatting. With a variety of designs to choose from, you are sure to find one that suits your needs. And with animations and unique photos, illustrations, and fonts, you can make your presentation pop. So whether you are giving a sales pitch or presenting to the board, make sure to check out Slidegeeks first.

Call Center Metrics Dashboard To Measure Customer Satisfaction Level Slides PDF
Mentioned slide outlines call center KPI dashboard which will assist various call centers to evaluate the customer satisfaction level. The critical KPIs mentioned in the template are total revenue earned, cost per support, average time taken to solve an issue etc. Showcasing this set of slides titled Call Center Metrics Dashboard To Measure Customer Satisfaction Level Slides PDF. The topics addressed in these templates are Total Revenue, Support Costs, Customer Satisfaction. All the content presented in this PPT design is completely editable. Download it and make adjustments in color, background, font etc. as per your unique business setting.
Sales L2RM System Tracking Key Metrics Dashboard Ppt Professional Format Ideas PDF
This slide represents the dashboard for tracking the key performance indicators of sales lead to revenue management. It includes key metrics such as leads by campaign, ratings, lead generation rate, top accounts by revenue and top owners by number of accounts. Showcasing this set of slides titled Sales L2RM System Tracking Key Metrics Dashboard Ppt Professional Format Ideas PDF. The topics addressed in these templates are Leads By Campaign, Leads By Rating, Leads Generation Rate. All the content presented in this PPT design is completely editable. Download it and make adjustments in color, background, font etc. as per your unique business setting.

Dashboard For Strategic Evaluation Of Key Business Financials Ppt Gallery Aids PDF
This slide displays dashboard to review business performance and formulate appropriate improvement strategies. It further includes kpis such as revenue comparison, top selling categories, sales by month, customer satisfaction, etc. Showcasing this set of slides titled Dashboard For Strategic Evaluation Of Key Business Financials Ppt Gallery Aids PDF. The topics addressed in these templates are Revenue Comparison, Top Selling Categories, New Customer. All the content presented in this PPT design is completely editable. Download it and make adjustments in color, background, font etc. as per your unique business setting.

Key Business Metrics Dashboard Company Process Administration And Optimization Playbook Infographics PDF
The following dashboard displays the key business metrics such as new customers, profit, revenue per customer, and weekly revenue. Slidegeeks is here to make your presentations a breeze with Key Business Metrics Dashboard Company Process Administration And Optimization Playbook Infographics PDF With our easy-to-use and customizable templates, you can focus on delivering your ideas rather than worrying about formatting. With a variety of designs to choose from, you are sure to find one that suits your needs. And with animations and unique photos, illustrations, and fonts, you can make your presentation pop. So whether you are giving a sales pitch or presenting to the board, make sure to check out Slidegeeks first.

Customer Success KPIS Overview Dashboard For Technical Support Team Ppt PowerPoint Presentation Gallery Layouts PDF
This slide covers dashboard with parameters to monitor performance for customer success programs. It includes percentage of customers helped, team report metrics, new customers, MRR, revenue churn, cancellation and refunds. Showcasing this set of slides titled Customer Success KPIS Overview Dashboard For Technical Support Team Ppt PowerPoint Presentation Gallery Layouts PDF. The topics addressed in these templates are Customer, Cancelations, New Customer, Revenue Churn. All the content presented in this PPT design is completely editable. Download it and make adjustments in color, background, font etc. as per your unique business setting.

Customer Centric Success KPIS Dashboard Ppt PowerPoint Presentation Styles Example File PDF
This slide covers dashboard for customer oriented success metrics. It includes KPIs such as net promoter score, customer loyalty rate, premium users, customer lifetime value, customer and revenue churn rates, MRR growth and net retention rates, etc. Showcasing this set of slides titled Customer Centric Success KPIS Dashboard Ppt PowerPoint Presentation Styles Example File PDF. The topics addressed in these templates are New Retention, Customer Churn, Revenue Churn. All the content presented in this PPT design is completely editable. Download it and make adjustments in color, background, font etc. as per your unique business setting.

Customer Lifetime Value Based Success KPIS Dashboard Ppt PowerPoint Presentation Layouts Gridlines PDF
This slide covers dashboard for estimation of customer lifetime value as success metrics. It includes KPIs such as customer lifetime value, customer lifetime period, customer risk, customer contact rate, customer retention costs, average lifetime value, customer churn rate, average revenue per account, etc. Pitch your topic with ease and precision using this Customer Lifetime Value Based Success KPIS Dashboard Ppt PowerPoint Presentation Layouts Gridlines PDF. This layout presents information on Average Revenue, Customer Lifetime, Customer Risk. It is also available for immediate download and adjustment. So, changes can be made in the color, design, graphics or any other component to create a unique layout.
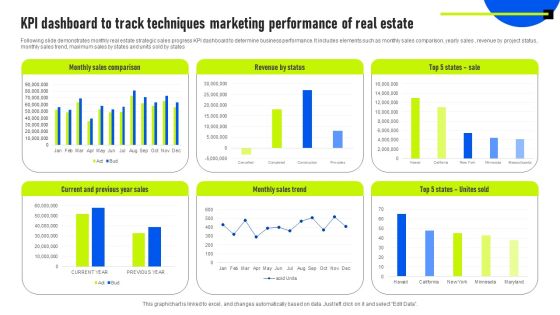
KPI Dashboard To Track Techniques Marketing Performance Of Real Estate Information PDF
Following slide demonstrates monthly real estate strategic sales progress KPI dashboard to determine business performance. It includes elements such as monthly sales comparison, yearly sales , revenue by project status, monthly sales trend, maximum sales by states and units sold by states. Showcasing this set of slides titled KPI Dashboard To Track Techniques Marketing Performance Of Real Estate Information PDF. The topics addressed in these templates are Revenue By Status, Monthly Sales Comparison, Monthly Sales Trend. All the content presented in this PPT design is completely editable. Download it and make adjustments in color, background, font etc. as per your unique business setting.
SAC Planning And Implementation SAP Analytics Cloud Dashboard For Product Sales Analysis Icons PDF
This slide illustrates the SAP Analytics Cloud dashboard to monitor product sales performance. It provides information regarding the gross margin and net revenue earned, product performance state wise and year wise. Deliver and pitch your topic in the best possible manner with this SAC Planning And Implementation SAP Analytics Cloud Dashboard For Product Sales Analysis Icons PDF. Use them to share invaluable insights on Gross Margin, Earned Quarter Wise, Gross Margin, Net Revenue and impress your audience. This template can be altered and modified as per your expectations. So, grab it now.
 Home
Home