AI PPT Maker
Templates
PPT Bundles
Design Services
Business PPTs
Business Plan
Management
Strategy
Introduction PPT
Roadmap
Self Introduction
Timelines
Process
Marketing
Agenda
Technology
Medical
Startup Business Plan
Cyber Security
Dashboards
SWOT
Proposals
Education
Pitch Deck
Digital Marketing
KPIs
Project Management
Product Management
Artificial Intelligence
Target Market
Communication
Supply Chain
Google Slides
Research Services
 One Pagers
All Categories
-
Home
- Customer Favorites
- Revenue Analysis
Revenue Analysis

Analysis And Implementation Process Ppt Business Plan Examples PowerPoint Slides
We present our analysis and implementation process ppt business plan examples PowerPoint Slides.Download our Competition PowerPoint Templates because Our PowerPoint Templates and Slides offer you the needful to organise your thoughts. Use them to list out your views in a logical sequence. Download and present our Industrial PowerPoint Templates because Our PowerPoint Templates and Slides will provide you a launch platform. Give a lift off to your ideas and send them into orbit. Download our Business PowerPoint Templates because Our PowerPoint Templates and Slides ensures Effective communication. They help you put across your views with precision and clarity. Download our Gear Wheels PowerPoint Templates because You are working at that stage with an air of royalty. Let our PowerPoint Templates and Slides be the jewels in your crown. Download and present our Circle Charts PowerPoint Templates because Our PowerPoint Templates and Slides will let you Clearly mark the path for others to follow.Use these PowerPoint slides for presentations relating to Development, training, business, research, process, chart, design, idea, organization, plan, technical, layout, concept, arrow, sign, render, show, diagram, gain, graphic, integration, engineer, technology, gear, management, creative, quality, contractor, transparency, profit, work, industry, analyze, database, software, structure, continuous, methodology. The prominent colors used in the PowerPoint template are Blue, Gray, Black.

Business Analysis Diagrams Visual Representation Of Strategy Roadmaps PowerPoint Templates
We present our business analysis diagrams visual representation of strategy roadmaps PowerPoint templates.Present our Arrows PowerPoint Templates because Our PowerPoint Templates and Slides are innately eco-friendly. Their high recall value negate the need for paper handouts. Present our Process and Flows PowerPoint Templates because Our PowerPoint Templates and Slides are effectively colour coded to prioritise your plans They automatically highlight the sequence of events you desire. Download our Flow Charts PowerPoint Templates because Our PowerPoint Templates and Slides will let your words and thoughts hit bullseye everytime. Download and present our Business PowerPoint Templates because Our PowerPoint Templates and Slides are topically designed to provide an attractive backdrop to any subject. Present our Shapes PowerPoint Templates because Timeline crunches are a fact of life. Meet all deadlines using our PowerPoint Templates and Slides.Use these PowerPoint slides for presentations relating to 3d, arrow, blank, business, businessconcept, chart, color,colorful, description, development, diagram, direction, element, empty, financial,flow, flowchart, four, future, gradient, graph, graphic, illustration, isolated, mirrored,object, placeholder, presentation, process, section, segment, set, shape, sign, steps, symbol. The prominent colors used in the PowerPoint template are Green lime, Blue, Gray.
Magnifier With Dollar Search Financial Analysis Powerpoint Template
Our above business slide contains graphics of magnifier on dollar notes. This diagram can be used to display dollar search and financial analysis. Capture the attention of your audience with this professional slide.
Money Plants For Financial Growth Analysis Powerpoint Slides
This PowerPoint slide contains graphics of three money plants. This professional slide may be used to display ideas for financial growth. Use this template to highlight to make impressive presentations.

Bar Graph For Profit Growth Analysis Powerpoint Slides
This PowerPoint template has been designed with bar graph with percentage values. This diagram is useful to exhibit profit growth analysis. This diagram slide can be used to make impressive presentations.
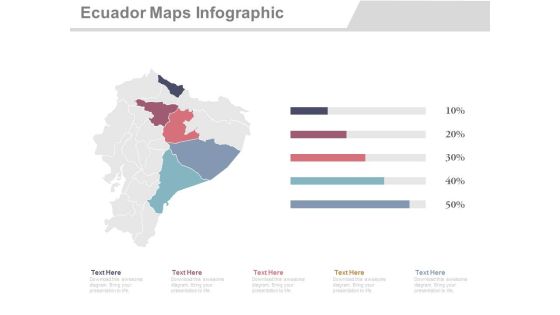
Ecuador Map With States Economic Analysis Powerpoint Slides
This PowerPoint template displays graphics of Ecuador map with different locations and percentage values. This Map template can be used in business presentations to depict economic analysis. This slide can also be used by school students for educational projects.

World Map With Global Economic Analysis Powerpoint Slides
This PowerPoint template has been designed with graphics of world map. You can download this diagram to exhibit global business analysis. Above PPT slide is suitable for business presentation.

Finland Map With Economic Data Analysis Powerpoint Slides
This PowerPoint template has been designed with Finland Map and areas highlighted. You may use this slide to display financial strategy analysis. This diagram provides an effective way of displaying information you can edit text, color, shade and style as per you need.

Business Man Draws Financial Data For Analysis PowerPoint Templates
This PowerPoint slide has a theme for financial data analysis. This image has been designed to display concept of financial planning and analysis. Deliver amazing presentations to mesmerize your audience using this image

Pie Charts For Financial Ratio Analysis Powerpoint Slides
This PowerPoint template has been designed with diagram of pie charts. This PPT slide can be used to prepare presentations for profit growth report and also for financial data analysis. You can download finance PowerPoint template to prepare awesome presentations.

Venn Circles Infographic For Financial Analysis PowerPoint Templates
This PowerPoint template has been designed with Venn circles infographic. This infographic template useful for financial analysis. Accelerate the impact of your ideas using this template.
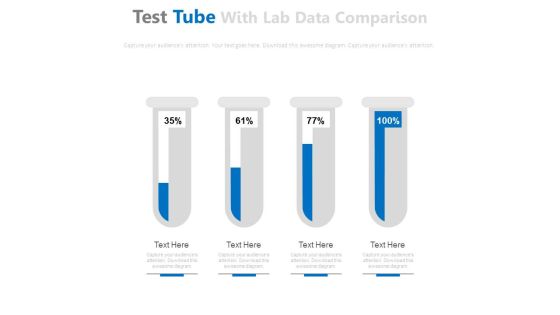
Test Tubes For Financial Ratio Analysis Powerpoint Slides
This PowerPoint template has been designed with graphics of test tubes. Use this PPT slide to depict financial ratio analysis. Download this PPT template to make impressive presentations.

Infographic Diagram For Business Process Analysis Powerpoint Slides
This PowerPoint slide contains business infographic diagram. This professional slide may be used to display business process analysis. Use this business template to make impressive presentations.
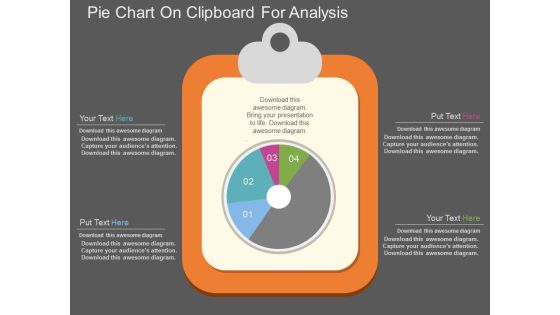
Pie Chart On Clipboard For Analysis Powerpoint Template
This PowerPoint template has been designed with graphics of pie chart on clipboard. Download this PPT slide for business and financial analysis. You may also use this professional template to depict statistical analysis.

Four Tags For Financial Review And Analysis Powerpoint Slides
This PowerPoint template has been designed with four tags and financial values. This PowerPoint template helps to exhibit financial review and analysis. Use this diagram slide to build an exclusive presentation.

Pie Chart For Financial Ratio Analysis Powerpoint Slides
This PPT slide contains graphics of eight stage pie chart. Download this PowerPoint template slide for financial ratio analysis. This diagram is editable you can edit text, color, shade and style as per you need.

Board With Bar Graph For Financial Analysis Powerpoint Slides
You can download this PowerPoint template to display statistical data and analysis. This PPT slide contains display board with bar graph. Draw an innovative business idea using this professional diagram.
Four Cubes For Financial Ratio Analysis Powerpoint Template
This business slide displays graphics of four cubes. This PPT slide has been designed to portray concept of financial ratio analysis. Download this PPT slide design to make interactive presentations.

Alphabet Steps For Financial Strategy Analysis Powerpoint Slides
This PowerPoint template has been designed with alphabet steps with icons. This PPT slide may be used to display financial strategy analysis. Make outstanding business presentation with this template.
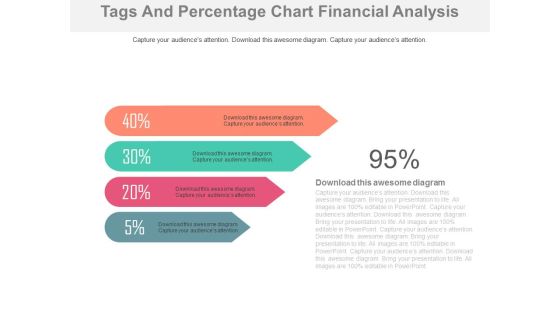
Four Percentage Tags For Financial Analysis Powerpoint Slides
This PowerPoint template contains design of four percentage tags. You may download this PPT slide to display financial analysis. You can easily customize this template to make it more unique as per your need.

Four Steps For Financial Data Analysis Powerpoint Slides
This PowerPoint contains four circles with percentage values. Download this diagram slide to display financial data analysis. This template is editable, You can edit text, color, shade and style of this diagram as per you need.
Banners For Financial Planning And Analysis PowerPoint Template
Visually support your presentation with our above template illustrating diagram of banners. It contains graphics of concepts of financial planning and analysis. Etch your views in the brains of your audience with this diagram slide.
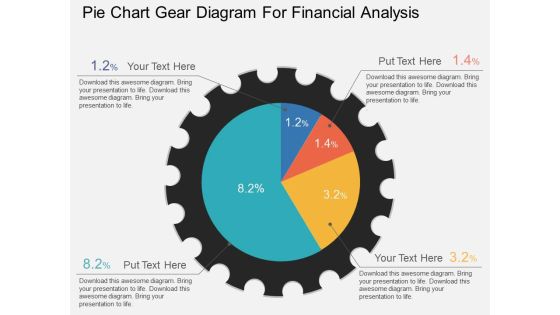
Pie Chart Gear Diagram For Financial Analysis Powerpoint Template
This PowerPoint template has been designed with graphic of pie chart gear diagram. This PPT slide can be used to display financial analysis. Download this PPT diagram slide to make your presentations more effective.

Pie Chart For Financial Ratio Analysis PowerPoint Templates
Create visually amazing presentations with this slide of pie chart. This PPT slide of pie chart for financial ratio analysis. Add this diagram in your presentations to visually support your content.

Data Driven Comparison Charts For Analysis Powerpoint Slides
You can download this PowerPoint template to display statistical data and analysis. This PPT slide contains data driven comparison charts. Draw an innovative business idea using this professional diagram.
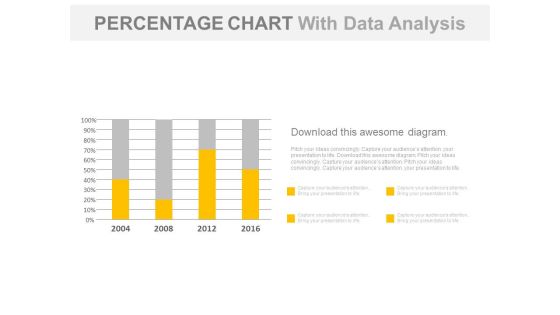
Year Based Chart With Percentage Data Analysis Powerpoint Slides
Our above business slide contains year based statistical chart. This PowerPoint template can be used to display percentage data analysis. Capture the attention of your audience with this slide.

Circle Chart With Percentage Value Analysis Powerpoint Slides
This PowerPoint template has been designed with circular process diagram. This business diagram helps to exhibit financial process control and analysis. Use this diagram to visually support your content.

Bar Graph For Year Based Analysis Powerpoint Slides
This PowerPoint template has been designed with year based bar graph. This diagram may be used to display yearly statistical analysis. Use this PPT slide design to make impressive presentations.

Bar Graph For Yearly Statistical Analysis Powerpoint Slides
This PowerPoint template has been designed with bar graph. This PowerPoint diagram is useful to exhibit yearly statistical analysis. This diagram slide can be used to make impressive presentations.
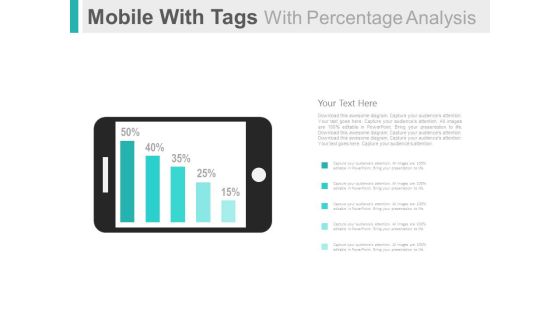
Mobile For Online Survey And Analysis Powerpoint Slides
This PowerPoint template has been designed with graphics of mobile and percentage bar graph. This PPT slide can be used to display online survey and analysis. You can download finance PowerPoint template to prepare awesome presentations.
Four Cubes For Fnancial Ratio Analysis Powerpoint Template
This business slide displays graphics of four cubes. This PPT slide has been designed to portray concept of financial ratio analysis. Download this PPT slide design to make interactive presentations.

Test Tubes And Beaker For Ratio Analysis Powerpoint Template
Visually support your presentation with our above template containing diagram of test tubes and beaker. This diagram is excellent visual tools for explaining ratio analysis. Use this diagram to make interactive presentations.

Bar Graph With Yearly Statistical Analysis Powerpoint Slides
This PowerPoint template contains diagram of bar graph with yearly percentage ratios. You may download this slide to display statistical analysis. You can easily customize this template to make it more unique as per your need.
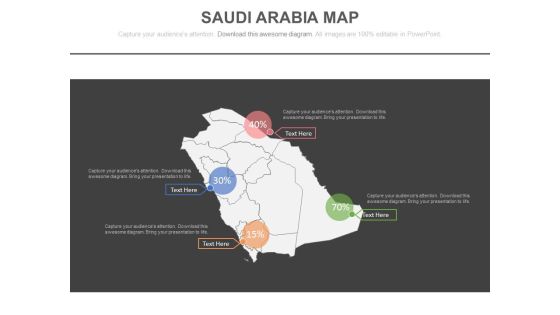
Saudi Arabia Map For Financial Strategy Analysis Powerpoint Slides
This PowerPoint template has been designed with Saudi Arabia Map. You may use this slide to display financial strategy analysis. This diagram provides an effective way of displaying information you can edit text, color, shade and style as per you need.
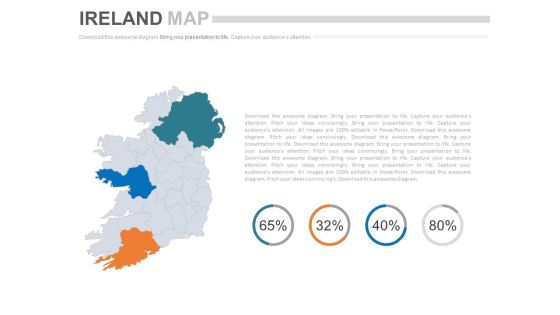
Ireland Map With Financial Ratio Analysis Powerpoint Slides
This PowerPoint template has been designed with Ireland Map and areas highlighted. You may use this slide to display financial strategy analysis. This diagram provides an effective way of displaying information you can edit text, color, shade and style as per you need.
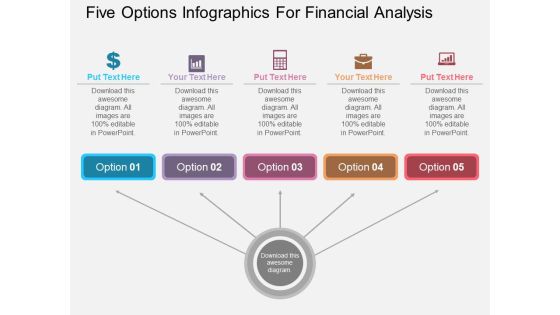
Five Options Infographics For Financial Analysis Powerpoint Template
Visually support your presentation with our above template showing five options infographic. This slide has been professionally designed to present money and finance management. This template offers an excellent background to build impressive presentation.

Dashboard Diagram For Finance And Strategic Analysis Powerpoint Slides
This PowerPoint template display graphics of clock with arrows around it and dollar symbol in center. You may use this PPT slide for financial and strategic analysis. This dashboard slide may useful for multilevel status report creation and approval process.

Retirement Income Analysis Ppt PowerPoint Presentation Complete Deck With Slides
This complete presentation has PPT slides on wide range of topics highlighting the core areas of your business needs. It has professionally designed templates with relevant visuals and subject driven content. This presentation deck has total of fifty seven slides. Get access to the customizable templates. Our designers have created editable templates for your convenience. You can edit the colour, text and font size as per your need. You can add or delete the content if required. You are just a click to away to have this ready made presentation. Click the download button now.

Industry Analysis To Understand Business Position Among Competitors Diagrams PDF
This slide provides overview of industry analysis, evaluating business culture of competitors to understand business position among relative participants in market. It includes key components such as employee retention rate, recruitment cost, employee satisfaction rate and employee turnover rate. great for business strategies, office conferences, capital raising or task suggestions. If you desire to acquire more customers for your tech business and ensure they stay satisfied, create your own sales presentation with these plain slides.
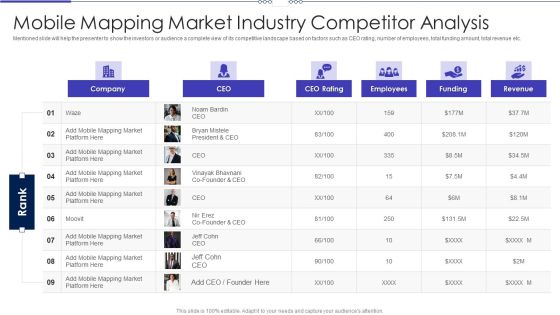
Mobile Designing Market Industry Venture Capital Mobile Mapping Market Industry Competitor Analysis Elements PDF
Mentioned slide will help the presenter to show the investors or audience a complete view of its competitive landscape based on factors such as CEO rating, number of employees, total funding amount, total revenue etc. Deliver an awe inspiring pitch with this creative mobile designing market industry venture capital mobile mapping market industry competitor analysis elements pdf bundle. Topics like revenue, funding, employees, ceo rating can be discussed with this completely editable template. It is available for immediate download depending on the needs and requirements of the user.

Bank Bar Graph Business Deal Result Analysis Ppt Slides Graphics
This power point icon slide has been designed with four different icons. Icons of bank, bar graph and business deal have been displayed in this slide. Use these icons in your presentations to add professional impact.

Four Dollar Value Financial Tags For Analysis Powerpoint Slides
This PowerPoint template has been designed with dollar value financial tags. This PPT slide may be used for sample marketing proposal. Download this slide to build unique presentation.
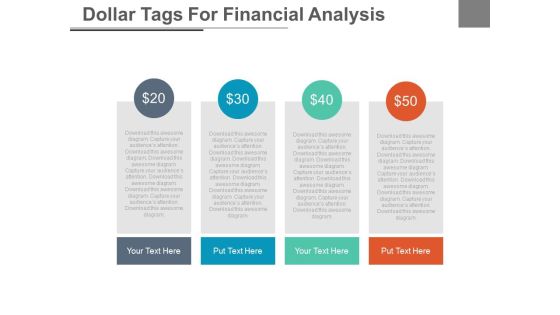
Four Tags With Dollar Values For Financial Analysis Powerpoint Slides
This PowerPoint template has been designed with dollar value pricing table chart. This PPT slide may be used for sample marketing proposal. Download this slide to build unique presentation.
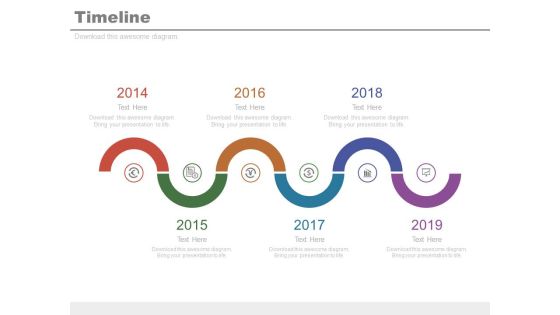
Six Staged Spiral Timeline For Financial Analysis Powerpoint Slides
This infographic template contains graphics of six staged spiral timeline diagram. This PPT slide may be helpful to display financial strategy timeline. Download this PowerPoint timeline template to make impressive presentations.

Puzzle Pie Chart With Team For Financial Analysis Powerpoint Slides
This PPT slide contains graphics of puzzle pie chart with team icons. You may use this PowerPoint template to display team strategy and success. Download this professional slide design to deliver amazing presentations.
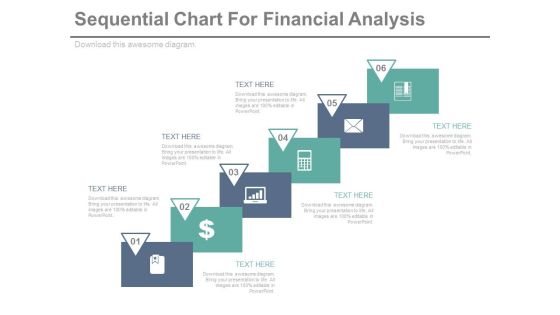
Sequential Steps Chart For Data Analysis Powerpoint Slides
This PowerPoint template has been designed sequential steps chart with icons. This PPT slide can be used to display corporate level financial strategy. You can download finance PowerPoint template to prepare awesome presentations.

Tablet With Charts For Business Analysis Powerpoint Templates
Our compelling template consists with a design of four gear tags and icons. This slide has been professionally designed to exhibit process control. This template offers an excellent background to build impressive presentation.
Progressive Arrows With Icons For Growth Analysis Powerpoint Slides
This PowerPoint template has been designed with diagram of progressive arrows with icons. The PowerPoint template has a high quality design. You can download this PowerPoint slide for corporate presentations or annual meeting and business plans.

Bar Graph With Line Chart For Analysis Powerpoint Slides
This PowerPoint template contains design of bar graph with line chart. You may download this slide to display strategy steps for business growth. You can easily customize this template to make it more unique as per your need.
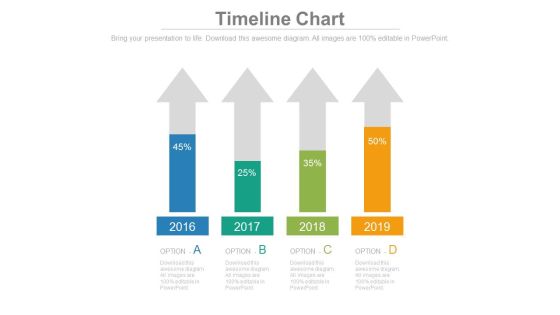
Four Arrows With Percentage Data Analysis Powerpoint Slides
This timeline template can be used for multiple purposes including financial planning, new milestones and tasks. It contains four upward arrows with percentage values. Download this PowerPoint timeline template to make impressive presentations.
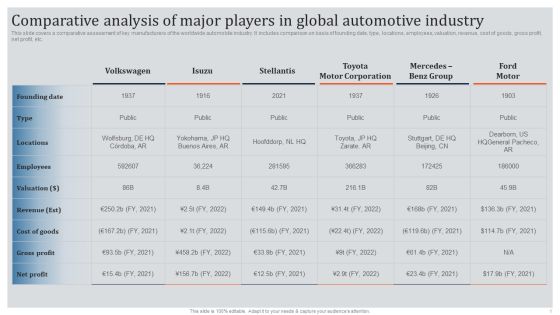
Global Automotive Industry Research And Analysis Comparative Analysis Of Major Players In Global Automotive Industry Designs PDF
This slide covers a comparative assessment of key manufacturers of the worldwide automobile industry. It includes comparison on basis of founding date, type, locations, employees, valuation, revenue, cost of goods, gross profit, net profit, etc. Boost your pitch with our creative Global Automotive Industry Research And Analysis Comparative Analysis Of Major Players In Global Automotive Industry Designs PDF. Deliver an awe inspiring pitch that will mesmerize everyone. Using these presentation templates you will surely catch everyones attention. You can browse the ppts collection on our website. We have researchers who are experts at creating the right content for the templates. So you do not have to invest time in any additional work. Just grab the template now and use them.
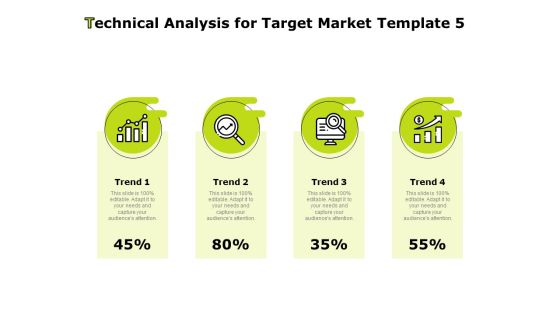
Target Market Tips Based On Technical Analysis Technical Analysis For Target Market Trend Ppt Pictures Clipart PDF
This is a target market tips based on technical analysis technical analysis for target market trend ppt pictures clipart pdf template with various stages. Focus and dispense information on four stages using this creative set, that comes with editable features. It contains large content boxes to add your information on topics like technical analysis for target market. You can also showcase facts, figures, and other relevant content using this PPT layout. Grab it now.
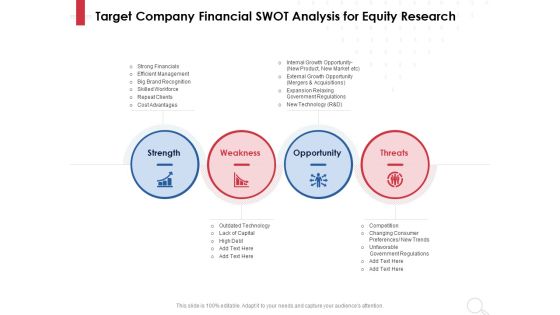
Equity Analysis Project Target Company Financial SWOT Analysis For Equity Research Ppt PowerPoint Presentation Model Designs Download PDF
Presenting this set of slides with name equity analysis project target company financial swot analysis for equity research ppt powerpoint presentation model designs download pdf. This is a four stage process. The stages in this process are strength, weakness, opportunity, threats, technology . This is a completely editable PowerPoint presentation and is available for immediate download. Download now and impress your audience.

Information Analysis And BI Playbook How To Overcome Automated Data Analysis Powered By Ml Challenges Clipart PDF
This template illustrates that automated discovery of insights utilizes machine learning algorithms to analyze billions of data points in seconds to perform complex segmentation, anomaly detection, and trend-based analysis without coding. Make sure to capture your audiences attention in your business displays with our gratis customizable Information Analysis And BI Playbook How To Overcome Automated Data Analysis Powered By Ml Challenges Clipart PDF. These are great for business strategies, office conferences, capital raising or task suggestions. If you desire to acquire more customers for your tech business and ensure they stay satisfied, create your own sales presentation with these plain slides.

Build Effective Business Strategy For Financial Development Monthly Break Even Analysis Point Mockup PDF
This slide shows the monthly break even analysis point which covers monthly units break even, monthly revenue break even, average per unit, etc. Deliver an awe inspiring pitch with this creative build effective business strategy for financial development monthly break even analysis point mockup pdf bundle. Topics like monthly break even analysis point can be discussed with this completely editable template. It is available for immediate download depending on the needs and requirements of the user.

Corporate Strategy For Business Development Monthly Break Even Analysis Point Ideas PDF
This slide shows the monthly break-even analysis point which covers monthly units break even, monthly revenue break-even, average per unit, etc. Deliver and pitch your topic in the best possible manner with this corporate strategy for business development monthly break even analysis point ideas pdf. Use them to share invaluable insights on monthly break even analysis point and impress your audience. This template can be altered and modified as per your expectations. So, grab it now.
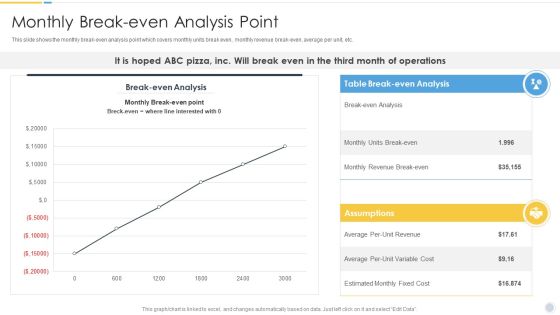
Growth Strategy For Startup Company Monthly Break Even Analysis Point Demonstration PDF
This slide shows the monthly break-even analysis point which covers monthly units break even, monthly revenue break-even, average per unit, etc. Deliver an awe inspiring pitch with this creative Growth Strategy For Startup Company Monthly Break Even Analysis Point Demonstration PDF bundle. Topics like Analysis, Assumptions, Estimated Monthly Fixed Cost, Average Per Unit Variable Cost can be discussed with this completely editable template. It is available for immediate download depending on the needs and requirements of the user.

Low Penetration Of Insurance Policies In Rural Areas Case Competition Post It Notes Profitability Analysis Microsoft PDF
This slide shows the profitability analysis after implementing the strategy which includes revenue after implementation, total cost, profit etc . Deliver an awe-inspiring pitch with this creative low penetration of insurance policies in rural areas case competition post it notes profitability analysis microsoft pdf. bundle. Topics like additional revenue, total cost, profit, additional policies sold can be discussed with this completely editable template. It is available for immediate download depending on the needs and requirements of the user.

Call Center Application Market Industry Contact Center Software Market Competitive Analysis Introduction PDF
Mentioned slide will help the presenter to show the investors or audience a complete view of its competitive landscape based on factors such as CEO rating, number of employees, total funding amount, total revenue etc. Deliver an awe inspiring pitch with this creative call center application market industry contact center software market competitive analysis introduction pdf bundle. Topics like employee, revenue, company can be discussed with this completely editable template. It is available for immediate download depending on the needs and requirements of the user.

SWOT Analysis Of IBN Outsourcing Company Weaknesses Ppt Show Deck PDF
This slide shows the weaknesses of IBN Outsourcing Company that it must overcome such as High Customer Attrition Rate , Fall in Company Revenue, Lack of Foreign Languages etc. This is a SWOT Analysis Of IBN Outsourcing Company Weaknesses Ppt Show Deck PDF template with various stages. Focus and dispense information on four stages using this creative set, that comes with editable features. It contains large content boxes to add your information on topics like customer attrition rate, technology, revenue and lack of latest technological softwares, weakness, outdated software programs. You can also showcase facts, figures, and other relevant content using this PPT layout. Grab it now.
