Revenue Analysis

Marketing Data Analysis 3d Statistical Process Control Chart PowerPoint Templates
Open Up Doors That Lead To Success. Our marketing data analysis 3d statistical process control chart Powerpoint Templates Provide The Handles.
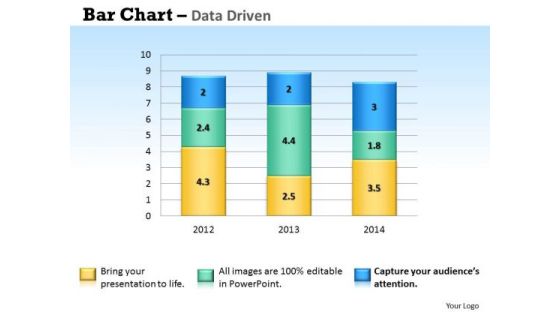
Microsoft Excel Data Analysis Bar Chart To Handle PowerPoint Templates
Our microsoft excel data analysis bar chart to handle Powerpoint Templates And Your Ideas Make A Great Doubles Pair. Play The Net With Assured Hands.

Microsoft Excel Data Analysis Bar Graph PowerPoint Templates
Double The Impact With Our microsoft excel data analysis bar graph Powerpoint Templates . Your Thoughts Will Have An Imposing Effect.
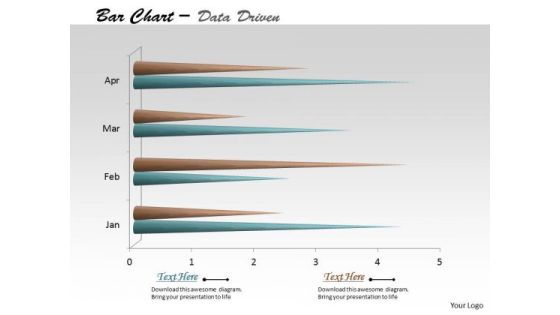
Multivariate Data Analysis Time Based Bar Chart PowerPoint Templates
Edit Your Work With Our multivariate data analysis time based bar chart Powerpoint Templates . They Will Help You Give The Final Form.
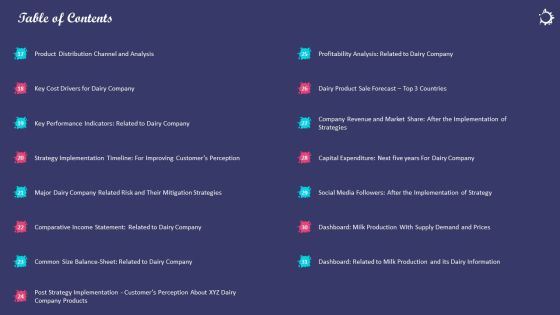
Enhancing Consumers Perception Towards Table Of Contents Analysis Topics PDF
Deliver an awe inspiring pitch with this creative enhancing consumers perception towards table of contents analysis topics pdf bundle. Topics like product distribution channel and analysis, key cost drivers for dairy company, profitability analysis related to dairy company, common size balance sheet related to dairy company, comparative income statement related to dairy company can be discussed with this completely editable template. It is available for immediate download depending on the needs and requirements of the user.

SWOT Analysis Of ABC Software Company Threats Structure PDF
This slide shows the Threats related to ABC Software Company which includes Liability Laws, Lawsuits, Shortage of skilled workforce etc. Presenting swot analysis of abc software company threats structure pdf to provide visual cues and insights. Share and navigate important information on five stages that need your due attention. This template can be used to pitch topics like revenues, profitability, quality. In addtion, this PPT design contains high resolution images, graphics, etc, that are easily editable and available for immediate download.

Workforce Annual Analysis Ppt PowerPoint Presentation Complete Deck With Slides
Presenting this set of slides with name Workforce Annual Analysis Ppt PowerPoint Presentation Complete Deck With Slides. The topics discussed in these slides are workforce annual analysis, financial, business, marketing, planning. This is a completely editable PowerPoint presentation and is available for immediate download. Download now and impress your audience.

Medical Care Organization Management And Statistical Analysis Summary PDF
This slide covers the details related to the healthcare company. The purpose of this template is to define the fact sheet used in the healthcare industry. It covers information about mission, vision, key metrics, revenues, etc. Showcasing this set of slides titled Medical Care Organization Management And Statistical Analysis Summary PDF. The topics addressed in these templates are Executive, Chief Medical Officer, Management. All the content presented in this PPT design is completely editable. Download it and make adjustments in color, background, font etc. as per your unique business setting.

Performance Analysis Of Market Development Strategies Information PDF
The following slide outlines key success metrics through which companies can measure the performance of market development strategies. The major key performance indicators KPIs are revenue, market share, new customers acquired, brand reach, and impressions. Find a pre-designed and impeccable Performance Analysis Of Market Development Strategies Information PDF. The templates can ace your presentation without additional effort. You can download these easy-to-edit presentation templates to make your presentation stand out from others. So, what are you waiting for Download the template from Slidegeeks today and give a unique touch to your presentation.

Portative Analysis Bubble Chart Ppt PowerPoint Presentation Slide
This is a portative analysis bubble chart ppt powerpoint presentation slide. This is a six stage process. The stages in this process are portative, analysis, business, graph, bubble chart.
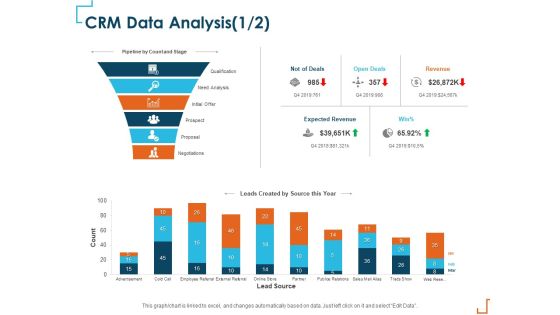
Introducing CRM Framework Within Organization CRM Data Analysis Leads Ppt PowerPoint Presentation Show Background Image PDF
Presenting this set of slides with name introducing crm framework within organization crm data analysis leads ppt powerpoint presentation show background image pdf. The topics discussed in these slides are qualification, need analysis, initial offer, prospect, open deals, revenue, expected revenue. This is a completely editable PowerPoint presentation and is available for immediate download. Download now and impress your audience.

Performance Strategic Analysis Dashboard For Tactical Management Rules PDF
This slide defines the dashboard for analyzing the sales key performance indicators KPIs. It includes information related to the number of sales, revenue, profit, and cost. Showcasing this set of slides titled Performance Strategic Analysis Dashboard For Tactical Management Rules PDF. The topics addressed in these templates are Revenue, New Customers, Average Revenue, Per Customer. All the content presented in this PPT design is completely editable. Download it and make adjustments in color, background, font etc. as per your unique business setting.

Competitive Analysis Scatter Chart Radar Chart Ppt PowerPoint Presentation Infographics
This is a competitive analysis scatter chart radar chart ppt powerpoint presentation infographics. This is a eight stage process. The stages in this process are users interface, data import, example, pricing, support, update, tutorials, easy to use.

Competitive Analysis Scatter Chart Ppt PowerPoint Presentation Samples
This is a competitive analysis scatter chart ppt powerpoint presentation samples. This is a six stage process. The stages in this process are competitive, analysis, business, marketing, management.

Fit Gap Analysis Ppt PowerPoint Presentation File Graphics Tutorials
This is a fit gap analysis ppt powerpoint presentation file graphics tutorials. This is a five stage process. The stages in this process are intellectual, analytical problem solving, innovation, strategic vision, commercial awareness, clear written communication, technological orientation.
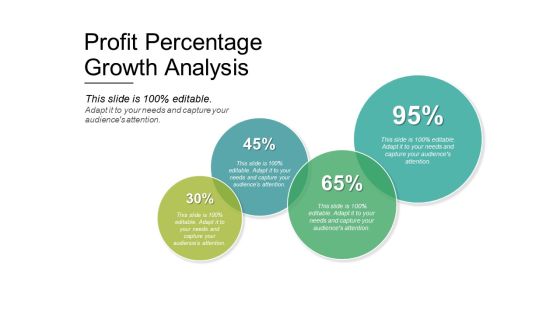
Profit Percentage Growth Analysis Ppt PowerPoint Presentation Layouts Graphics Tutorials
This is a profit percentage growth analysis ppt powerpoint presentation layouts graphics tutorials. This is a four stage process. The stages in this process are comparison chart, comparison table, comparison matrix.

Impact Of Marketing Environmental Analysis Factors On Customers Rules PDF
The slide highlights various marketing environmental forces that influences the decision-making of customers to assess customer habits. Various environmental forces included are economic, cultural, demographic and technological Showcasing this set of slides titled Impact Of Marketing Environmental Analysis Factors On Customers Rules PDF. The topics addressed in these templates are Factors, Impact, Environmental Analysis. All the content presented in this PPT design is completely editable. Download it and make adjustments in color, background, font etc. as per your unique business setting.
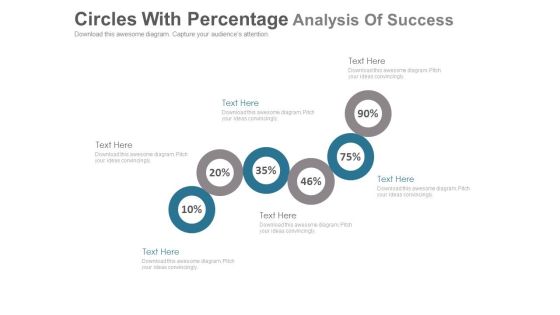
Six Circles For Percentage Value Analysis Powerpoint Slides
This PowerPoint template has been designed with six circles and percentage values. This PPT slide can be used to display financial ratio analysis. You can download finance PowerPoint template to prepare awesome presentations.

Analysis Architecture Indicating Business Impact On Economic Development Background PDF
Pitch your topic with ease and precision using this Analysis Architecture Indicating Business Impact On Economic Development Background PDF. This layout presents information on Profitability Increases, Economy Witnesses, Existing Businesses. It is also available for immediate download and adjustment. So, changes can be made in the color, design, graphics or any other component to create a unique layout.

Enterprise Analysis Profitability Ratios Ppt Summary Design Templates PDF
Deliver and pitch your topic in the best possible manner with this enterprise analysis profitability ratios ppt summary design templates pdf. Use them to share invaluable insights on gross profit ratio, net profit ratio, net sales and impress your audience. This template can be altered and modified as per your expectations. So, grab it now.
Ppt Arrow Practice Process Analysis Diagram 2 Stages PowerPoint Slides
We present our ppt arrow practice process analysis diagram 2 stages PowerPoint Slides.Present our Arrows PowerPoint Templates because Our PowerPoint Templates and Slides are created with admirable insight. Use them and give your group a sense of your logical mind. Download our Business PowerPoint Templates because You should Bet on your luck with our PowerPoint Templates and Slides. Be assured that you will hit the jackpot. Download and present our Leadership PowerPoint Templates because Our PowerPoint Templates and Slides team portray an attitude of elegance. Personify this quality by using them regularly. Use our Sales PowerPoint Templates because Our PowerPoint Templates and Slides team portray an attitude of elegance. Personify this quality by using them regularly. Download and present our Shapes PowerPoint Templates because They will bring a lot to the table. Their alluring flavours will make your audience salivate.Use these PowerPoint slides for presentations relating to business, chart, collaborate, colorful, colors, commerce, concept, data, development, direction, economic, forward, graph, graphics, growing, growth, illustration, improvement, interaction, lead, leadership, line, manage, management, networking, object, organization, organize, performance, race, relation, relationship, resources, results, sales, same, staff, team, together. The prominent colors used in the PowerPoint template are Brown, Yellow, Black. People tell us our ppt arrow practice process analysis diagram 2 stages PowerPoint Slides are designed by professionals People tell us our development PowerPoint templates and PPT Slides effectively help you save your valuable time. Presenters tell us our ppt arrow practice process analysis diagram 2 stages PowerPoint Slides are second to none. We assure you our colors PowerPoint templates and PPT Slides are aesthetically designed to attract attention. We guarantee that they will grab all the eyeballs you need. Presenters tell us our ppt arrow practice process analysis diagram 2 stages PowerPoint Slides are aesthetically designed to attract attention. We guarantee that they will grab all the eyeballs you need. Professionals tell us our data PowerPoint templates and PPT Slides will help you be quick off the draw. Just enter your specific text and see your points hit home.

Current State Analysis Financial Comparison Ppt PowerPoint Presentation Inspiration Good
This is a current state analysis financial comparison ppt powerpoint presentation inspiration good. This is a five stage process. The stages in this process are revenue, profits, cash balance, competitor.

Competitor Analysis Ppt PowerPoint Presentation File Graphics Example
This is a competitor analysis ppt powerpoint presentation file graphics example. This is a four stage process. The stages in this process are revenue, sales development of industry, own company, placeholder, competitor.
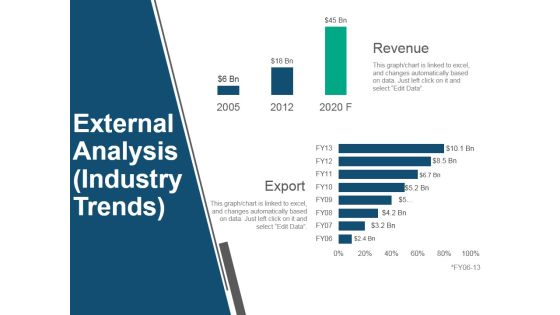
External Analysis Industry Trends Ppt PowerPoint Presentation Inspiration Portfolio
This is a external analysis industry trends ppt powerpoint presentation inspiration portfolio. This is a two stage process. The stages in this process are revenue, export, business, marketing, presentation.

Gap Analysis Graph Ppt PowerPoint Presentation Slides Graphics Pictures
This is a gap analysis graph ppt powerpoint presentation slides graphics pictures. This is a five stage process. The stages in this process are revenue, time, high, low, risk.
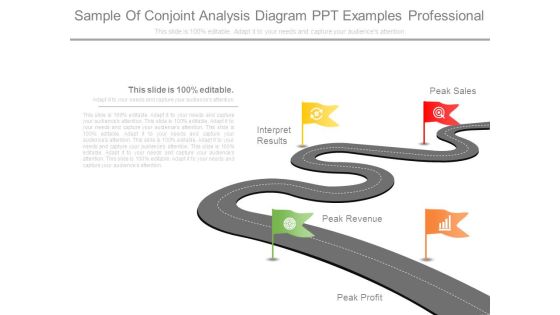
Sample Of Conjoint Analysis Diagram Ppt Examples Professional
This is a sample of conjoint analysis diagram ppt examples professional. This is a four stage process. The stages in this process are peak profit, peak revenue, interpret results, peak sales.

Business Competition Comparison And Analysis Table Powerpoint Slides
This is a business competition comparison and analysis table powerpoint slides. This is a six stage process. The stages in this process are criteria, revenue, profit, market share, main activity, number of employee, product quality, competitor.

Competitor Analysis Comparison Table Ppt PowerPoint Presentation Outline Slides
This is a competitor analysis comparison table ppt powerpoint presentation outline slides. This is a two stage process. The stages in this process are revenue, profit, market share, main activity, number of employee, product quality.

Competitor Analysis Comparison Table Ppt PowerPoint Presentation Infographic Template Graphics
This is a competitor analysis comparison table ppt powerpoint presentation infographic template graphics. This is a seven stage process. The stages in this process are profit, revenue, market share, main activity, criteria.

Competitor Analysis Comparison Table Ppt PowerPoint Presentation Icon Designs Download
This is a competitor analysis comparison table ppt powerpoint presentation icon designs download. This is a seven stage process. The stages in this process are revenue, profit, market share, main activity, number of employee, product quality.

Competitor Analysis Comparison Table Ppt PowerPoint Presentation Infographics Design Inspiration
This is a competitor analysis comparison table ppt powerpoint presentation infographics design inspiration. This is a seven stage process. The stages in this process are revenue, profit, market share, main activity.

Competitor Analysis Comparison Table Ppt PowerPoint Presentation Show Grid
This is a competitor analysis comparison table ppt powerpoint presentation show grid. This is a seven stage process. The stages in this process are revenue, profit, market share, main activity, number of employee.

Competitor Analysis Ppt PowerPoint Presentation Pictures Designs Download
This is a competitor analysis ppt powerpoint presentation pictures designs download. This is a six stage process. The stages in this process are revenue, profit, market share, main activity, number of employee, product quality.

Break Even Analysis Ppt PowerPoint Presentation Layouts Portrait
This is a break even analysis ppt powerpoint presentation layouts portrait. This is a six stage process. The stages in this process are key comments on the table, units of output, total cost, sales revenue, profit.

Competitor Analysis Ppt PowerPoint Presentation Layouts Background Image
This is a competitor analysis ppt powerpoint presentation layouts background image. This is a five stage process. The stages in this process are profit, revenue, market share, main activity, number of employee, product quality.

Quarterly Budget Analysis Ppt PowerPoint Presentation Outline Background Image
This is a quarterly budget analysis ppt powerpoint presentation outline background image. This is a two stage process. The stages in this process are budget, this quarter, sales revenue, cost of sales, gross profits.

Data Collection And Analysis Control Chart Ppt PowerPoint Presentation Visuals
This is a data collection and analysis control chart ppt powerpoint presentation visuals. This is a ten stage process. The stages in this process are upper limit, centerline, lower limit, plotted points.

Break Even Analysis Ppt PowerPoint Presentation Model Portfolio
This is a break even analysis ppt powerpoint presentation model portfolio. This is a five stage process. The stages in this process are fixed cost, variable cost, total cost, sales revenue.

Break Even Analysis Ppt Powerpoint Presentation Show Maker
This is a break even analysis ppt powerpoint presentation show maker. This is a two stage process. The stages in this process are total revenue, total costs, break even volume.

Break Even Analysis Ppt PowerPoint Presentation Inspiration Microsoft
This is a break even analysis ppt powerpoint presentation inspiration microsoft. This is a five stage process. The stages in this process are fixed cost, variable cost, total cost, sales revenue.

Break Even Analysis Ppt PowerPoint Presentation Summary Background Designs
This is a break even analysis ppt powerpoint presentation summary background designs. This is a five stage process. The stages in this process are units of output, fixed cost, variable cost, total cost, sales revenue.

Break Even Analysis Ppt PowerPoint Presentation Inspiration Layouts
This is a break even analysis ppt powerpoint presentation inspiration layouts. This is a three stage process. The stages in this process are total revenue, total costs, variable cost, fixed costs, units sold.

Break Even Analysis Ppt PowerPoint Presentation Gallery Master Slide
This is a break even analysis ppt powerpoint presentation gallery master slide. This is a two stage process. The stages in this process are total revenue, total costs, variable cost, fixed costs, units sold.

Break Even Analysis Ppt PowerPoint Presentation Styles Influencers
This is a break even analysis ppt powerpoint presentation styles influencers. This is a five stage process. The stages in this process are units of output, fixed cost, variable cost, total cost, sales revenue.

Break Even Analysis Ppt PowerPoint Presentation Outline Example Topics
This is a break even analysis ppt powerpoint presentation outline example topics. This is a five stage process. The stages in this process are units of output, variable, fixed cost, total cost, sales revenue.

Break Even Analysis Ppt PowerPoint Presentation Portfolio Graphics Design
This is a break even analysis ppt powerpoint presentation portfolio graphics design. This is a five stage process. The stages in this process are units of output, fixed cost, variable cost, total cost, sales revenue.

Break Even Analysis Ppt PowerPoint Presentation Inspiration Example Introduction
This is a break even analysis ppt powerpoint presentation inspiration example introduction. This is a four stage process. The stages in this process are gross revenue, variable expenses, contribution, break even point, pat.

Break Even Analysis Ppt PowerPoint Presentation Model Example File
This is a break even analysis ppt powerpoint presentation model example file. This is a six stage process. The stages in this process are gross revenue, variable expenses, contribution, fixed expenses, break even point.

Break Even Analysis Ppt PowerPoint Presentation Layouts Rules
This is a break even analysis ppt powerpoint presentation layouts rules. This is a six stage process. The stages in this process are gross revenue, variable expenses, contribution, fixed expenses.

Force Field Analysis Template 1 Ppt PowerPoint Presentation Layout
This is a force field analysis template 1 ppt powerpoint presentation layout. This is a two stage process. The stages in this process are equilibrium, higher, present, productivity, lower.

Business And Financial Analysis Ppt PowerPoint Presentation Styles Summary
This is a business and financial analysis ppt powerpoint presentation styles summary. This is a four stage process. The stages in this process are investment, equipment, marketing cost, employee cost, interior cost.

Competitive Analysis Financial Comparison With The Competitors Infographics PDF
This slide shows the competitive analysis of the competitors with various financial comparisons i.e. Total revenue, Total profits, Total number of employees, Total defect claims, etc. Deliver and pitch your topic in the best possible manner with this competitive analysis financial comparison with the competitors infographics pdf. Use them to share invaluable insights on profit, revenue, claims and impress your audience. This template can be altered and modified as per your expectations. So, grab it now.

Retirement Income Analysis Table Of Contents Structure PDF
Deliver an awe inspiring pitch with this creative retirement income analysis table of contents structure pdf bundle. Topics like planning, timeline, competitive landscape, mission, vision can be discussed with this completely editable template. It is available for immediate download depending on the needs and requirements of the user.
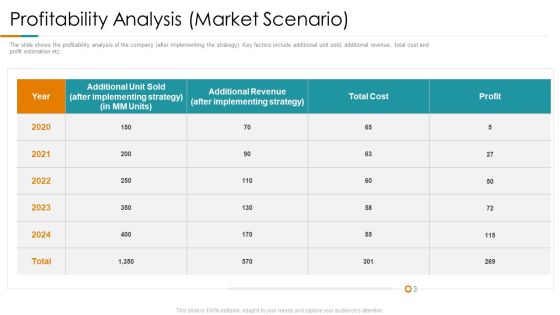
Profitability Analysis Market Scenario Ppt Professional Portfolio PDF
The slide shows the profitability analysis of the company after implementing the strategy. Key factors include additional unit sold, additional revenue, total cost and profit estimation etc. Deliver an awe-inspiring pitch with this creative profitability analysis market scenario ppt professional portfolio pdf. bundle. Topics like total cost, profit, revenue, implementing can be discussed with this completely editable template. It is available for immediate download depending on the needs and requirements of the user.

Customer Analysis Percentage Chart Ppt PowerPoint Presentation Infographics Master Slide
This is a customer analysis percentage chart ppt powerpoint presentation infographics master slide. This is a four stage process. The stages in this process are comparison chart, comparison table, comparison matrix.
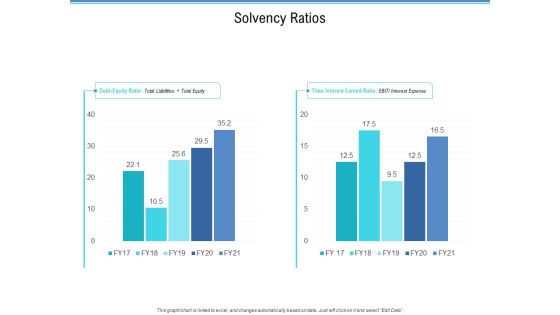
Enterprise Analysis Solvency Ratios Ppt Summary Professional PDF
Deliver and pitch your topic in the best possible manner with this enterprise analysis solvency ratios ppt summary professional pdf. Use them to share invaluable insights on solvency ratios, debt equity ratio, interest expense, time interest earned ratio and impress your audience. This template can be altered and modified as per your expectations. So, grab it now.
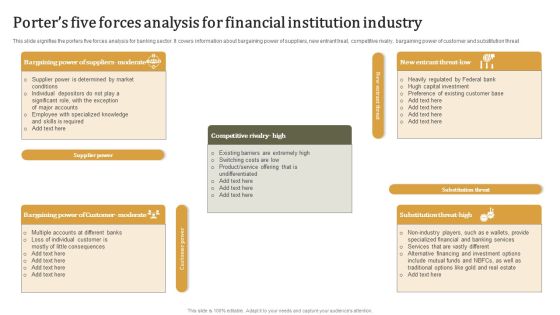
Porters Five Forces Analysis For Financial Institution Industry Pictures PDF
This slide signifies the porters five forces analysis for banking sector. It covers information about bargaining power of suppliers, new entrant treat, competitive rivalry, bargaining power of customer and substitution threat. Showcasing this set of slides titled Porters Five Forces Analysis For Financial Institution Industry Pictures PDF. The topics addressed in these templates are Customer Power, Supplier Power. All the content presented in this PPT design is completely editable. Download it and make adjustments in color, background, font etc. as per your unique business setting.

Business Insurance Business Analysis Method Ppt Portfolio Graphics Example PDF
Presenting business insurance business analysis method ppt portfolio graphics example pdf to provide visual cues and insights. Share and navigate important information on five stages that need your due attention. This template can be used to pitch topics like business, organization, revenues, securing. In addtion, this PPT design contains high resolution images, graphics, etc, that are easily editable and available for immediate download.

Bpm Market Analysis Timeline Ppt PowerPoint Presentation Tips
This is a bpm market analysis timeline ppt powerpoint presentation tips. This is a five stage process. The stages in this process are growth, analysis, strategy, market, timeline.

Marketing Environmental Analysis Scanning For Beverage Company Microsoft PDF
The slide carries a PESTEL analysis for scanning the environment of a beverage company to take the necessary actions. Various factors included are political, economic, social, technological, legal and environmental Pitch your topic with ease and precision using this Marketing Environmental Analysis Scanning For Beverage Company Microsoft PDF. This layout presents information on Environmental, Political, Technological . It is also available for immediate download and adjustment. So, changes can be made in the color, design, graphics or any other component to create a unique layout.

 Home
Home