Results
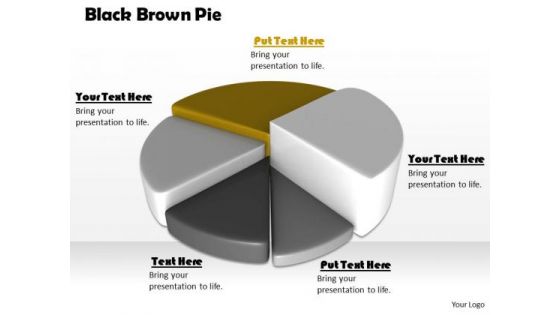
Stock Photo Black Brown Pie Chart For Business Result PowerPoint Slide
This high quality image is designed with pie chart. Use this image to make business reports. Use this outstanding image in presentations relating to data analysis and reports. Go ahead and add charm to your presentations.
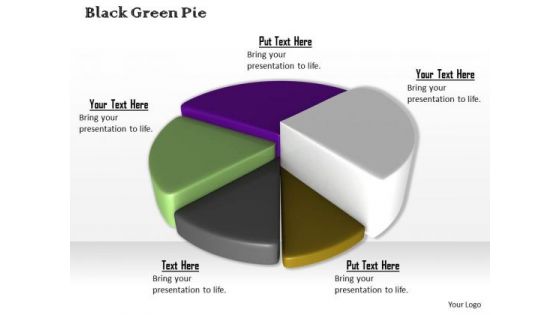
Stock Photo Colorful 3d Pie Chart For Business Result PowerPoint Slide
This high quality image is designed with pie chart. Use this image to make business reports. Use this outstanding image in presentations relating to data analysis and reports. Go ahead and add charm to your presentations.

Stock Photo Colorful Bar Graph For Business Result Display PowerPoint Slide
This image slide displays bar graph. This image has been designed with graphic of 3d multicolor bar graph of solid cylinder shape. Use this image slide, in your presentations to express views on finance, growth and success. This image slide may also be used to exhibit any information which requires visual presentation in your presentations. This image slide will enhance the quality of your presentations.

Stock Photo Green 3d Pie Chart For Result Analysis PowerPoint Slide
Develop competitive advantage with this image which contains 3d pie chart with five steps. Use this image to define steps of business process with this image of pie chart. This image is an excellent tool to give an ideal presentation.
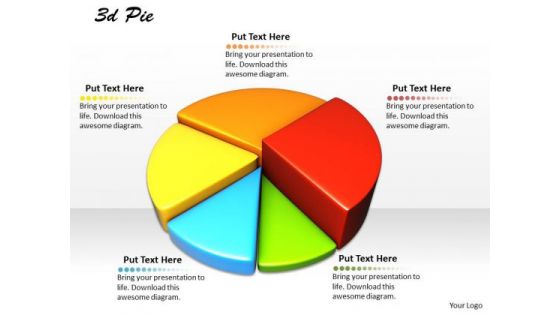
Stock Photo Multicolor Pie Chart For Business Result Analysis PowerPoint Slide
Develop competitive advantage with this image which contains 3d pie chart with five steps. Use this image to define steps of business process with this image of pie chart. This image is an excellent tool to give an ideal presentation.
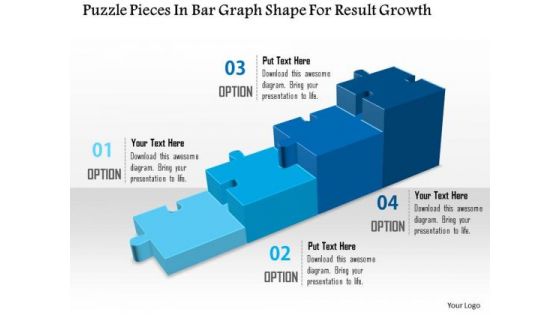
Puzzle Pieces In Bar Graph Shape For Result Growth Presentation Template
Define the growth factor for any business and sales activity with this unique PPT. this PPT has been crafted with graphic of bar graph made with puzzle pieces. Use this PPT for your business and sales presentations.

Business Diagram 3d Graphic Colored Bar Graph For Business Result Analysis Presentation Template
This Power Point template has been designed with graphic of 3d graphic and colored bar graph. Use this slide to represent six steps of any business process. Use this diagram for your business presentations and get exclusive comments on your efforts.
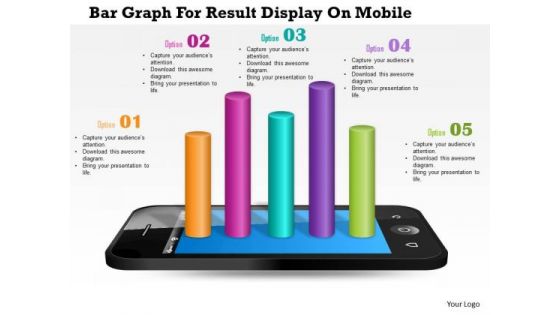
Business Diagram Bar Graph For Result Display On Mobile Presentation Template
This Power Point template has been designed with graphic of bar graph on mobile phone. This business diagram can be used to make business reports. Download this Power Point slide to build quality presentation for your viewers.
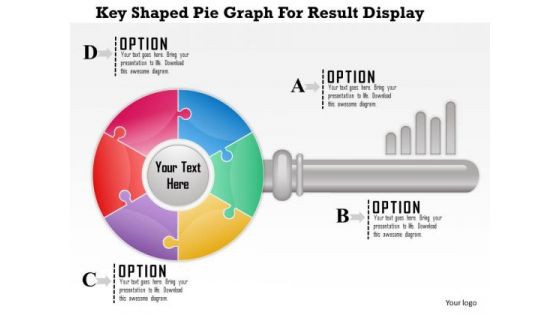
Business Diagram Key Shaped Pie Graph For Result Display Presentation Template
Key shaped pie graph has been used to design this business diagram. This slide has key graphic with abcd options. Use this amazing slide to present a business plan. Download this slide to impress your viewers.

Business Diagram Nine Staged Pie Graph For Business Result Analysis Presentation Template
This business slide displays nine staged pie chart. This diagram is a data visualization tool that gives you a simple way to present statistical information. This slide helps your audience examine and interpret the data you present.
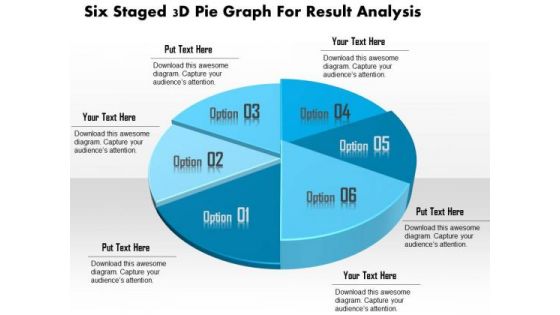
Business Diagram Six Staged 3d Pie Graph For Result Analysis Presentation Template
This business slide displays six staged pie chart. This diagram is a data visualization tool that gives you a simple way to present statistical information. This slide helps your audience examine and interpret the data you present.
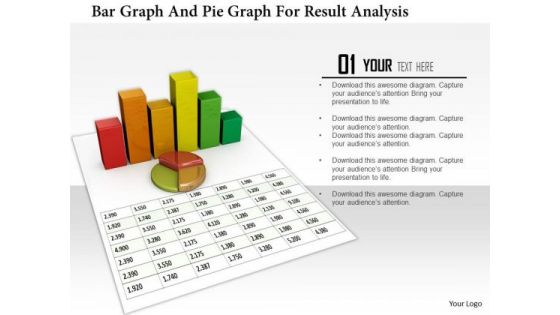
Stock Photo Bar Graph And Pie Graph For Result Analysis PowerPoint Slide
3D business graphs have been used to design this PowerPoint template. This Image slide is suitable to make business reports and charts. This slide can be used for business and marketing presentations.

Business Diagram Five Linear Pie Charts For Result Analysis Presentation Template
This business diagram displays graphic of five staged process flow diagram. This PPT slide contains the concept of business data representation. Use this diagram to build professional presentation for your viewers.

Business Diagram 3d Bar Graph For Business Result Analysis Presentation Template
This business slide displays five staged pie chart. This diagram is a data visualization tool that gives you a simple way to present statistical information. This slide helps your audience examine and interpret the data you present.
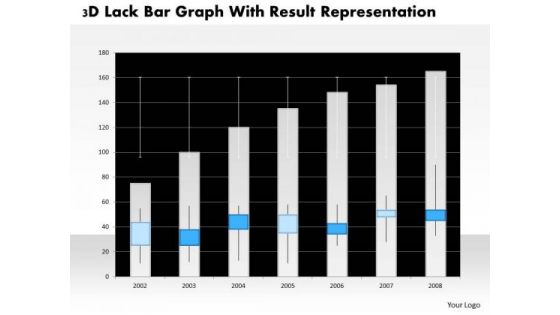
Business Diagram 3d Lack Bar Graph With Result Representation PowerPoint Slide
This business diagram has graphic of 3d lack bar graph. This diagram is a data visualization tool that gives you a simple way to present statistical information. This slide helps your audience examine and interpret the data you present.
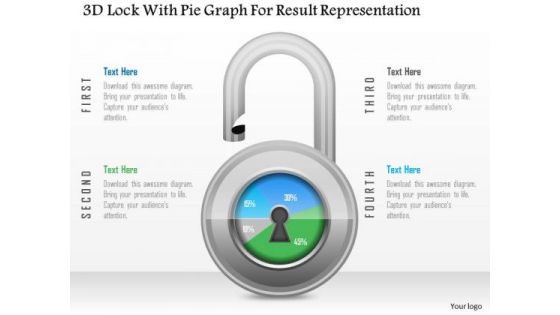
Business Diagram 3d Lock With Pie Graph For Result Representation PowerPoint Slide
This Power Point diagram has been crafted with pie chart in shape of lock. It contains diagram of lock pie chart to compare and present data in an effective manner. Use this diagram to build professional presentations for your viewers.
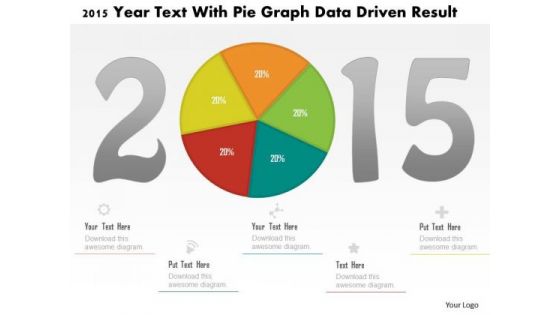
Business Diagram 2015 Year Text With Pie Graph Data Driven Result PowerPoint Slide
This business diagram displays 2015 year numbers with pie chart. This diagram is suitable to display business strategy for year 2015. Download this professional slide to present information in an attractive manner
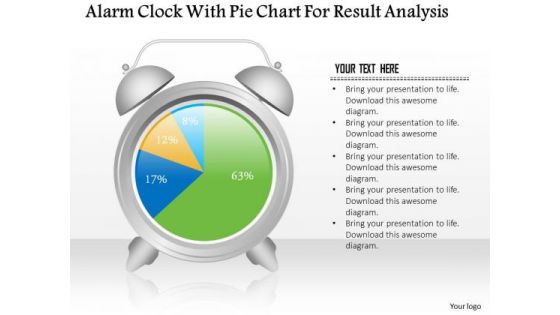
Business Diagram Alarm Clock With Pie Chart For Result Analysis PowerPoint Slide
This business slide displays alarm clock with pie chart. This diagram is a data visualization tool that gives you a simple way to present statistical information. This slide helps your audience examine and interpret the data you present.
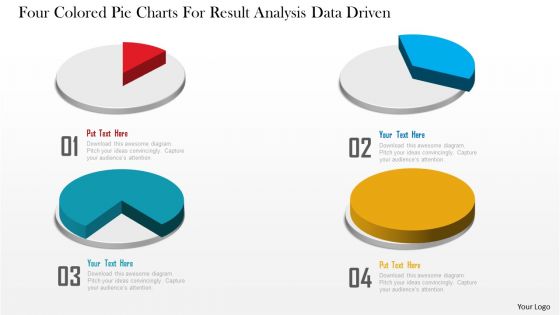
Business Diagram Four Colored Pie Charts For Result Analysis Data Driven PowerPoint Slide
This business diagram displays graphic of pie charts. This business slide is suitable to present and compare business data. Use this diagram to build professional presentations for your viewers.

Business Diagram Four Pie Chart For Data Driven Result Analysis Of Business PowerPoint Slide
This business diagram displays graphic of pie charts in shape of flasks. This business slide is suitable to present and compare business data. Use this diagram to build professional presentations for your viewers.
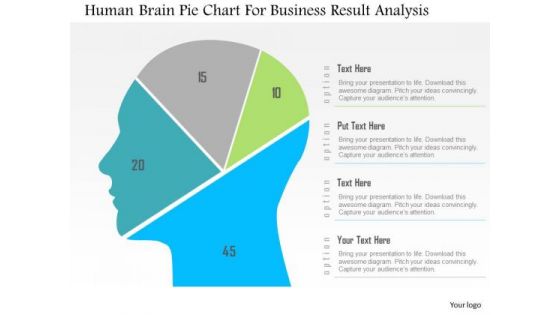
Business Diagram Human Brain Pie Chart For Business Result Analysis PowerPoint Slide
This diagram displays human face graphic divided into sections. This section can be used for data display. Use this diagram to build professional presentations for your viewers.

Business Diagram Tablet With Pie And Business Bar Graph For Result Analysis PowerPoint Slide
This PowerPoint template displays technology gadgets with various business charts. Use this diagram slide, in your presentations to make business reports for statistical analysis. You may use this diagram to impart professional appearance to your presentations.

Business Daigram Six Staged Pie Chart For Business Result Presentation Templets
Six staged pie chart is used to design this business slide. Download this diagram to make business and financial reports. Use our above diagram to express information in a visual way.
Business Diagram Pie Chart With Icons For Result Analysis Presentation Template
This business slide contains graphics of pie chart with business icons. Download this impressive diagram to present marketing performance measurement. This image slide is best to present your newer thoughts.

Strength Opportunities Aspiration And Result Model Ppt PowerPoint Presentation Complete Deck With Slides
This complete presentation has PPT slides on wide range of topics highlighting the core areas of your business needs. It has professionally designed templates with relevant visuals and subject driven content. This presentation deck has total of fifteen slides. Get access to the customizable templates. Our designers have created editable templates for your convenience. You can edit the colour, text and font size as per your need. You can add or delete the content if required. You are just a click to away to have this ready made presentation. Click the download button now.

Business Plan Methods Tools And Templates Set 2 SOAR Strength Opportunities Aspiration And Result Model Clipart PDF
This slide covers SOAR organization analysis model depicting strength opportunities, aspiration, results organization model including questions such as what can we build, what do we care about, what are stakeholders asking for and many more. This is a business plan methods tools and templates set 2 soar strength opportunities aspiration and result model clipart pdf template with various stages. Focus and dispense information on four stages using this creative set, that comes with editable features. It contains large content boxes to add your information on topics like result, aspiration, strengths, opportunities. You can also showcase facts, figures, and other relevant content using this PPT layout. Grab it now.

Human Resource Key Performance Indicators For Manager With Key Result Ppt PowerPoint Presentation File Graphics Tutorials PDF
Pitch your topic with ease and precision using this human resource key performance indicators for manager with key result ppt powerpoint presentation file graphics tutorials pdf. This layout presents information on training, development, performance. It is also available for immediate download and adjustment. So, changes can be made in the color, design, graphics or any other component to create a unique layout.

Collection Of The Resulting Portfolios Powerpoint Slide Designs
This is a collection of the resulting portfolios powerpoint slide designs. This is a five stage process. The stages in this process are presentation 2017.

Negative Outcomes Resulting From Workplace Conflicts Clipart PDF
This slide shows according to the most recent workplace data, the coronavirus pandemic has had a significant impact on workplace patterns. It includes personal insults , resignations, project failure bullying, employees moving to different departments etc. Showcasing this set of slides titled Negative Outcomes Resulting From Workplace Conflicts Clipart PDF. The topics addressed in these templates are Percent Of Employees, Workplace Politics, Employee Satisfaction Ratings. All the content presented in this PPT design is completely editable. Download it and make adjustments in color, background, font etc. as per your unique business setting.
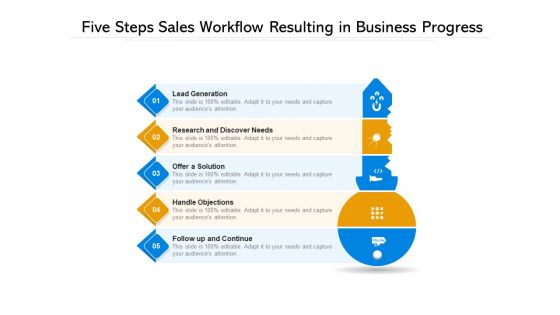
Five Steps Sales Workflow Resulting In Business Progress Ppt PowerPoint Presentation File Examples PDF
Persuade your audience using this five steps sales workflow resulting in business progress ppt powerpoint presentation file examples pdf. This PPT design covers five stages, thus making it a great tool to use. It also caters to a variety of topics including lead generation, research and discover needs, offer a solution. Download this PPT design now to present a convincing pitch that not only emphasizes the topic but also showcases your presentation skills.

Adopting IMC Technique To Boost Brand Recognition How Dominos IMC Strategy Resulted Yoy Growth Summary PDF
The following slide illustrates dominos integrated marketing use case to understand how it achieved year over year growth. It includes elements such as customer data, audiences interests, objectives, challenges, initiatives and outcomes etc. From laying roadmaps to briefing everything in detail, our templates are perfect for you. You can set the stage with your presentation slides. All you have to do is download these easy to edit and customizable templates. Adopting IMC Technique To Boost Brand Recognition How Dominos IMC Strategy Resulted Yoy Growth Summary PDF will help you deliver an outstanding performance that everyone would remember and praise you for. Do download this presentation today.

How Aviation Industry Coping With COVID 19 Pandemic COVID 19 Impact Resulting In Investment Pull Out Ideas PDF
Following slide portrays coronavirus impact resulting in investment pullout. It covers investment about warren buffet selling US airline stakes and also investment pullout of foreign investors from developing Asian countries.Presenting how aviation industry coping with COVID 19 pandemic COVID 19 impact resulting in investment pull out ideas pdf. to provide visual cues and insights. Share and navigate important information on one stage that need your due attention. This template can be used to pitch topics like billionaire value investor, developing asian economies, billion. In addtion, this PPT design contains high resolution images, graphics, etc, that are easily editable and available for immediate download.

Hike In Fuel Prices Resulting Increased Cargo Costs In Transportation Firm Business Case Competition Ppt PowerPoint Presentation Complete Deck
This complete deck acts as a great communication tool. It helps you in conveying your business message with personalized sets of graphics, icons etc. Comprising a set of fortyseven slides, this complete deck can help you persuade your audience. It also induces strategic thinking as it has been thoroughly researched and put together by our experts. Not only is it easily downloadable but also editable. The color, graphics, theme any component can be altered to fit your individual needs. So grab it now.

Arrow Business PowerPoint Template 0910
Results improvement: two arrows pointing up. Digital illustration.
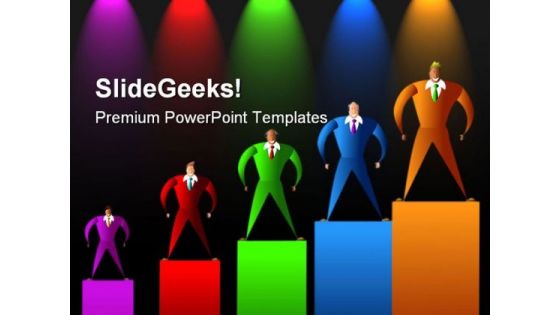
Success Leadership PowerPoint Templates And PowerPoint Backgrounds 0511
Microsoft PowerPoint Template and Background with colourful executives with different sales results

Upward Arrow Abstract Background PowerPoint Templates And PowerPoint Backgrounds 0811
Microsoft PowerPoint Template and Background with results improvement two arrows pointing up

Three Puppets Supporting Leadership PowerPoint Templates And PowerPoint Backgrounds 0811
Microsoft PowerPoint Template and Background with three puppets supporting the diagram showing positive results

Puppets Supporting Business PowerPoint Templates And PowerPoint Backgrounds 0811
Microsoft PowerPoint Template and Background with three puppets supporting the diagram showing positive results

Upward Arrow Abstract Background PowerPoint Themes And PowerPoint Slides 0811
Microsoft PowerPoint Theme and Slide with results improvement two arrows pointing up

Three Puppets Supporting Leadership PowerPoint Themes And PowerPoint Slides 0811
Microsoft PowerPoint Theme and Slide with three puppets supporting the diagram showing positive results

Puppets Supporting Business PowerPoint Themes And PowerPoint Slides 0811
Microsoft PowerPoint Theme and Slide with three puppets supporting the diagram showing positive results
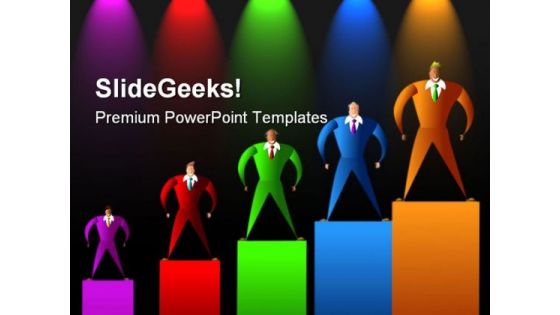
Success Leadership PowerPoint Themes And PowerPoint Slides 0511
Microsoft PowerPoint Theme and Slide with colourful executives with different sales results

Graph01 Business PowerPoint Backgrounds And Templates 1210
Microsoft PowerPoint Template and Background with modern Team satisfied with results - 3d finance graphic behind them
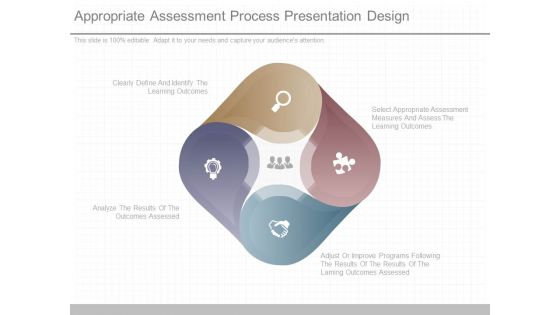
Appropriate Assessment Process Presentation Design
This is a appropriate assessment process presentation design. This is a four stage process. The stages in this process are clearly define and identify the learning outcomes, select appropriate assessment measures and assess the learning outcomes, analyze the results of the outcomes assessed, adjust or improve programs following the results of the results of the laming outcomes assessed.

Jobs Burning People PowerPoint Template 0910
Burning word job as a result of the financial crisis.

Analysis Report Template Presentation Visuals
This is a analysis report template presentation visuals. This is a eight stage process. The stages in this process are analyze result, create action, communication result, survey and scan, interpret result, agree action, follow up, result and report.

Kpis For Customer Satisfaction Survey Outcome Formats PDF
This slide outlines strategies that can help organization to improve the customer service KPIs which are net promoter score, average resolution time, customer satisfaction score and average response time . It also showcases result before and after the implementation of improvement tactics. Persuade your audience using this Kpis For Customer Satisfaction Survey Outcome Formats PDF. This PPT design covers four stages, thus making it a great tool to use. It also caters to a variety of topics including Improvement Strategy, Results Before Implementation, Results After Implementation. Download this PPT design now to present a convincing pitch that not only emphasizes the topic but also showcases your presentation skills.

Good Idea Business PowerPoint Backgrounds And Templates 1210
Microsoft PowerPoint Template and Background with A diagram of a person coming up with an idea working hard to implement it and enjoying the successful results
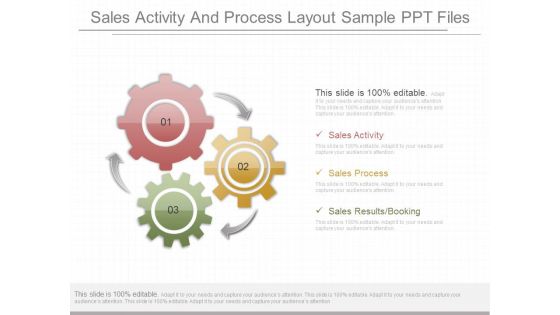
Sales Activity And Process Layout Sample Ppt Files
This is a sales activity and process layout sample ppt files. This is a three stage process. The stages in this sales activity, sales process, sales results booking.
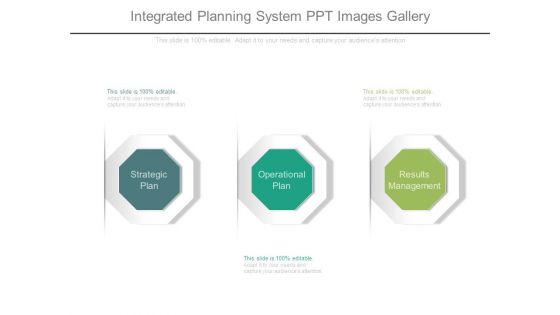
Integrated Planning System Ppt Images Gallery
This is a integrated planning system ppt images gallery. This is a three stage process. The stages in this process are strategic plan, operational plan, results management.

Sales Channel Management Example Ppt Design Templates
This is a sales channel management example ppt design templates. This is a five stage process. The stages in this process are selection, motivation, training, evaluation, results analysis.
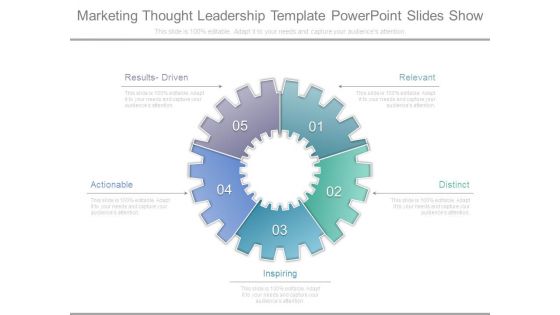
Marketing Thought Leadership Template Powerpoint Slides Show
This is a marketing thought leadership template powerpoint slides show. This is a five stage process. The stages in this process are results driven, actionable, inspiring, distinct, relevant.

Project Closure Ppt PowerPoint Presentation File Display
This is a project closure ppt powerpoint presentation file display. This is a three stage process. The stages in this process are project number, objective achievements, results achievements.
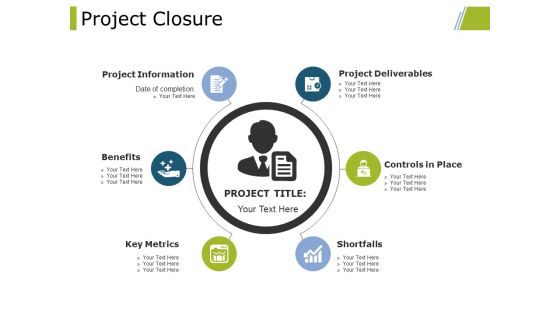
Project Closure Ppt PowerPoint Presentation Professional Graphics Design
This is a project closure ppt powerpoint presentation professional graphics design. This is a two stage process. The stages in this process are objective achievements, results achievements.

How To Acquire Link Equity From Websites Training Ppt
This slide provides an overview of the process to obtain link equity from websites to rank higher in SERPs search engine results pages.
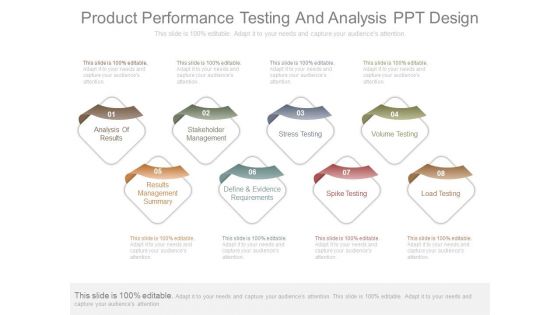
Product Performance Testing And Analysis Ppt Design
This is a product performance testing and analysis ppt design. This is a eight stage process. The stages in this process are analysis of results, stakeholder management, stress testing, volume testing, results management summary, define and evidence requirements, spike testing, load testing.

Students Assessment For Tutoring Service Ppt Model Slideshow PDF
Deliver an awe-inspiring pitch with this creative students assessment for tutoring service ppt model slideshow pdf bundle. Topics like grade level, student, year tested, pre test results, post test results can be discussed with this completely editable template. It is available for immediate download depending on the needs and requirements of the user.

Implement Plans Report Progress Powerpoint Slides Design
This is a implement plans report progress powerpoint slides design. This is a six stage process. The stages in this process are document results share results with partners, implement plans, report progress, prepare data for analysis, prepare data for analysis, adapt plan.
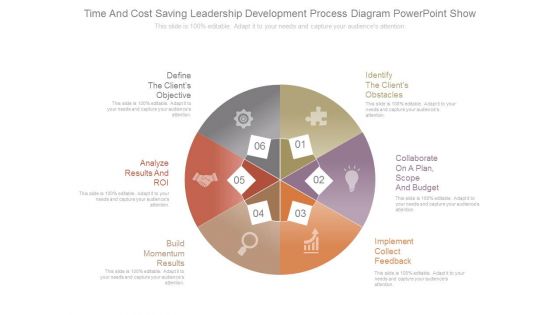
Time And Cost Saving Leadership Development Process Diagram Powerpoint Show
This is a time and cost saving leadership development process diagram powerpoint show. This is a six stage process. The stages in this process are define the clients objective, analyze results and roi, build momentum results, identify the clients obstacles, collaborate on a plan scope and budget, implement collect feedback.
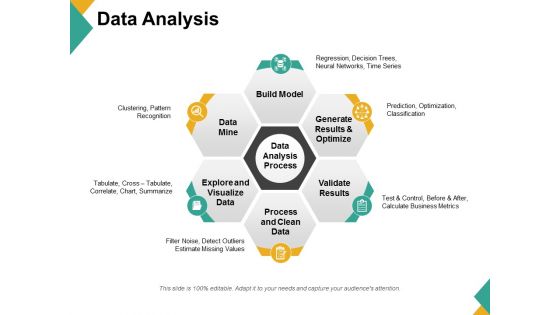
Data Analysis Ppt PowerPoint Presentation Visual Aids Diagrams
This is a data analysis ppt powerpoint presentation visual aids diagrams. This is a six stage process. The stages in this process are build model, generate results and optimize, validate results, process and clean data, explore and visualize data, data mine.

 Home
Home