AI PPT Maker
Templates
PPT Bundles
Design Services
Business PPTs
Business Plan
Management
Strategy
Introduction PPT
Roadmap
Self Introduction
Timelines
Process
Marketing
Agenda
Technology
Medical
Startup Business Plan
Cyber Security
Dashboards
SWOT
Proposals
Education
Pitch Deck
Digital Marketing
KPIs
Project Management
Product Management
Artificial Intelligence
Target Market
Communication
Supply Chain
Google Slides
Research Services
 One Pagers
All Categories
-
Home
- Customer Favorites
- Resources
Resources

Computer Laptop Tablet And Mobile With Percentage Values Powerpoint Slides
This slide which shows a mobile, a tablet and a laptop / TV screen can be perfectly used to demonstrate compatibility of an application or a website on different kind of devices, operating systems and screen sizes. This slide can be used by business and organizations dealing with technology in any manner. The slide can be used to demonstrate the usage experience on different screen sizes. It can be used to demonstrate the number of users of a website or an app or a particular platform. It can also easily depict the ratio of users on the based on their usage patterns and preferences of devise. This can be an effective way to compare one gadget with another. The slide is customizable and can be used with different icons and colors as per the convenience and needs of the user.

Users Comparisons For Communication Devices Powerpoint Slides
This PowerPoint slide is definitely one of our most downloaded templates. This modern slide has been creatively made to depict technology in various forms. This would be best suited to differentiate between users on the basis of their devices, screen size preferences, operating system preferences. This slide can also be used to present the availability of an app or website on multiple operating systems such as android, Ios, Windows etc. and for different screen sizes. The slide has been designed in a manner to depict percentage or ratio of users without the need of any assistance from the presenter. The slide can also be used to demonstrate communication, networking and the use of gadgets.

Five Staged Timeline For Financial Planning Powerpoint Slides
This infographic timeline template can be used for multiple purposes including financial planning, new milestones and tasks. It contains five staged timeline diagram. This PPT slide may be helpful to display financial strategy timeline. Download this PowerPoint timeline template to make impressive presentations.
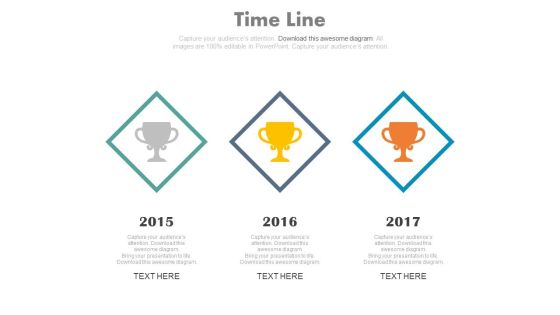
Three Staged Timeline For Success Milestones Powerpoint Slides
This PowerPoint template has been designed with three steps timeline diagram. This timeline template can be used in presentations where you need to display success milestones. You can modify the template like add new milestones and tasks, or change the colors and shapes.
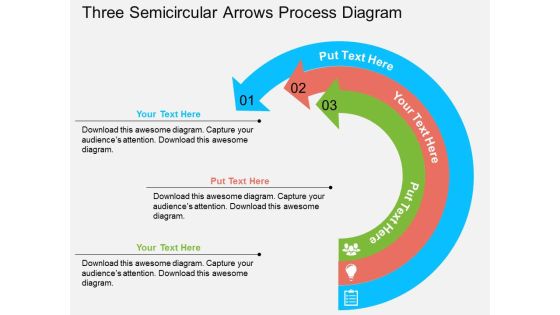
Three Semicircular Arrows Process Diagram Powerpoint Templates
This Power Point template has been designed with three text arrows. This slide contains the concept of massage and communication. Use this slide for business ideas and communication related presentations and to create an impact on your viewers.

Arrow Process Diagram With Business Icons Powerpoint Templates
Download this PPT slide for business and sales growth analysis. This PowerPoint diagram contains design of arrows infographic. Use this slide to make impressive presentations.
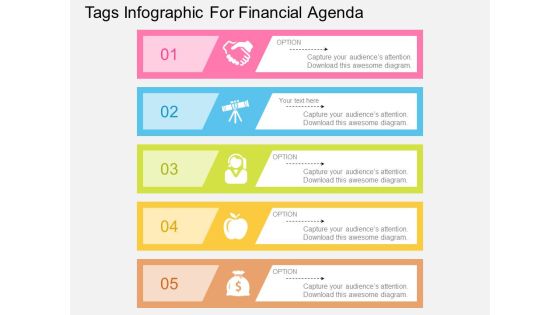
Tags Infographic For Financial Agenda Powerpoint Template
Our professionally designed business diagram is as an effective tool for communicating financial agenda. This PPT slide illustrates text tags infographic. Convey your views with this diagram slide.

Banner Infographic For Business Research Powerpoint Templates
Communicate with your group through this slide of banners. It will facilitate understanding of your views. This diagram can be used to explain the process steps in business presentations.
Four Text Boxes With Icons Powerpoint Templates
This Business diagram can be used to display data, business information etc. You can easily customize this PowerPoint template as per your need. Capture the attention of your audience.

Five Arrows Diagram For Process Flow Powerpoint Slides
This PowerPoint template has been designed with five arrows diagram. The PowerPoint template has a high quality design. You can download this PowerPoint slide for corporate presentations or annual meeting and business plans.

Infographic Diagram For Business Process Powerpoint Slides
This PowerPoint template has been designed for business infographic diagram. The PowerPoint template has a high quality design. You can download this PowerPoint slide for corporate presentations or annual meeting and business plans.
Progressive Arrows With Icons For Growth Analysis Powerpoint Slides
This PowerPoint template has been designed with diagram of progressive arrows with icons. The PowerPoint template has a high quality design. You can download this PowerPoint slide for corporate presentations or annual meeting and business plans.
Tree Diagram For Green Environment Powerpoint Slides
This PowerPoint template has been designed with tree diagram. This PPT slide can be used to prepare presentations on green environment related topics. You can download unique PowerPoint template to prepare awesome presentations.
Zigzag Process Layout With Icons Powerpoint Slides
This PowerPoint template has been designed for zigzag process layout. The PowerPoint template has a high quality design. You can download this PowerPoint slide for corporate presentations or annual meeting and business plans.
Four Circles With Financial Process And Target Icons Powerpoint Template
This PowerPoint template has been designed with four circles and icons. This PowerPoint diagram is suitable to financial process and target. Download this business slide to make impressive presentations.

Six Steps Of Financial Management Powerpoint Templates
This business diagram has been crafted with pencil tags and icons. This slide helps to display five steps of successful strategies for teams. Download this PowerPoint template to build unique presentations.
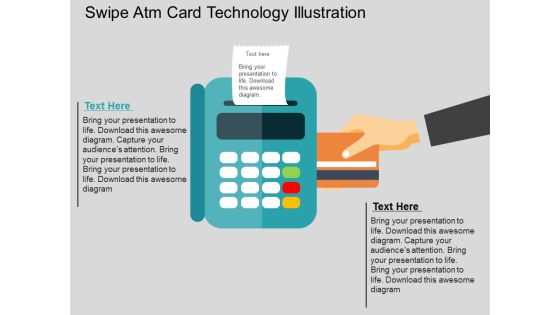
Swipe Atm Card Technology Illustration Powerpoint Templates
You can download this technology slide for topics like technology, internet and communication etc. It contains graphics of four arrows with global technology icons. Capture the attention of your audience using this exclusive template.
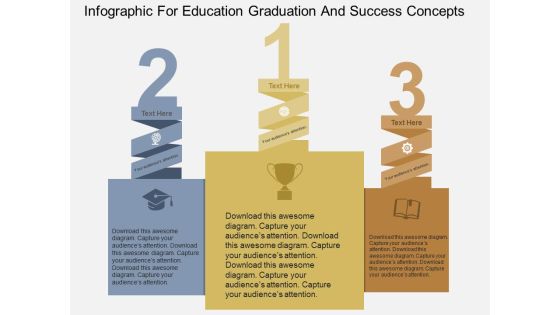
Infographic For Education Graduation And Success Concepts Powerpoint Templates
This business slide contains diagram of winner podium. This PowerPoint template also contains icons of education, graduation and success. Visual effect this diagram helps in maintaining the flow of the discussion and provides more clarity to the subject.
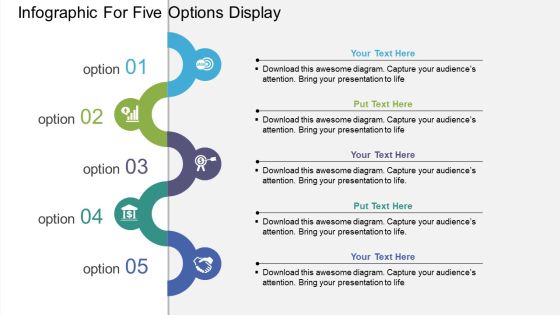
Infographic For Five Options Display Powerpoint Template
Our above business diagram has been designed with infographic of five options. This slide is suitable to present business ideas. Use this business diagram to present your work in a more smart and precise manner.

Pencil Diagram For Multi Tasking Powerpoint Template
This PPT slide has been designed with pencil infographic. This PowerPoint template is designed to display multi tasking. This professional slide helps in making an instant impact on viewers.
Map Of Czech With Percentage Data And Icons Powerpoint Slides
This PowerPoint template displays map of Czech with percentage data and icons. This Map template can be used for annual growth report. This slide can also be used by school students for educational projects.
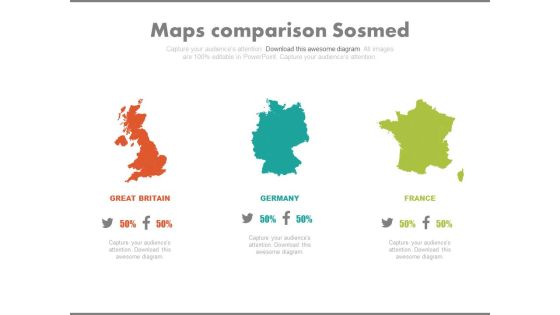
Maps For Great Britain Germany And France Powerpoint Slides
This PowerPoint template displays maps of Great Britain, Germany and France. This Map template can be used for countries comparison. This slide can also be used by school students for educational projects.
World Map With Social Media Icons Powerpoint Slides
This PowerPoint template has been designed with graphics of world map and social media icons. Our professionally designed business diagram is as an effective tool to display social media users in world. Above slide provide ideal backdrop to make business presentations.
Four Options Tags With Icons Powerpoint Template
This business slide contains graphics of four colored banners. You may download this diagram to exhibit marketing strategy. Grab center stage with this slide and capture the attention of your audience.

Four Tags For Financial Analysis Powerpoint Template
This business slide contains graphics of four colored banners. You may download this diagram to exhibit financial analysis. Grab center stage with this slide and capture the attention of your audience.
Five Linear Steps With Financial Icons Powerpoint Slides
This timeline slide design can be used for project planning and project management. It contains five linear steps with financial icons. This timeline template can be used in presentations where you need to display a roadmap or it may be used for financial target analysis.

Bar Graph With Line Chart For Analysis Powerpoint Slides
This PowerPoint template contains design of bar graph with line chart. You may download this slide to display strategy steps for business growth. You can easily customize this template to make it more unique as per your need.

Bar Graph With Yearly Statistical Analysis Powerpoint Slides
This PowerPoint template contains diagram of bar graph with yearly percentage ratios. You may download this slide to display statistical analysis. You can easily customize this template to make it more unique as per your need.

Business Corporate Ecommerce Statistics Powerpoint Slides
This PowerPoint template contains three tags with numeric data. You may download this slide to display business, corporate and ecommerce statistics. You can easily customize this template to make it more unique as per your need.

Computer And Mobile With 100 Percent Satisfaction Powerpoint Slides
This PowerPoint template contains graphics of computer and mobile with 100 percent satisfied text. Download this PPT slide design to display satisfied users of computer and mobile. You can easily customize this template to make it more unique as per your need.
Five Steps Linear Arrows With Icons Powerpoint Slides
This PowerPoint template contains graphics of five step linear arrow. Download this PPT slide design to display workflow or task management. You can easily customize this template to make it more unique as per your need.

Four Plan Options Table Diagram Powerpoint Slides
This PowerPoint template contains graphics of four plan options table. You may PowerPoint template download this display different plans. You can easily customize this template to make it more unique as per your need.
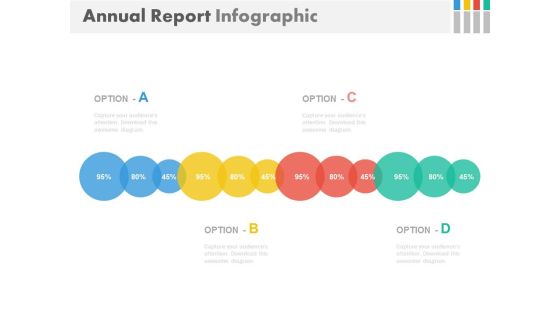
Linear Chart For Annual Business Report Powerpoint Slides
This PowerPoint template contains graphics of linear circle chart. You may download this PPT slide design to display annual business report. You can easily customize this template to make it more unique as per your need.
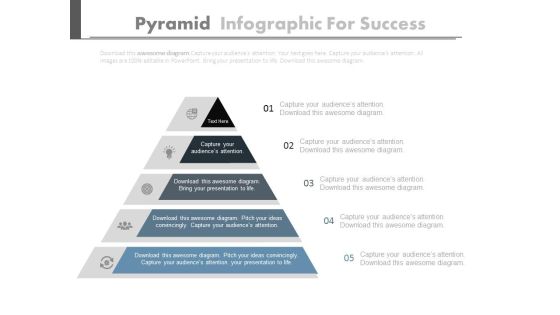
Pyramid Infographics For Marketing Process Powerpoint Slides
This PowerPoint template contains pyramid infographic. You may download this PPT slide design to display steps of marketing process. You can easily customize this template to make it more unique as per your need.
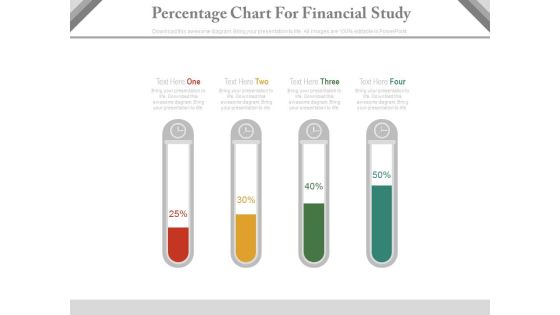
Test Tubes Percentage Chart For Financial Analysis Powerpoint Slides
This PPT slide contains test tubes percentage chart. You may download this PowerPoint template for financial analysis in your presentations. Make outstanding business presentation with this template.

Three Steps Ribbon Diagram For Financial Measurement Powerpoint Slides
This PowerPoint template has been designed with three steps ribbon diagram. This PPT slide may be used to display financial strategy and analysis. Make outstanding business presentation with this template.
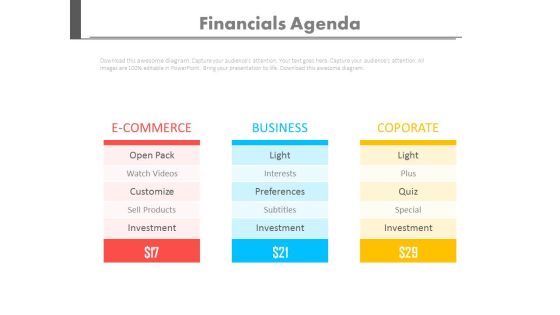
Three Tags For Ecommerce Business And Corporate Concepts Powerpoint Slides
This PowerPoint template contains three tags with numeric data. You may download this slide to display business, corporate and ecommerce statistics. You can easily customize this template to make it more unique as per your need.

Two Table Charts For Business Data Powerpoint Slides
This PowerPoint template contains two tables chart. You may download this PPT slide to display statistical analysis. You can easily customize this template to make it more unique as per your need.
Tree Diagram For Strategic Planning Methods Powerpoint Template
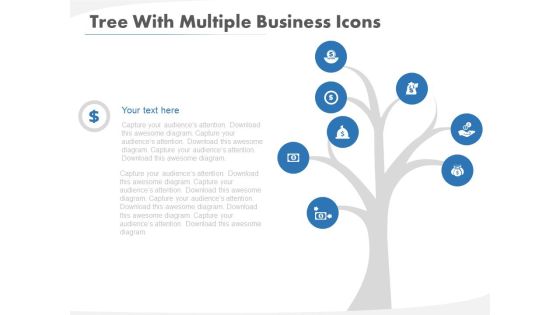
This PowerPoint template has been designed with tree diagram and icons. This diagram slide may be used to depict strategic planning methods. Download this diagram for business research and analysis.

Three Winner Trophies For Success Strategy Powerpoint Template
This PowerPoint template has been designed with three winner trophies. This business slide may be used to display success strategy. Present your views and ideas with this impressive design.
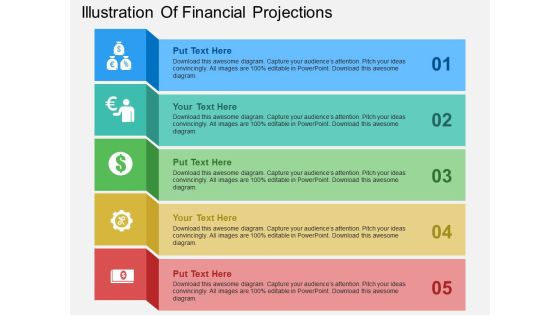
Illustration Of Financial Projections Powerpoint Templates
Visually support your presentation with our above template illustration financial projections. This slide has been professionally designed for business presentations. Deliver amazing presentations to mesmerize your audience.
Infographic Layout Of Four Steps Powerpoint Templates
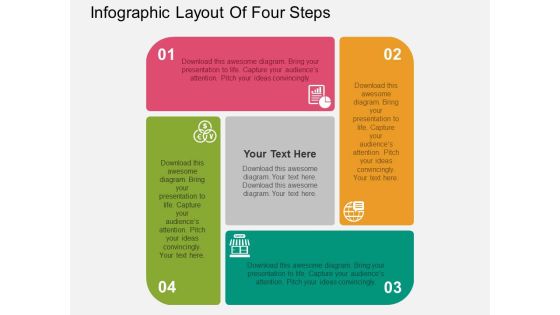
Create dynamic presentations with our professional template containing four text boxes with icons. This diagram is useful to display business information. Download this template to leave permanent impression on your audience.
Pie Chart With Seven Business Icons Powerpoint Templates
Our compelling template consists with a design of pie chart with seven business icons. This slide has been professionally designed to exhibit financial ratio analysis. This template offers an excellent background to build impressive presentation.
Presentation Of Five Concepts With Icons Powerpoint Templates
Visually support your presentation with our above template of infographic layout. This slide has been professionally designed to display text information in visual manner. This template offers an excellent background to build impressive presentation.

Circle Process For Financial Analysis Powerpoint Template
This business slide has been designed with circle diagram of four icons. This diagram has been designed to display financial planning. Develop your marketing strategy and communicate with your team with this professional slide design.
Ireland Map With Financial Ratio Analysis Powerpoint Slides
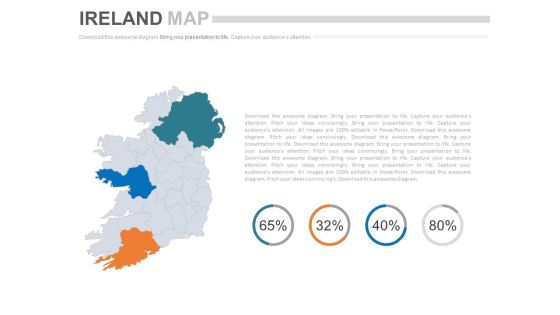
This PowerPoint template has been designed with Ireland Map and areas highlighted. You may use this slide to display financial strategy analysis. This diagram provides an effective way of displaying information you can edit text, color, shade and style as per you need.
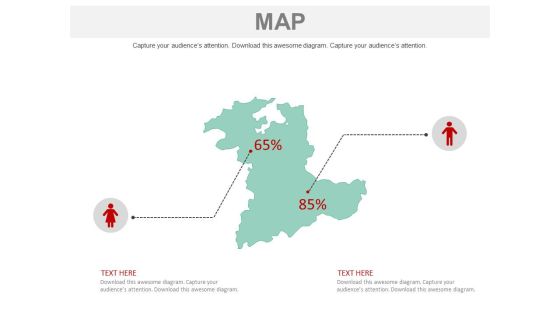
Map With Male Female Population Comparison Powerpoint Slides
This PowerPoint template has been designed with graphics of male, female icons. Our professionally designed business diagram is as an effective tool to display male female population comparison. Above slide provide ideal backdrop to make impressive presentations.

World Map For Global Business Analysis Powerpoint Slides
This professionally designed PowerPoint template displays diagram of world map. You can download this diagram to exhibit global business analysis. Above PPT slide is suitable for business presentation.
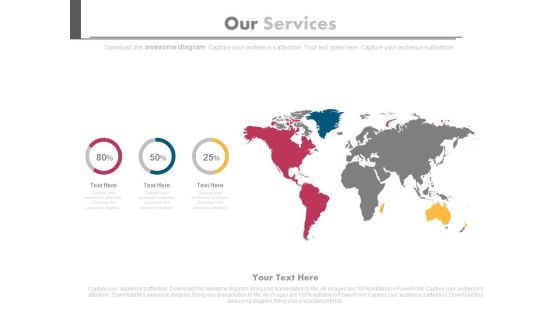
World Map Our Services Diagram Powerpoint Slides
This professionally designed PowerPoint template displays diagram of world map. You can download this diagram to exhibit global business analysis. Above PPT slide is suitable for business presentation.
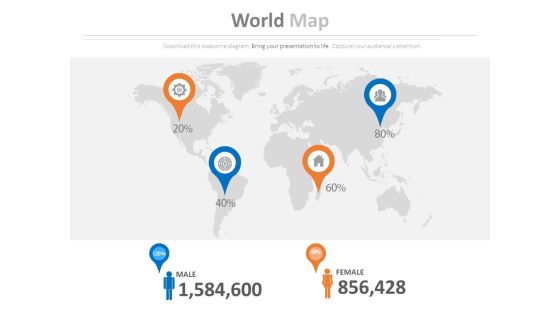
World Map With Male And Female Population Data Powerpoint Slides
This professionally designed PowerPoint template displays diagram of world map with male female icons. You can download this diagram to exhibit male female ratio in world. Above PPT slide is suitable for business presentation.
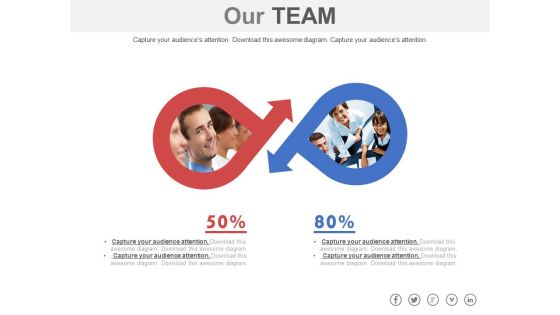
Teams Performance Analysis Powerpoint Slides
This PowerPoint template contains circle diagram of two teams. Download this PPT slide to display competition between two teams. Transmit your thoughts via this slide and prod your team to action.

About Us Company Profile Facts And Figure Powerpoint Slides
Our above about us PPT slide may be used to display company profile. This may be also used to display company facts and figures. Make an impressive introduction slide using this PowerPoint template.

About Us Companys Data Information Powerpoint Slides
Download this PowerPoint template to create an attention grabbing introductory slide. It contains slide bar graph with employee image. Use this professional slide design to build a good reputation of your company.

Business Employee Profile Growth Chart Powerpoint Slides
This PowerPoint template has been designed with graphics of business man with growth chart. This PowerPoint slide is an excellent tool to showcase employee growth and performance. Make impressive presentation using this slide.

Business Partners About Us Slide Powerpoint Slides
The PowerPoint template has been designed with business men and percentage ratio. Use this PPT slide for business and partnership related topics. Explain your strategy to co-ordinate business activities.

Graphic Designer And Financial Advisor Skill Assessment Chart Powerpoint Slides
The PowerPoint template has been designed with graphic designer and financial advisor skill assessment chart. Use this about us page to tell the story of your company.

Social Media Users Of Company Powerpoint Slides
On this template you can see social media icons. This PowerPoint slide is an excellent tool to display leading social networks worldwide. Make impressive presentation using this PowerPoint template.
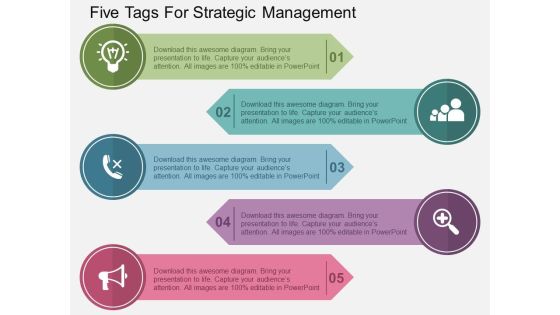
Five Tags For Strategic Management Powerpoint Templates
Our above slide contains diagram of circular infographic. It helps to exhibit six steps of goal planning. Use this diagram to impart more clarity to data and to create more sound impact on viewers.

Computer Development And Generation Chart Powerpoint Slides
This PPT slide displays graphics of computer devices. Use this PPT design to display technology development and generation. This PowerPoint template can be customized as per requirements of business education or any other theme.
Three Text Boxes With Percentage Values And Icons Powerpoint Slides
This PowerPoint template has been designed with text boxes and percentage data. You may download this PPT slide to display data comparison and analysis. Add this slide to your presentation and impress your superiors.
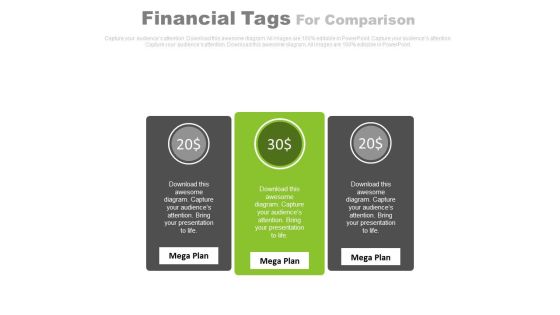
Three Text Tags Compare Chart Powerpoint Slides
This PowerPoint template has been designed with text tags and percentage data. You may download this PPT slide to display data comparison and analysis. Add this slide to your presentation and impress your superiors.

Year Based Timeline With Financial Progress Powerpoint Slides
This professional timeline template can be used for multiple purposes including financial planning, new milestones and tasks. This PPT slide contains linear timeline diagram. Download this PowerPoint timeline template to make impressive presentations.
Four Circles With Percentage Values And Icons Powerpoint Slides
This PowerPoint template displays info graphic diagram of linear circles. This diagram may be used to exhibit financial growth and analysis. Grab center stage with this slide and capture the attention of your audience.
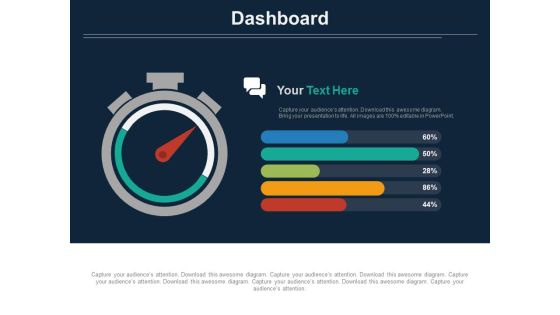
Stopwatch With Percentage Value Analysis Powerpoint Slides
The above template displays a diagram of stopwatch with percentage value. This diagram has been professionally designed to emphasize on time management. Grab center stage with this slide and capture the attention of your audience.

Three Dashboard With Percentage Value Growth Powerpoint Slides
This PowerPoint template has been designed with three dashboards. Use this PPT slide to depict rise in business profit. This professional diagram slide will help you express your views to target audience.

Concentric Chart With Five Financial Steps Powerpoint Slides
This PowerPoint slide contains diagram of concentric chart with five financial steps This professional slide helps to exhibit financial planning for business. Use this PowerPoint template to make impressive presentations.

Financial Growth Analysis Circular Chart Powerpoint Slides
Visually support your presentation with our above template containing graphics of circular chart. This diagram slide helps to display financial growth analysis. Etch your views in the brains of your audience with this diagram slide.

Pie Charts For Percentage Value Analysis Powerpoint Slides
Our above PPT slide displays graphics of Pie charts. This PowerPoint template may be used to display percentage value analysis. Download this template to leave permanent impression on your audience.
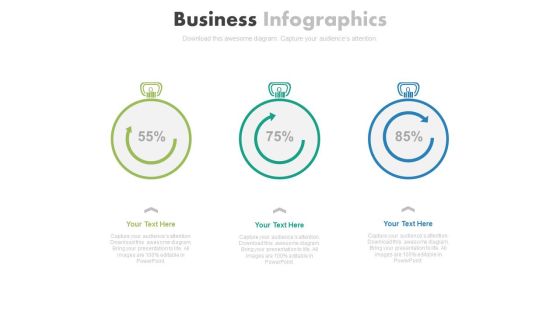
Three Stopwatches For Percentage Growth Powerpoint Slides
Three stopwatches have been displayed in this business slide. This business diagram helps to exhibit parameters of growth and development. Download this PowerPoint template to build an exclusive presentation.
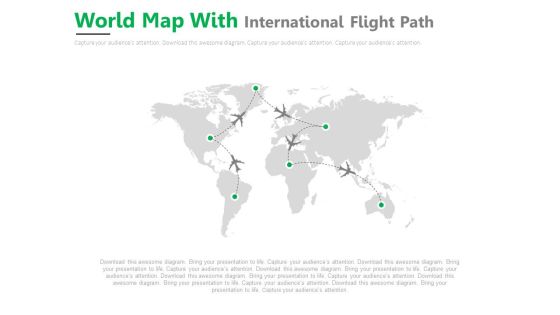
World Air Route Map Diagram Powerpoint Slides
This PowerPoint template displays graphics of world map with air route. This Map template can be used for geography and air route related topics. This slide can also be used to build professional presentations.
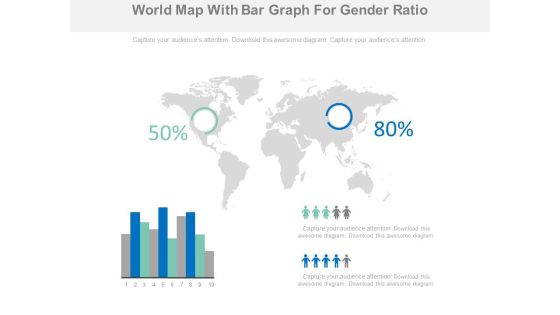
World Map With Bar Graph And Higher Population Areas Powerpoint Slides
This professionally designed PowerPoint template is as an effective tool to display high population areas on world. You can download this diagram to visually support your content. Above PPT slide is suitable for business presentation.
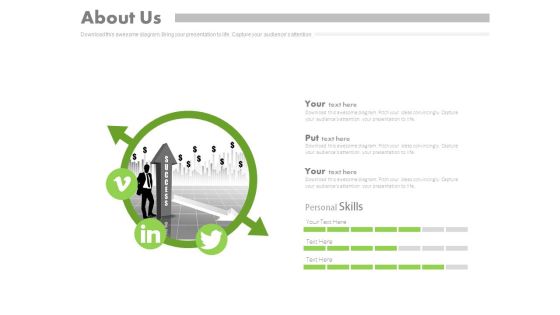
Success Planning With Social Media Links Powerpoint Slides
Upward arrow with social media icons have been displayed in this business slide. This PowerPoint template helps to exhibit social media links. Download this PowerPoint template to build an exclusive presentation.

Business Area Map With Percentage Value Powerpoint Slides
This PowerPoint template has been designed with graphics of America map. You may use this map diagram to display sales territories, business and new office locations, travel planning etc in your presentations. Any text can be entered at any point in the PowerPoint map slide.

Comparison Map Chart With Social Media Icons Powerpoint Slides
This PowerPoint template has been designed with map diagram and social media icons. Each and every property of any region - color, size, shading etc can be modified to help you build an effective PowerPoint presentation. You may use this map slide to display sales territories, business and new office locations, travel planning etc in your presentations.

Five Maps For Different Countries Powerpoint Slides
This PowerPoint map template has been designed with five maps of different countries. Each and every property of any region - color, size, shading etc can be modified to help you build an effective PowerPoint presentation. Any text can be entered at any point in the PowerPoint map slide.

Globe With Four Points For Business Strategy Powerpoint Slides
This PowerPoint map template has been designed with graphics of globe and four points. Use this PPT slide to display global business strategy in your presentations. Any text can be entered at any point in the PowerPoint map slide.
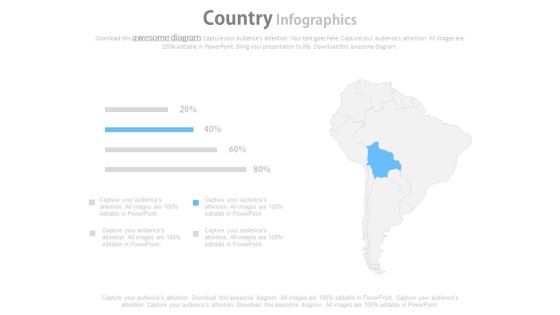
Map Diagram For Demography Of Country Powerpoint Slides
This PowerPoint map template has been carefully created by our professional team to display location and other geographic details in your PowerPoint presentation. Each and every property of any region - color, size, shading etc can be modified to help you build an effective PowerPoint presentation.
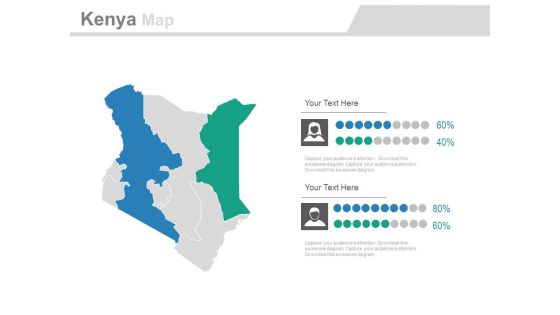
Map Of Kenya With Gender Population Analysis Powerpoint Slides
This PowerPoint map template has been designed with map of Kenya and male female icons. Use these maps to display gender population analysis in your presentations. Any text can be entered at any point in the PowerPoint map slide.
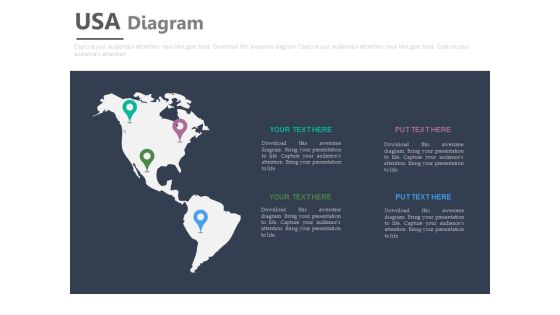
Map Of Usa With Multiple Locations Powerpoint Slides
This PowerPoint template has been designed with map of USA and multiple locations. Each and every property of any region - color, size, shading etc can be modified to help you build an effective PowerPoint presentation. Use this map diagram to display sales territories of country.

Map With Location Pointers And Percentage Ratios Powerpoint Slides
This PowerPoint map template has been carefully created by our professional team to display location and other geographic details. Each and every property of any region - color, size, shading etc can be modified to help you build an effective PowerPoint presentation. Use this map diagram to display sales territories, business and new office locations, travel planning etc.

South Africa Map With Population Ratio Analysis Powerpoint Slides
This PowerPoint map template has been designed with map of South Africa and human icons. Use this map template to display gender population ratio analysis in your presentations. Any text can be entered at any point in the PowerPoint map slide.

World Map Diagram For Product Launch Powerpoint Slides
This PowerPoint map template has been designed with graphics of world map. Each and every property of any region - color, size, shading etc can be modified to help you build an effective PowerPoint presentation. Use these maps to show sales territories, business and new office locations, travel planning etc in your presentations.
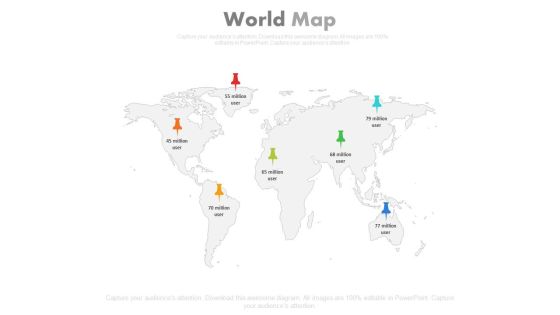
World Map With Different Locations Pins Powerpoint Slides
This PowerPoint map template has been carefully created by our professional team to display location and other geographic details in your PowerPoint presentation. Each and every property of any region - color, size, shading etc can be modified to help you build an effective PowerPoint presentation.

World Map With Text Tags And Percentage Pointers Powerpoint Slides
This PowerPoint map template has been carefully created by our professional team to display location and other geographic details in your PowerPoint presentation. Each and every property of any region - color, size, shading etc can be modified to help you build an effective PowerPoint presentation.

Column Chart For Financial Analysis Powerpoint Slides
This PowerPoint template has been designed with graphics of column chart with percentage values. You may use this business slide design for topics like financial analysis and planning. This PPT slide is powerful tool to describe your ideas.
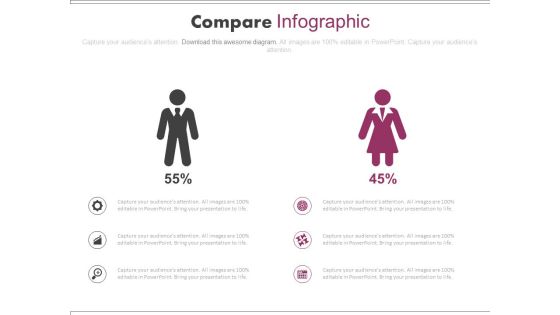
Male Female Employee Skill Assessment Chart Powerpoint Slides
Create visually stunning and define your PPT presentations in a unique and inspiring manner using our above template. It contains male female icons. This business slide helps for male female employee skill assessment. Grab the attention of your team with this eye catching template.
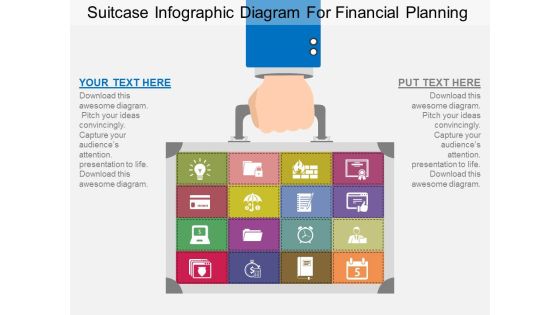
Suitcase Infographic Diagram For Financial Planning Powerpoint Template
This PowerPoint slide contains suitcase infographic diagram. This professional slide may be used for financial planning. Use this template to highlight the key issues of your presentation.

Bowling Pins On Race Track Leadership Powerpoint Template
This PowerPoint template has been designed with graphics of bowling pin on race track. Download this slide to display concepts of competition, strategy and success. You may also use this template to depict business agenda.

Financial Idea Generation Strategy Diagram Powerpoint Template
This PowerPoint slide contains graphics light bulbs with dollar notes and coins. This professional slide may be used to display financial ideas, planning and strategy. Use this template to highlight the key issues of your presentation.
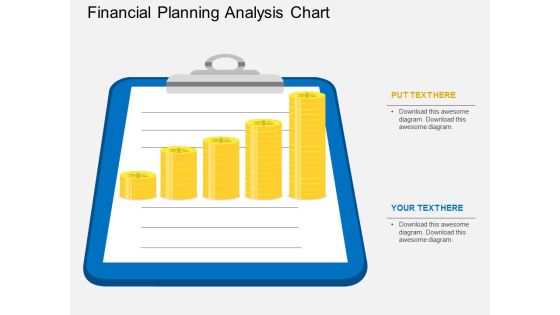
Financial Planning Analysis Chart Powerpoint Template
This PowerPoint slide contains graphics of note pad with gold coins. This professional slide may be used to display financial planning, report and analysis. Adjust the above diagram in your business presentations to give professional impact.
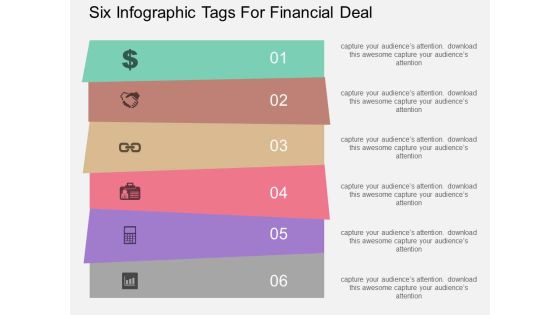
Six Infographic Tags For Financial Deal Powerpoint Template
This PowerPoint template has been designed with diagram of six infographic tags. This business diagram helps to exhibit financial deal and planning. Use this diagram to build an exclusive presentation.

Curve Line Diagram With Icons Powerpoint Template
Our above slide contains diagram of curve line infographic. This infographic slide helps to exhibit business analysis. Use this diagram to impart more clarity to data and to create more sound impact on viewers.
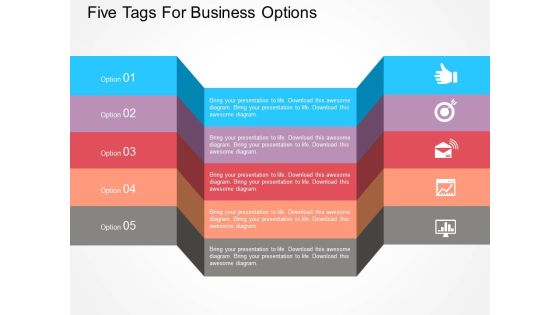
Five Tags For Business Options Powerpoint Template
This PowerPoint slide contains graphics of five tags with icons. This diagram is designed to make impressive presentations on various business processes. This professional slide helps in making an instant impact on viewers.

Population Census Male Female Ratio Powerpoint Template
This business slide contains graphics of pie charts with male female icons. This template helps to display male female population census. Present your views using this innovative slide and be assured of leaving a lasting impression.

Process Analyzers Risk Based Approach Ppt Slides
This is a process analyzers risk based approach ppt slides. This is a six stage process. The stages in this process are business, process and flows, design.

Customer Service Benchmarking Ppt Slides
This is a customer service benchmarking ppt slides. This is a eight stage process. The stages in this process are success, business, marketing.

Marketing Strategy Marketing Concept Ppt Slides
This is a marketing strategy marketing concept ppt slides. This is a four stage process. The stages in this process marketing strategy, marketing concept, coordinated effort, customer orientation.
Review Proposed Plan Powerpoint Slides Presentation Sample
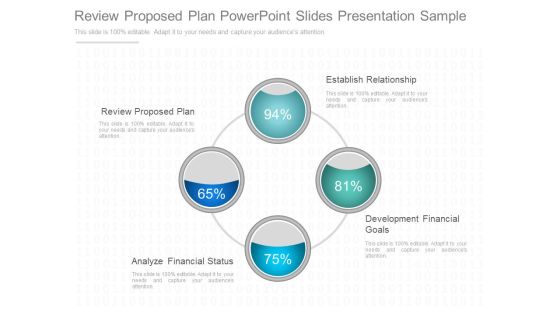
This is a review proposed plan powerpoint slides presentation sample. This is a four stage process. The stages in this process are review proposed plan, establish relationship, analyze financial status, development financial goals.
Market And Environment Analysis Ppt Slides
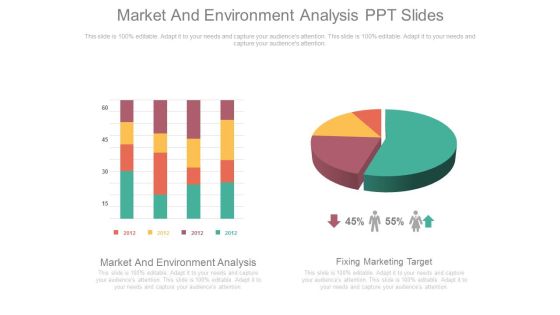
This is a market and environment analysis ppt slides. This is a four stage process. The stages in this process are market and environment analysis, fixing marketing target.

Customer Validation Presentation Powerpoint Templates
This is a customer validation presentation powerpoint templates. This is a four stage process. The stages in this process are customer discovery, customer validation, customer creation, company building.

Economies Of Scale Powerpoint Presentation Templates
This is an economies of scale powerpoint presentation templates. This is a five stage process. The stages in this process are economies of scale, economies of scale, capital requirements, product differentiation, access to distribution channels.
World Map Example Ppt
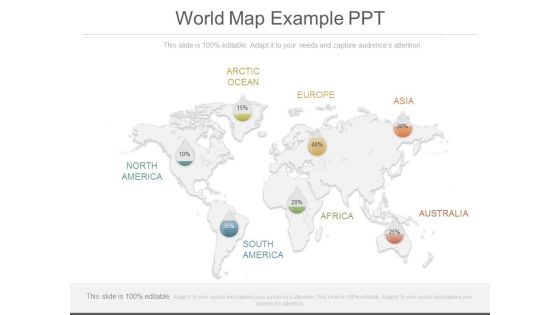
This is a world map example ppt. This is a seven stage process. The stages in this process are north america, south america, arctic ocean, europe, asia, africa, australia.
Leadership Strategy And Change Presentation Ppt
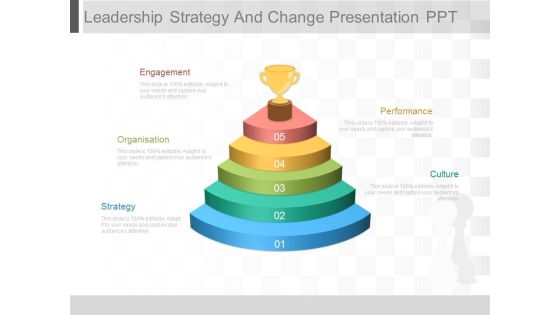
This is a leadership strategy and change presentation ppt. This is a five stage process. The stages in this process are engagement, organization, strategy, performance, culture.
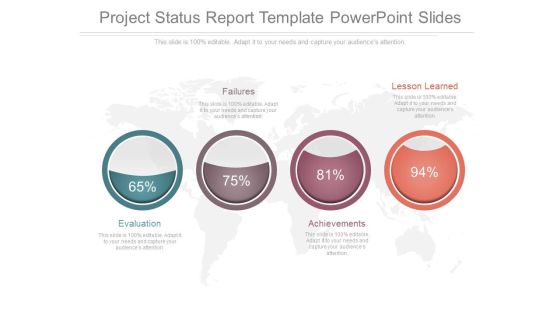
Project Status Report Template Powerpoint Slides
This is a project status report template powerpoint slides. This is a four stage process. The stages in this process are failures, lesson learned, evaluation, achievements.
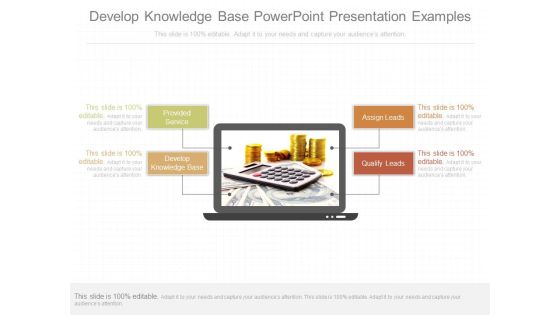
Develop Knowledge Base Powerpoint Presentation Examples
This is a develop knowledge base powerpoint presentation examples. This is a four stage process. The stages in this process are assign leads, qualified leads, develop knowledge base, provided service.
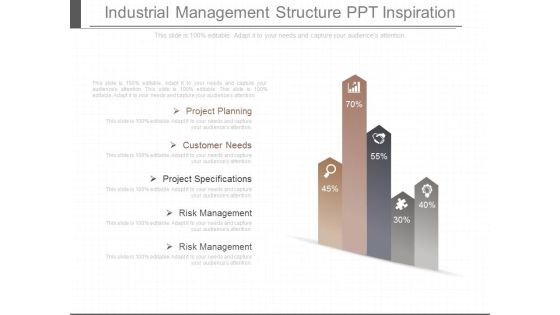
Industrial Management Structure Ppt Inspiration
This is a industrial management structure ppt inspiration. This is a five stage process. The stages in this process are project planning, customer needs, project specifications, risk management, risk management.

Project Management Status Guide Ppt Sample
This is a project management status guide ppt sample. This is a six stage process. The stages in this process are deployment, maintenance, requirements, design, implementation, testing.

Analysis Of Consumer Behaviour Sample Ppt Files
This is a analysis of consumer behaviour sample ppt files. This is a four stage process. The stages in this process are marketing strategy, public policy, social marketing, consumer choices.
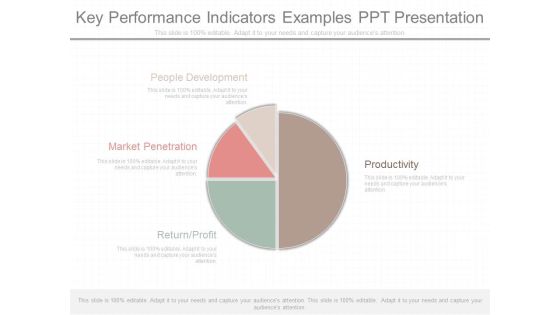
Key Performance Indicators Examples Ppt Presentation
This is a key performance indicators examples ppt presentation. This is a four stage process. The stages in this process are people development, productivity, market penetration, return profit.
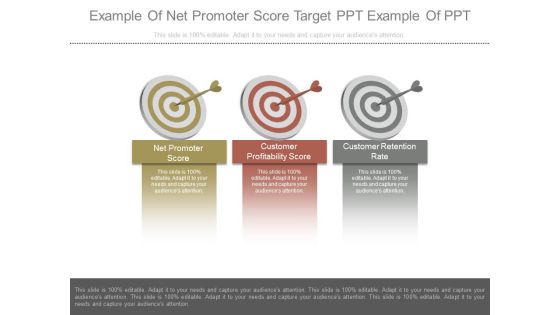
Example Of Net Promoter Score Target Ppt Example Of Ppt
This is a example of net promoter score target ppt example of ppt. This is a three stage process. The stages in this process are net promoter score, customer profitability score, customer retention rate.

Needs Assessment Or Problem Definition Ppt Example
This is a needs assessment or problem definition ppt example. This is a three stage process. The stages in this process are needs assessment or problem definition, program revision, goals and objectives, program planning and evaluation.

Small Business Marketing Plan Powerpoint Slides Show
This is a Small Business Marketing Plan Powerpoint Slides Show. This is a three stage process. The stages in this process are executive summary, market and situation analysis, market segmentation and customer analysis.

Individual Performance Assessment Example Of Ppt Presentation
This is an individual performance assessment example of ppt presentation. This is a four stage process. The stages in this process are measure, monitor, feedback, evaluate.
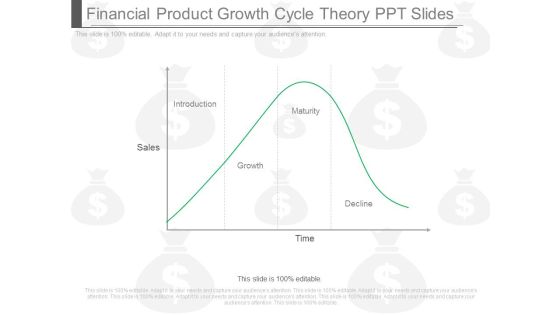
Financial Product Growth Cycle Theory Ppt Slides
This is a financial product growth cycle theory ppt slides. This is a one stage process. The stages in this process are sales, introduction, maturity, growth, decline, time.

Attribution Modeling Powerpoint Presentation Examples
This is a attribution modeling powerpoint presentation examples. This is a four stage process. The stages in this process are social, search, display, email.

Extend Brand Value Example Sample Presentation Ppt
This is a extend brand value example sample presentation ppt. This is a three stage process. The stages in this process are purpose, logic, emotion.\n\n\n\n\n\n\n\n\n\n\n\n

Brand Exposure Powerpoint Slide Templates Download
This is a brand exposure powerpoint slide templates download. This is a five stage process. The stages in this process are brand exposure, brand engagement, soft lead generation, prospect conversation, customer retention.

Product Info Graphic Timeline Diagram Presentation Examples
This is a product info graphic timeline diagram presentation examples. This is a four stage process. The stages in this process are design, develop, evaluate, analyze.
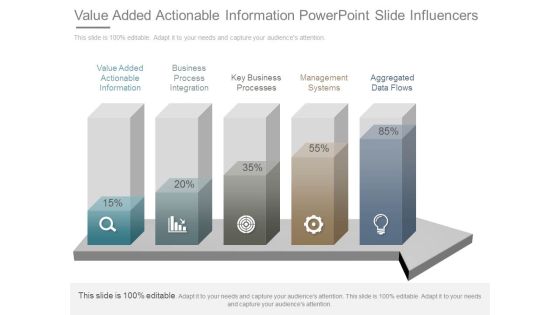
Value Added Actionable Information Powerpoint Slide Influencers
This is a value added actionable information powerpoint slide influencers. This is a five stage process. The stages in this process are value added actionable information, business process integration, key business processes , management systems, aggregated data flows.
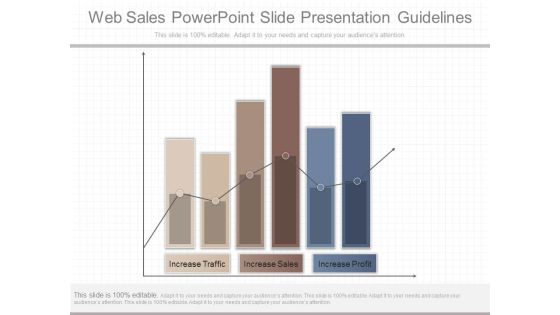
Web Sales Powerpoint Slide Presentation Guidelines
This is a web sales powerpoint slide presentation guidelines. This is a six stage process. The stages in this process are increase traffic, increase sales, increase profit.

Business Development Powerpoint Templates
This is a business development powerpoint templates. This is a four stage process. The stages in this process are business development, business creation, business concept, business ideas.

Audience Generation Example Ppt Slides
This is a audience generation example ppt slides. This is a three stage process. The stages in this process are audience generation, demand generation, lead generation.

Entrepreneur Social Network Example Slide Ppt Sample
This is a entrepreneur social network example slide ppt sample. This is a four stage process. The stages in this process are investors, lenders, entrepreneurs, experts.

Debt To Income Ratio Example Ppt Presentation
This is a debt to income ratio example ppt presentation. This is a three stage process. The stages in this process are pre tax income, monthly expenses, debt to income.
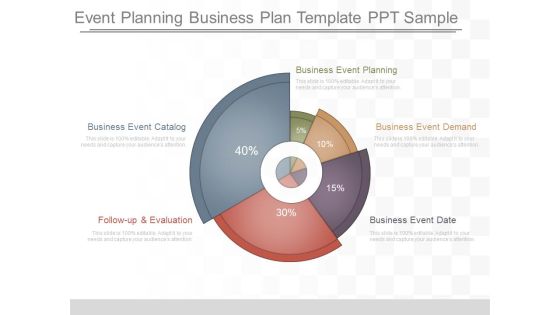
Event Planning Business Plan Template Ppt Sample
This is a event planning business plan template ppt sample. This is a five stage process. The stages in this process are business event planning, business event demand, business event date, business event catalog, follow up and evaluation.

Business Plan Management Mind Map Example File
This is a business plan management mind map example file. This is a three stage process. The stages in this process are business plan, financial planning, competitor analysis, mission statement, operation, product description, swot analysis, executive summary, company background, marketing plan.

Insurance Research And Purchasing Decisions Ppt Slide
This is a insurance research and purchasing decisions ppt slide. This is a two stage process. The stages in this process are insurance research, insurance purchase.
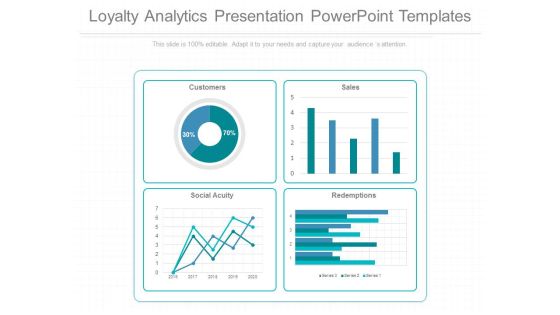
Loyalty Analytics Presentation Powerpoint Templates
This is a loyalty analytics presentation powerpoint templates. This is a four stage process. The stages in this process are customers, sales, social acuity, redemptions.

Management Reporting Tools Ppt Presentation
This is a management reporting tools ppt presentation. This is a five stage process. The stages in this process are plan, strategy, focus, implement, report.

Additional Routing Powerpoint Templates Download
This is a additional routing powerpoint templates download. This is a three stage process. The stages in this process are additional routing, partition aware routing, voldemort cluster.

Advertising And Sales Promotion Efforts Ppt Sample Presentations
This is a advertising and sales promotion efforts ppt sample presentations. This is a three stage process. The stages in this process are consumer, trade, sales and promotion, advertising.

Approaches To Management Illustration Ppt Files
This is a approaches to management illustration ppt files. This is a three stage process. The stages in this process are scientific management, administrative management, bureaucratic management.

Business Analysis Requirements Gathering Dashboard Diagram Ppt Example
This is a business analysis requirements gathering dashboard diagram ppt example. This is a five stage process. The stages in this process are business, marketing, presentation, success, management.

Dashboard Analytics Diagram Powerpoint Guide
This is a dashboard analytics diagram powerpoint guide. This is a three stage process. The stages in this process are value, analytic, reporting.

Data Mining Dashboard Diagram Powerpoint Slides
This is a data mining dashboard diagram powerpoint slides. This is a four stage process. The stages in this process are very active min, distance, calories, activity.

Effective Project Management Processes Ppt Sample
This is a effective project management processes ppt sample. This is a four stage process. The stages in this process are consultation, design, supply, training, installation, after sales.
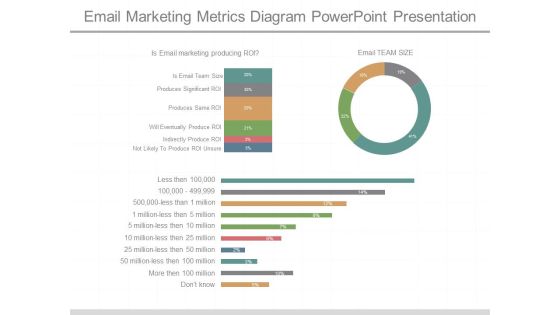
Email Marketing Metrics Diagram Powerpoint Presentation
This is a email marketing metrics diagram powerpoint presentation. This is a three stage process. The stages in this process are is email marketing producing roi, is email team size, produces significant roi, produces same roi, will eventually produce roi, indirectly produce roi, not likely to produce roi unsure, email team size.

Engineering Foundation Powerpoint Slide Download
This is a engineering foundation powerpoint slide download. This is a five stage process. The stages in this process are engineering foundation, management foundation, design electives, thesis project, leadership electives.

Financial Liberalization Growth Diagram Powerpoint Presentation
This is a financial liberalization growth diagram powerpoint presentation. This is a five stage process. The stages in this process are liberalization, pop growth, enrollment, gov gdp, life experience.
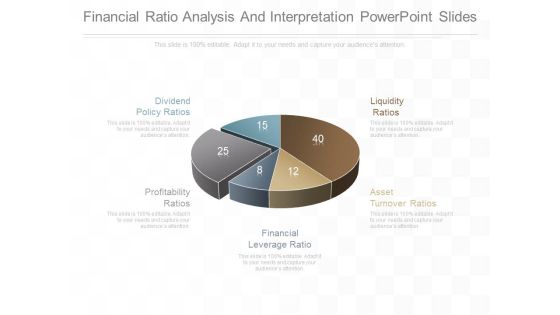
Financial Ratio Analysis And Interpretation Powerpoint Slides
This is a financial ratio analysis and interpretation powerpoint slides. This is a five stage process. The stages in this process are dividend policy ratios, profitability ratios, financial leverage ratio, asset turnover ratios, liquidity ratios.

Future Of Marketing Example Powerpoint Ideas
This is a future of marketing example powerpoint ideas. This is a three stage process. The stages in this process are traditional marketing, internet marketing, mobile marketing.
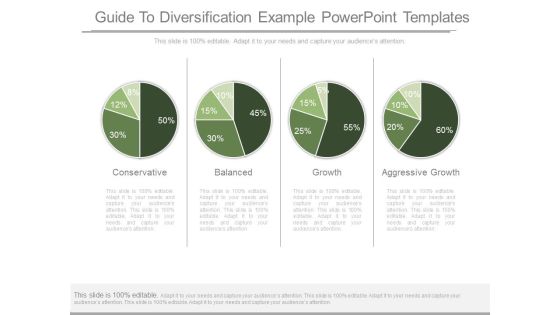
Guide To Diversification Example Powerpoint Templates
This is a guide to diversification example powerpoint templates. This is a four stage process. The stages in this process are conservative, balanced, growth, aggressive growth.

Higher Gross Profit Margin Example Presentation Images
This is a higher gross profit margin example presentation images. This is a four stage process. The stages in this process are profit, quality, reliability, price.

Identify Insights Diagram Powerpoint Slides
This is a identify insights diagram powerpoint slides. This is a five stage process. The stages in this process are identify insights, establish design criteria, brainstorm ideas, develop concept, surface key assumption.

Key Metrics Presentation Powerpoint Example
This is a key metrics presentation powerpoint example. This is a two stage process. The stages in this process are residential customer churn, broadband availability.

Reporting Dashboard Ppt Presentation Powerpoint
This is a reporting dashboard ppt presentation powerpoint. This is a four stage process. The stages in this process are dashboard, visual analysis tools, scorecards, reports.
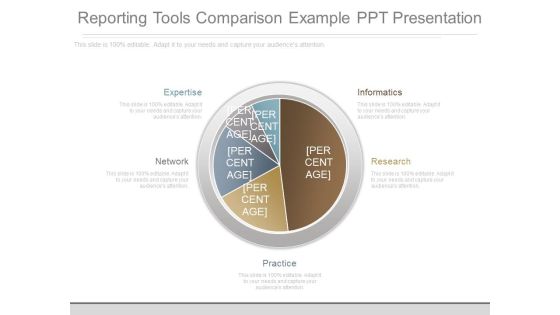
Reporting Tools Comparison Example Ppt Presentation
This is a reporting tools comparison example ppt presentation. This is a five stage process. The stages in this process are expertise, informatics, research, network, practice.

Revenue Cycle Dashboard Powerpoint Images
This is a revenue cycle dashboard powerpoint images. This is a five stage process. The stages in this process are days after discharge, cash collections trend, days to bill trend by facility, days in ar by aging, managed care payer mix trend.
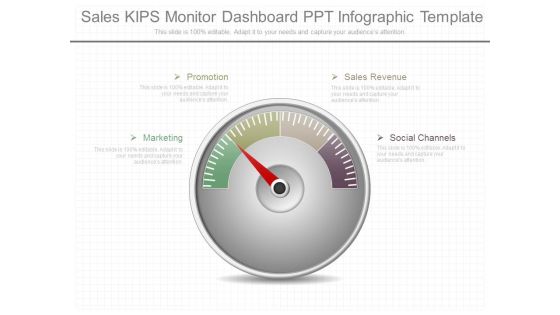
Sales Kips Monitor Dashboard Ppt Infographic Template
This is a sales kips monitor dashboard ppt infographic template. This is a four stage process. The stages in this process are promotion, marketing, sales revenue, social channels.

Sales Opportunity Metrics Template Presentation Design
This is a sales opportunity metrics template presentation design. This is a three stage process. The stages in this process are sales status, sales opportunities, sales product performance.
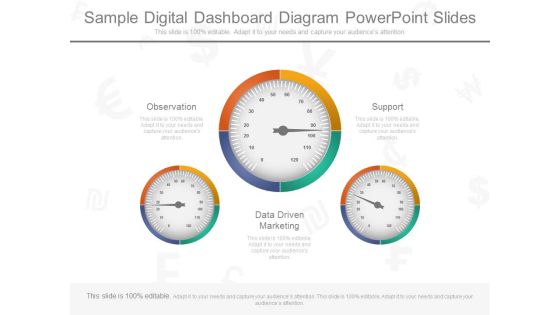
Sample Digital Dashboard Diagram Powerpoint Slides
This is a sample digital dashboard diagram powerpoint slides. This is a three stage process. The stages in this process are observation, support , data driven marketing.
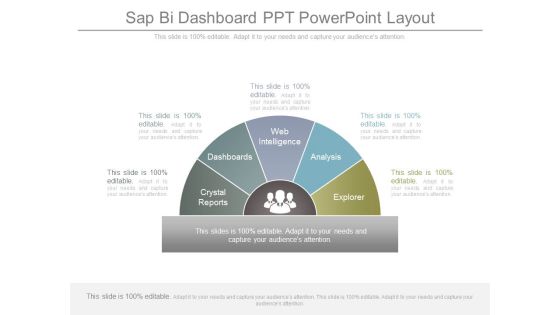
Sap Bi Dashboard Ppt Powerpoint Layout
This is a sap bi dashboard ppt powerpoint layout. This is a five stage process. The stages in this process are crystal reports, dashboards, web intelligence, analysis, explorer.
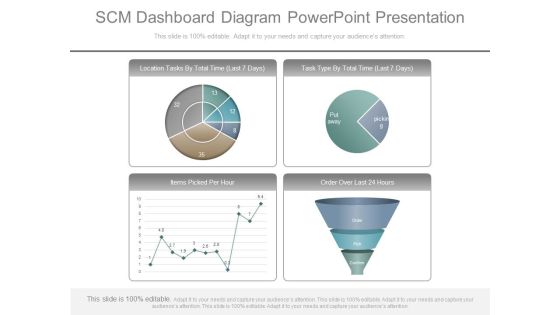
Scm Dashboard Diagram Powerpoint Presentation
This is a scm dashboard diagram powerpoint presentation. This is a four stage process. The stages in this process are location tasks by total time, task type by total time, items picked per hour, order over last.
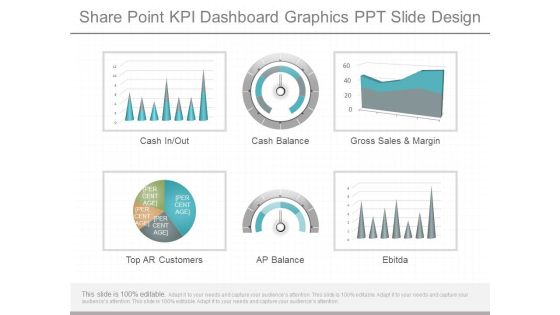
Share Point Kpi Dashboard Graphics Ppt Slide Design
This is a share point kpi dashboard graphics ppt slide design. This is a six stage process. The stages in this process are cash in out, cash balance, gross sales and margin, top ar customers, ap balance, ebitda.
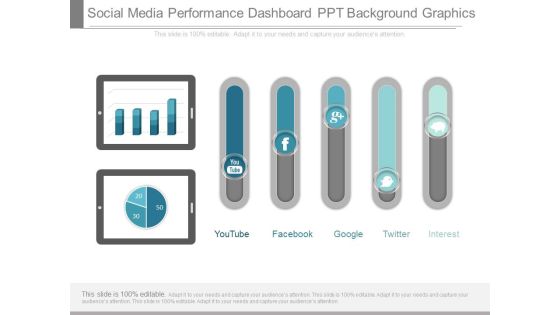
Social Media Performance Dashboard Ppt Background Graphics
This is a social media performance dashboard ppt background graphics. This is a seven stage process. The stages in this process are youtube, facebook, google, twitter, pinterest.

Software Dashboard Manager Test Diagram Presentation Examples
This is a software dashboard manager test diagram presentation examples. This is a four stage process. The stages in this process are issues by risk level, reported issues, location on map, top contributing factors.

Vendor Performance Dashboard Reports Ppt Powerpoint Images
This is a vendor performance dashboard reports ppt powerpoint images. This is a two stage process. The stages in this process are trends of complaints, count by category.
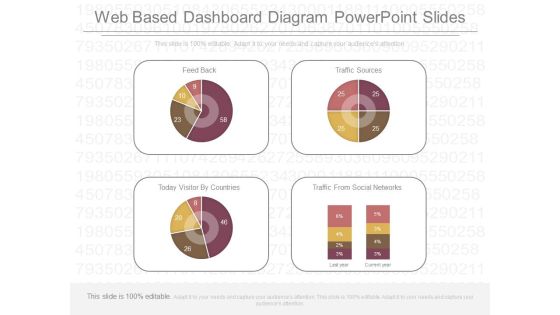
Web Based Dashboard Diagram Powerpoint Slides
This is a web based dashboard diagram powerpoint slides. This is a four stage process. The stages in this process are feed back, traffic sources, today visitor by countries, traffic from social networks.

Email Marketing Dashboard Ppt Examples Professional
This is a email marketing dashboard ppt examples professional. This is a three stage process. The stages in this process are manage control list, report, schedules email queue, signup forma and surveys, setting.
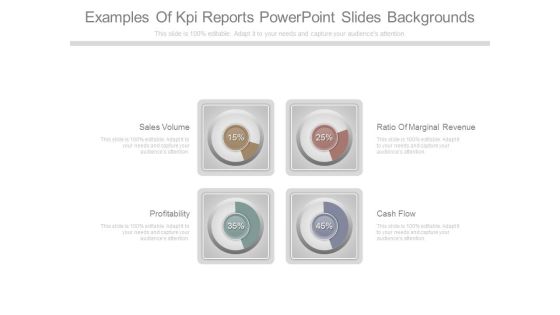
Examples Of Kpi Reports Powerpoint Slides Backgrounds
This is a examples of kpi reports powerpoint slides backgrounds. This is a four stage process. The stages in this process are sales volume, profitability, ratio of marginal revenue, cash flow.
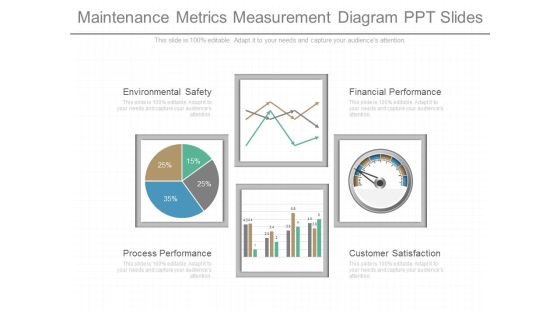
Maintenance Metrics Measurement Diagram Ppt Slides
This is a maintenance metrics measurement diagram ppt slides. This is a four stage process. The stages in this process are environmental safety, process performance, financial performance, customer satisfaction.
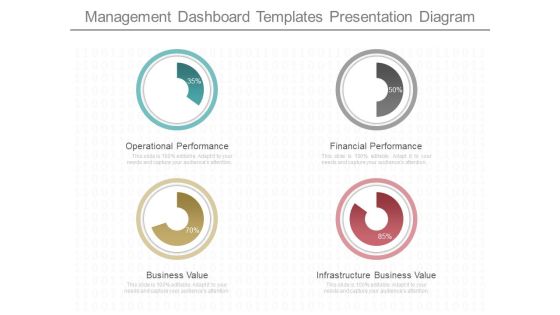
Management Dashboard Templates Presentation Diagram
This is a management dashboard templates presentation diagram. This is a four stage process. The stages in this process are operational performance, business value, financial performance, infrastructure business value.

Average Days Sales Outstanding Analysis Ppt Example
This is a average days sales outstanding analysis ppt example. This is a four stage process. The stages in this process are target for week, inventory, sales vs quotes, sales vs quotes.

Build Dashboard For Business Diagram Powerpoint Show
This is a build dashboard for business diagram powerpoint show. This is a four stage process. The stages in this process are average internal pv examination lead time, average entry variance, average internal audit lead time, amount contribution.

Business Intelligence Dashboard Design Ppt Powerpoint Topics
This is a business intelligence dashboard design ppt powerpoint topics. This is a four stage process. The stages in this process are sales analysis, sales forecasting, global distribution, sales by region, latin america, north america, eastern europe, western europe.

Capital Markets Dashboard Ppt Powerpoint Slide Background
This is a capital markets dashboard ppt powerpoint slide background. This is a three stage process. The stages in this process are weekly sales, product inventory, key performance indicators.

Competitive Intelligence Dashboard Diagram Ppt Slides
This is a competitive intelligence dashboard diagram ppt slides. This is a four stage process. The stages in this process are monthly sales, inventory turns, customer complaints, company, subject area.

Dashboard Design And Development For Travel Diagram Background
This is a dashboard design and development for travel diagram background. This is a five stage process. The stages in this process are number of trips, sales, delayed flights, regional load, flight expense.

Dashboard Design Sample Ppt Powerpoint Slide Ideas
This is a dashboard design sample ppt powerpoint slide ideas. This is a four stage process. The stages in this process are your current setup, message board, quick stats, progress towards goals, total posts, comments, social reactions, new users, hourly visits, bounce rate.

Dashboard For Six Sigma Ppt Powerpoint Templates
This is a dashboard for six sigma ppt powerpoint templates. This is a four stage process. The stages in this process are program savings, project count, project cycle time, six sigma training.

Dashboard Reporting Tool Diagram Powerpoint Slides
This is a dashboard reporting tool diagram powerpoint slides. This is a two stage process. The stages in this process are data visualization, mobile analytics.

Dashboard Visualization Ppt Presentation Powerpoint
This is a dashboard visualization ppt presentation powerpoint. This is a three stage process. The stages in this process are design, category.

Dashboards And Scorecards Comparison Diagram Ppt Slides
This is a dashboards and scorecards comparison diagram ppt slides. This is a three stage process. The stages in this process are dashboard, balanced scorecard, differences, performance management, periodically monthly, gps shows how will arrive, is used for, is update, in automobile it is, performance monitoring, in real time, automobile dashboard shows how your car is operating.

Data Dashboard Diagram Presentation Powerpoint Example
This is a data dashboard diagram presentation powerpoint example. This is a seven stage process. The stages in this process are root cause, incident trends and their status, contributing cause, incident by category and severity, incident by category, incident by facilities, incident severity by.

Digital Marketing Dashboard Powerpoint Slide Images
This is a digital marketing dashboard powerpoint slide images. This is a five stage process. The stages in this process are lead generation, website, email, advertising, social media.

Average Profit Margin Examples Presentation Slides
This is a average profit margin examples presentation slides. This is a five stage process. The stages in this process are sales growth, sales opportunities, product performance, average profit margin, sales target.

Event Policy Planning Template Ppt Slides
This is a event policy planning template ppt slides. This is a five stage process. The stages in this process are direction, security, policy, planning, event.
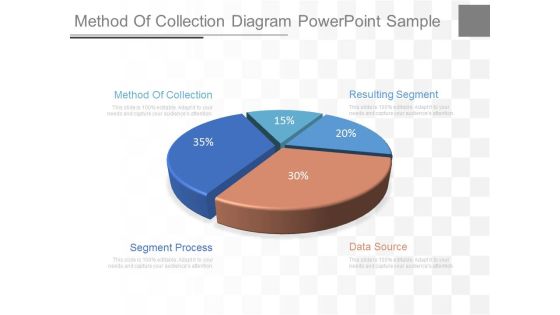
Method Of Collection Diagram Powerpoint Sample
This is a method of collection diagram powerpoint sample. This is a five stage process. The stages in this process are method of collection, segment process, data source, resulting segment.
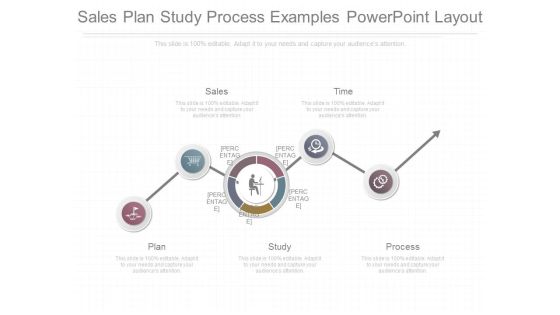
Sales Plan Study Process Examples Powerpoint Layout
This is a sales plan study process examples powerpoint layout. This is a five stage process. The stages in this process are sales, time, plan, study, process.
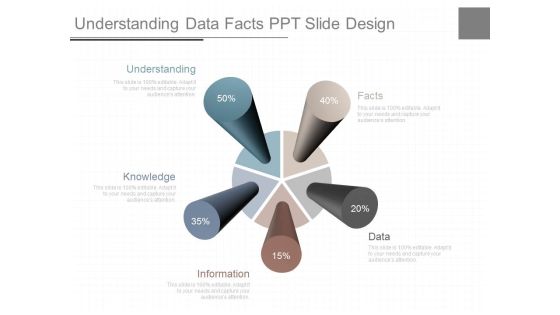
Understanding Data Facts Ppt Slide Design
This is a understanding data facts ppt slide design. This is a five stage process. The stages in this process are understanding, knowledge, information, data, facts.
