AI PPT Maker
Templates
PPT Bundles
Design Services
Business PPTs
Business Plan
Management
Strategy
Introduction PPT
Roadmap
Self Introduction
Timelines
Process
Marketing
Agenda
Technology
Medical
Startup Business Plan
Cyber Security
Dashboards
SWOT
Proposals
Education
Pitch Deck
Digital Marketing
KPIs
Project Management
Product Management
Artificial Intelligence
Target Market
Communication
Supply Chain
Google Slides
Research Services
 One Pagers
All Categories
-
Home
- Customer Favorites
- Resources
Resources
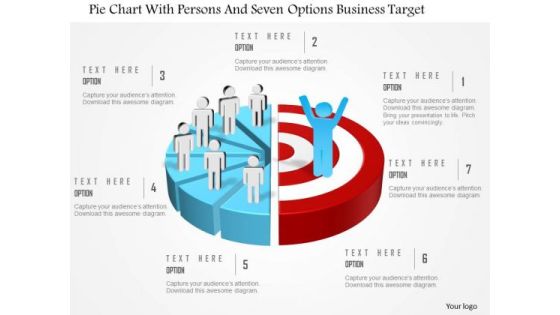
Business Diagram Pie Chart With Persons And Seven Options Business Target Presentation Template
This power point template slide has been crafted with graphic of pie chart ,persons and seven options. This PPT contains the concept of option representation for business targets. This PPT diagram is can be used business and marketing presentations.

Business Diagram Pie Chart With Persons And Three Options Marketing Targets Presentation Template
This power point template slide has been crafted with graphic of pie chart and three persons. This PPT contains the concept of option representation for marketing targets. This PPT diagram is suitable for marketing presentations.
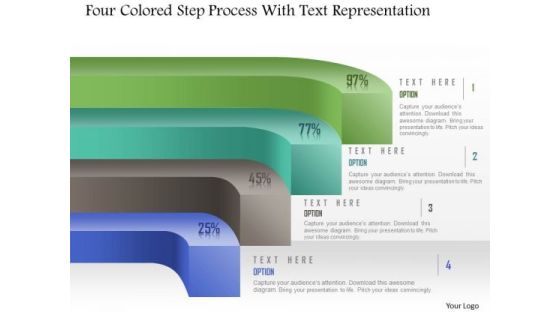
Business Diagram Four Colored Step Process With Text Representation PowerPoint Template
Four colored step process diagram has been used to craft this power point template. This PPT contains the concept of process flow. Use this PPT for your business and marketing related presentations and make your viewers happy.
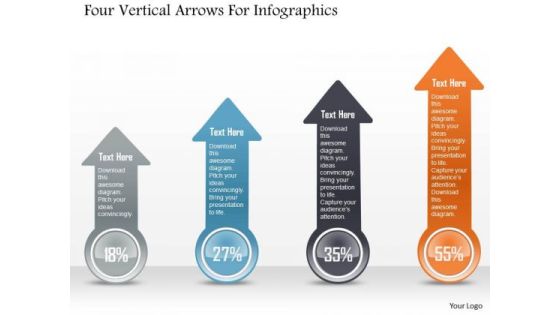
Business Diagram Four Vertical Arrows For Infographics PowerPoint Template
Four vertical arrows are used to craft this power point template. This PPT slide contains the concept of information representation. Display your information in any presentation with this professional PPT slide.
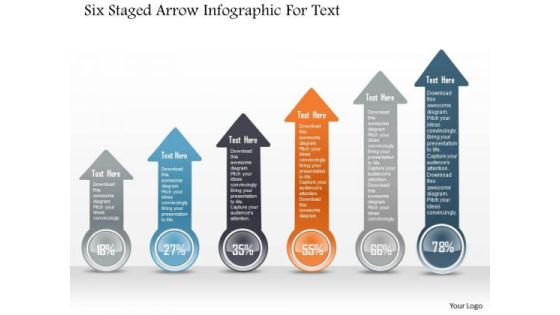
Business Diagram Six Staged Arrow Infographic For Text PowerPoint Template
Six staged colored arrow info graphics diagram has been used to craft this power point template. This PPT contains the concept of business process flow and information representation. Display any process flow in your presentation with this professional PPT slide.
Business Diagram Three Icons Arrow Text Boxes PowerPoint Template
Graphic of three icons and arrow text boxes are used to craft this power point template slide. This PPT contains the concept of business growth. This PPT slide is suitable for business and marketing data flow related presentations.
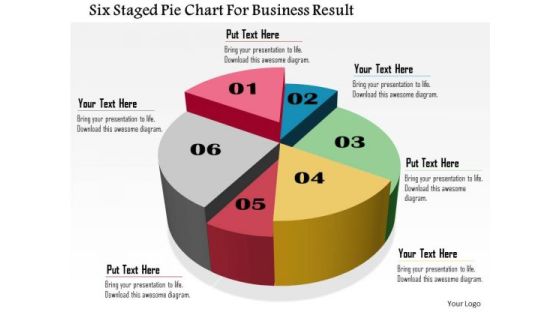
Business Daigram Six Staged Pie Chart For Business Result Presentation Templets
Six staged pie chart is used to design this business slide. Download this diagram to make business and financial reports. Use our above diagram to express information in a visual way.

Business Diagram Pencils For 4 Financial Statements Presentation Template
Emphatically define your message with this slide which contains a graphic of pencils. Above image may be used to display four financial statements. Use this slide to build exclusive presentations for your viewers.
Business Diagram Pie Chart With Icons For Financial Analysis Presentation Template
This professional business diagram slide has been designed with pie chart and icons. It contains concept of financial analysis. Use this slide to build exclusive presentations for your viewers.
Business Diagram Tabs With Business Icons For Planning Presentation Template
Our above slide displays tabs with business icons. It helps to depict workflow or a process. Download our above diagram to express information in a visual way.
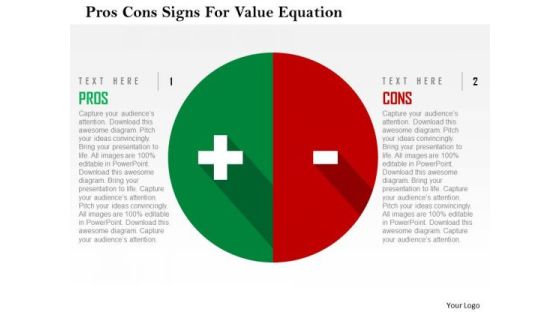
Business Diagram Pros Cons Signs For Value Equation Presentation Template
This business diagram is designed with pros and cons signs. You may use this business slide to present value equation. This diagram provides an effective way of displaying information you can edit text, color, shade and style as per you need.
Business Diagram Icons In Semi Circle For Timeline Presentation Template
This business diagram displays icons in semicircle. This diagram slide contains the concepts of business timeline. Download this diagram slide to make impressive presentations.
Business Diagram Pencil With Icons For Good Marketing Strategy Presentation Template
This Business slide has been designed with pencil with icons. This diagram can be used to displays good marketing strategy. Download this diagram slide to make professional presentations.
Business Diagram Steps With Icons For Success Presentation Template
This business slide displays icons on stairs. Use this diagram slide, in your presentations to depict growth and progress steps. Make your presentations outshine using this professional slide.
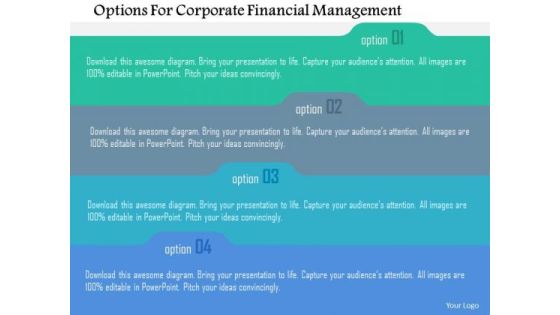
Business Diagram Options For Corporate Financial Management Presentation Template
This diagram contains list of four options. Download this diagram slide to display corporate financial management. This diagram provides an effective way of displaying information you can edit text, color, shade and style as per you need.
Business Diagram Six Icons For Communication Presentation Template
Our above business diagram has been designed with six business icons. You may present market analysis using this diagram. Pressure cooks your views with this diagram. You will hear whistles of appreciation.

Business Diagram Six Options In Pyramid Presentation Template
Sales process can be explained with this pyramid diagram. This diagram contains the graphic of pyramid chart with six options. This diagram provides an effective way of displaying information.

Stock Photo Bar Graph With Growth Arrow PowerPoint Slide
This creative image displays design of Bar Graph with Growth Arrow. This image has been designed to depict business on an Upward Trend. Create an impact with this quality image and make professional presentations.
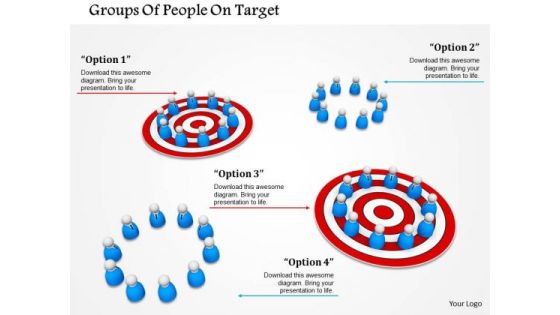
Stock Photo Groups Of People On Target PowerPoint Slide
This image slide contains groups of people on target. Download this image to portray concepts like team targets and communication. Use this image to enhance the beauty of your words.
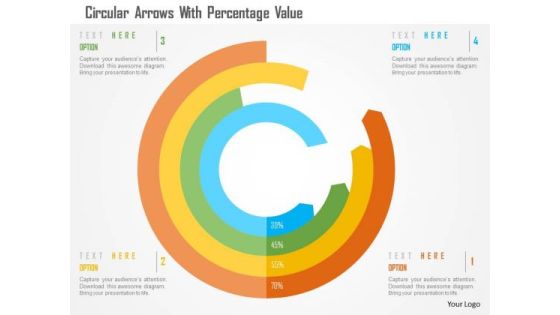
Business Diagram Circular Arrows With Percentage Value Presentation Template
This business slide has been designed with circular arrows. You may download this diagram to display percentage growth data. This template is innovatively designed to highlight your worthy views
Business Diagram Cloud Icon For Data Storage Presentation Template
Concept of cloud computing and data storage has been defined in this power point template. This business diagram contains the graphic of clouds. Use this diagram for business and technology related presentations.

Business Diagram Folders For Financial Review Presentation Template
This business diagram has been designed with graphics of colored folders. You may download this slide for financial review. Use this slide to create an impact on your viewers.

Men On Boats For Competition Presentation Template
Concept of competition can be explained with this PowerPoint template. It contains graphics of men in boat race. Above slide provides the ideal backdrop to make interactive presentations.
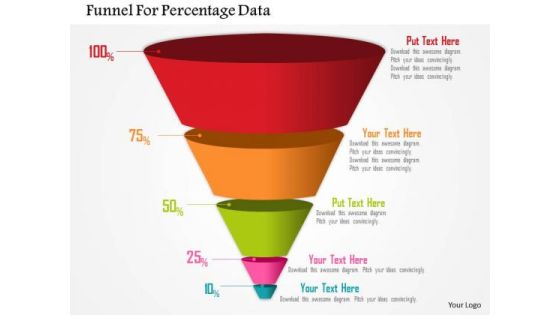
Business Diagram Funnel For Percentage Data Presentation Template
Four staged funnel diagram has been used to design this power point template. This diagram contains the concept of filtration. Present your views and ideas with this impressive image.
Business Diagram Icons For Good Marketing Strategy Presentation Template
This power point template has been designed with graphic of bar graph, suitcase and meeting business icons. These business icons are used to display the concept of business result analysis and meeting. Use this diagram for business related topics in any presentations.
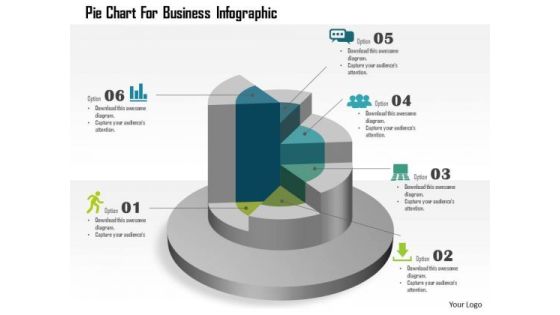
Business Diagram Pie Chart For Business Infographic Presentation Template
This template displays pie chart business infographic. You may download this business slide for result analysis. Amplify your thoughts via this appropriate business template.
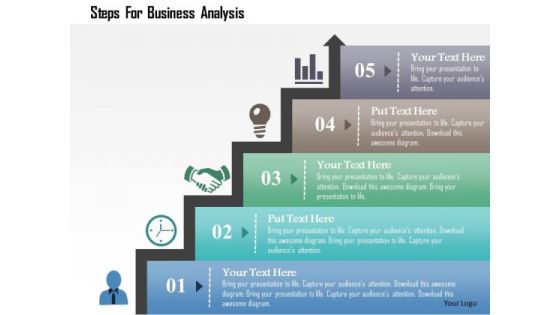
Business Diagram Steps For Business Analysis Presentation Template
Concept of time management has been defined in this power point template diagram. This diagram contains the graphic of bar graph. Amplify your thoughts via this appropriate business template.
Business Diagram Modern Icons On Pie Chart Presentation Template
Download this diagram to displays marketing strategy. This business diagram contains the graphic of icons on pie graph. Use this template to highlight the key issues of your presentation.

Business Diagram Pencil Graph For Statistics Presentation Template
The above template contains graphics of pencil graph. This diagram may be used to display statistical information. This diagram slide will
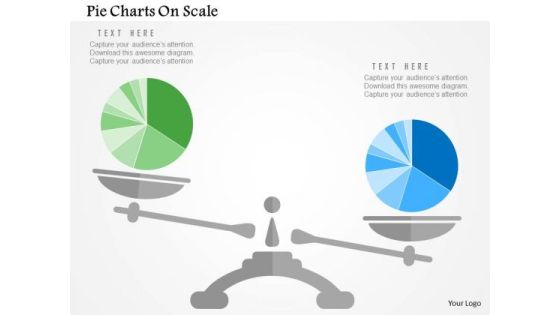
Business Diagram Pie Charts On Scale Presentation Template
Our above slide display graphics of pie chart on a scale. Download this diagram slide to display competitive analysis of business. Adjust the above diagram in your business presentations to visually support your content.

Business Diagram Bar Graph For Growth And Progress Presentation Template
This business slide has been designed with graphics of bar chart. You may download this diagram to display concepts like growth, progress and success in business. Download this diagram slide to make impressive presentations.

Business Diagram Bars For Profit Percentages Presentation Template
Download this exclusive business diagram to present profit in percentage ratio. This slide contains the graphic of bars. This diagram can be useful for business presentations.
Business Diagram Icons Around Pie Chart Presentation Template
Strategy and planning can be displayed with this business diagram. This slide contains the graphic of icons around pie chart Use this editable slide to build quality presentation for your viewers.

Arrow Steps For Management Development PowerPoint Template
This business diagram has been designed with four arrows with icons. It may use to display steps for management development. Prove the viability of your ideas to help your organization to achieve the quality and success required.
Circles With Icons For Communication PowerPoint Template
The above template displays a diagram of circles with icons. This diagram has been professionally designed to emphasize on concept of competitive strategy. Grab centre stage with this slide. Capture the attention of your audience.
Business Diagram Icons And Charts For Business Growth Presentation Template
Our above slide contains graphics of business charts and icons. It helps to display business reports and analysis. Use this diagram to impart more clarity to data and to create more sound impact on viewers.
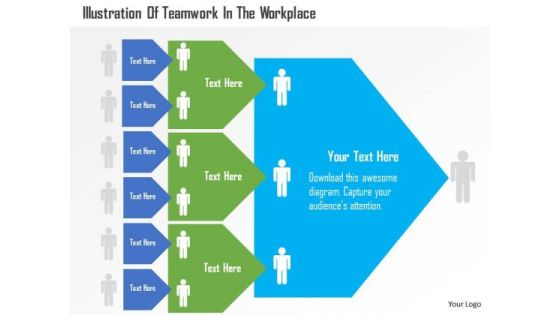
Business Diagram Illustration Of Teamwork In The Workplace Presentation Template
Our above business diagram illustrates teamwork in workplace. This slide is suitable for teamwork related presentations. Use this business diagram to present your work in a more smart and precise manner.

Business Diagram Matrix Chart For Financial Review Presentation Template
Our above business diagram has been designed with graphics of matrix chart. This slide is suitable to present financial review. Use this business diagram to present your work in a more smart and precise manner.

Timeline With Year Based Analysis And Business Apps PowerPoint Template
Create dynamic presentations with our professional template containing graphics of timeline with business icons. This diagram may be used to display planning and analysis. Download this template to leave permanent impression on your audience.
Icons For Cloud Computing PowerPoint Template
Develop competitive advantage with our above template which contains a diagram of cloud network. This diagram may used to depict concepts like cloud computing and technology. This slide provides an effective way of displaying information.

Pie Chart For Financial Ratio Analysis PowerPoint Template
Deliver amazing presentations with our above template showing pie chart. You may download this slide to display financial ratio analysis. Capture the attention of your audience using this diagram.
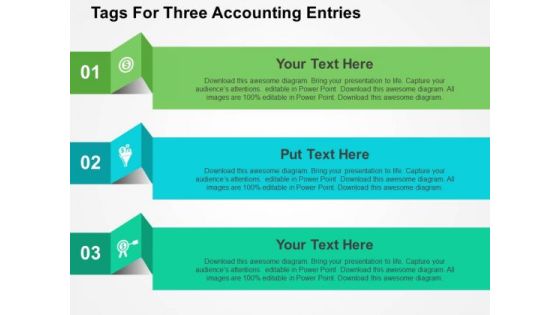
Tags For Three Accounting Entries PowerPoint Template
Visually support your presentation with our above template showing graphics of three tags. This slide has been professionally designed to display accounting entries. This template offers an excellent background to build impressive presentation.
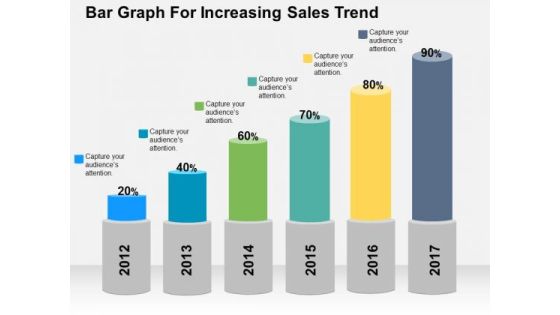
Bar Graph For Increasing Sales Trend PowerPoint Template
Deliver amazing presentations with our above template showing bar graph with percentage values. You may download this slide to depict increase in sales trends. Capture the attention of your audience using this diagram.
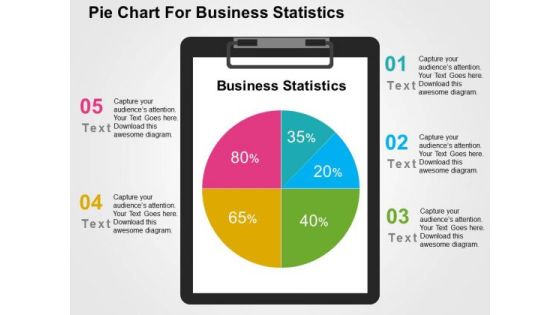
Pie Chart For Business Statistics PowerPoint Template
Visually support your presentation with our above template showing pie chart. This slide has been professionally designed to present business statistics. This template offers an excellent background to build impressive presentation.

Business Man Draws Financial Data For Analysis PowerPoint Templates
This PowerPoint slide has a theme for financial data analysis. This image has been designed to display concept of financial planning and analysis. Deliver amazing presentations to mesmerize your audience using this image
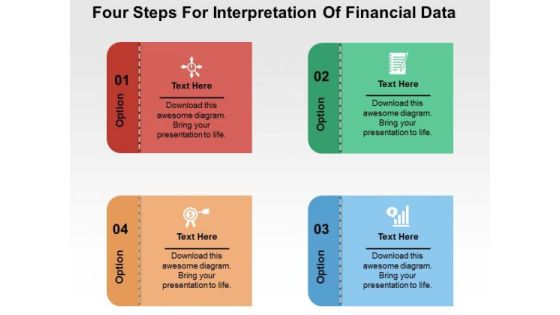
Four Steps For Interpretation Of Financial Data PowerPoint Templates
Our PPT above slide displays graphics of four text boxes with icons. This template may be used to depict interpretation of financial data. You can present your opinions using this impressive slide.

Scorecard For Companys Performance And Financial Condition PowerPoint Templates
Use this PPT slide to display companies performance financial planning. This slide contains graphics of circular scorecard. Trigger the imagination of your audience with this professional diagram.

Bars Displaying Percentage Growth PowerPoint Templates
Our above PPT slide contains bar graph displaying percentage growth. This diagram of bar graph helps to depict statistical information. Use this diagram to impart more clarity to data and to create more sound impact on viewers.
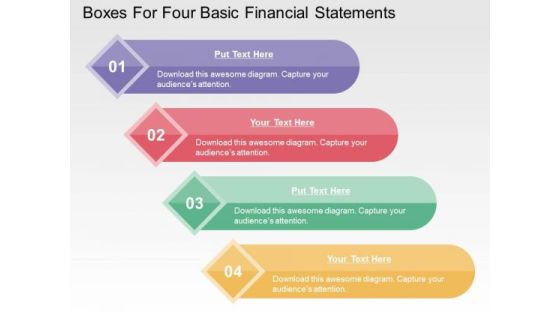
Boxes For Four Basic Financial Statements PowerPoint Templates
This business slide contains graphics of four text boxes. This diagram is suitable to present four basic financial statements. Visual effect of this diagram helps in maintaining the flow of the discussion and provides more clarity to the subject.

Graph Showing Economy Crash PowerPoint Templates
This business slide contains design of graph. This diagram is suitable to present downfall and economy crash. Visual effect of this diagram helps in maintaining the flow of the discussion and provides more clarity to the subject.
Hexagons With Business Icons PowerPoint Templates
This PowerPoint slide contains hexagons with business icons. This diagram is designed to make impressive presentations on various business processes. This professional slide helps in making an instant impact on viewers.

Illustration Of Dollar Growth Graph PowerPoint Template
This business slide contains graphics of dollar symbols on graph. This diagram helps to portray concept of financial planning. Present your views using this innovative slide and be assured of leaving a lasting impression.

Infographic For Mission Vision And Values PowerPoint Template
This slide contains the infographic diagram. Download this exclusive business diagram to present business mission, vision and values. This diagram can be useful for business presentations.
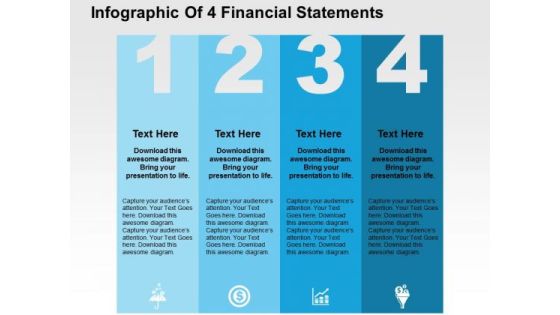
Infographic Of 4 Financial Statements PowerPoint Template
Four financial statements can be displayed in this business diagram. This slide contains the graphic of four text boxes with icons Use this editable slide to build quality presentation for your viewers.
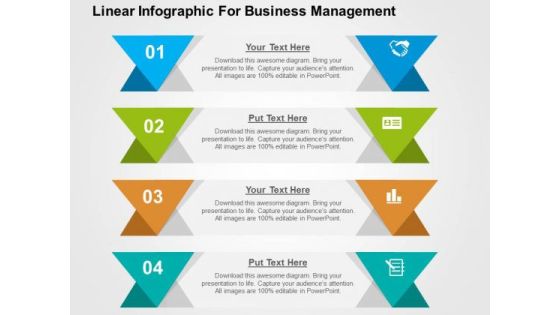
Linear Infographic For Business Management PowerPoint Template
Graphic of tags in linear flow has been used to design this business diagram. This diagram slide may be used to depict business steps in linear flow. Download this diagram for business research and analysis.
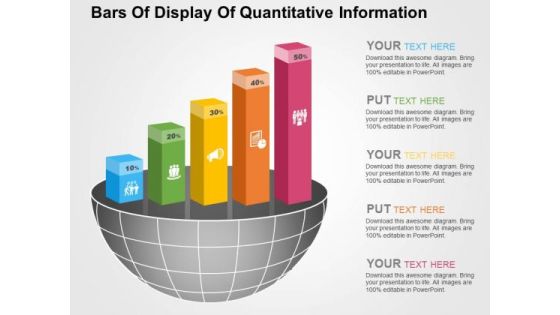
Bars Of Display Of Quantitative Information PowerPoint Templates
Visually support your presentation with our above template illustrating quantitative information. It contains graphics of bars. Etch your views in the brains of your audience with this diagram slide.
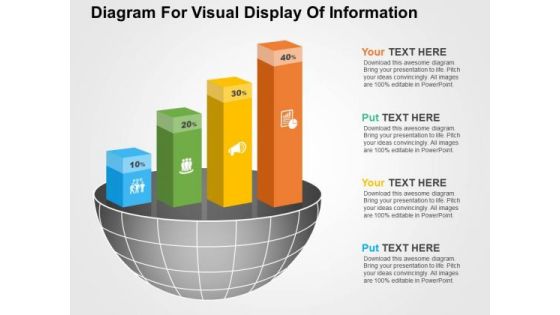
Diagram For Visual Display Of Information PowerPoint Templates
Visually support your presentation with our above template illustrating quantitative information. It contains graphics of bars. Etch your views in the brains of your audience with this diagram slide.

Four Staged Arrows Design PowerPoint Templates
This PowerPoint template has been designed with arrows infographic. You can easily impart your information with help of this PowerPoint template. The slide can be customized as per requirements of business education or any other theme.

Percentage Data Growth Chart Powerpoint Slides
This PowerPoint template has been designed with percentage data growth chart. Download this PPT chart to depict financial ratio analysis. This PowerPoint slide is of great help in the business sector to make realistic presentations and provides effective way of presenting your newer thoughts.
Four Pencils Bar Graph And Icons Powerpoint Template
Develop competitive advantage with our above template which contains a diagram of five pencils bar graph. This diagram provides an effective way of displaying business information. You can edit text, color, shade and style as per you need.

Circular Steps For Market Entry Strategy Powerpoint Slides
This PowerPoint template contains graphics of circular steps. You may download this PPT slide design to display market entry strategy. You can easily customize this template to make it more unique as per your need.

Bar Graph For Statistical Analysis Powerpoint Slides
This PowerPoint template has been designed with bar chart and percentage values. You may download this PPT slide to depict statistical analysis. Add this slide to your presentation and impress your superiors.

Battery Chart With Percentage Values For Comparison PowerPoint Slides
This year?s sales has matched up with your expectations. Now match this slide with your presentation to show the same. Show your company?s performance or business growth with this four staged battery chart PowerPoint template. With this slide, you can easily convince your colleagues how your company gave a tremendous growth over the years or months. Perfect illustration to show that the targets are achieved. This PPT template is easy to edit. You can choose the color of your choice. Your colleagues are already impressed with the sales growth. Now impress others and choose this PPT innovative designed template.

Dashboard With Increasing Values Powerpoint Slides
This innovative, stunningly beautiful dashboard has been designed for data visualization. It contains pie charts with increasing percentage values. This PowerPoint template helps to display your information in a useful, simple and uncluttered way.
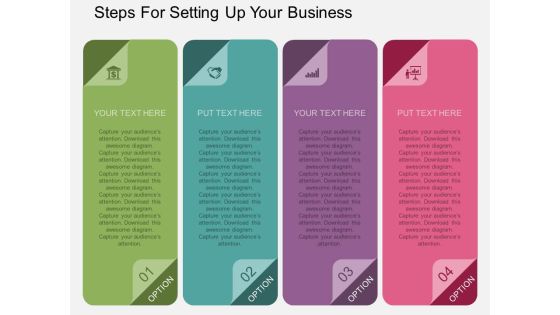
Steps For Setting Up Your Business Powerpoint Template
Our compelling template consists with diagram of text boxes. This slide has been professionally designed to display text information. This template offers an excellent background to build impressive presentation.

Circle Chart For Value Analysis Powerpoint Slides
This PowerPoint template has been designed for business presentations and corporate slides. The PowerPoint template has a high quality design. You can download this PowerPoint slide for corporate presentations or annual meeting and business plans.

Target Chart For Strategic Management Process Powerpoint Slides
This PowerPoint template has been designed with four steps target chart. The PowerPoint template may be used to display strategic management process. You can download this PowerPoint slide for corporate presentations or annual meeting and business plans.
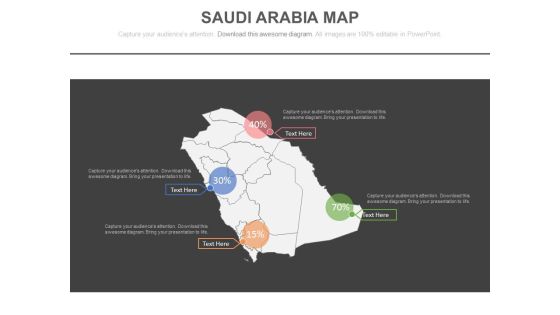
Saudi Arabia Map For Financial Strategy Analysis Powerpoint Slides
This PowerPoint template has been designed with Saudi Arabia Map. You may use this slide to display financial strategy analysis. This diagram provides an effective way of displaying information you can edit text, color, shade and style as per you need.
Saudi Arabia Map With Percentage Values And Icons Powerpoint Slides
This PowerPoint template has been designed with Saudi Arabia Map with percentage values and icons. You may use this slide to display financial strategy analysis. This diagram provides an effective way of displaying information you can edit text, color, shade and style as per you need.

Bar Graph For Year Based Analysis Powerpoint Slides
This PowerPoint template has been designed with year based bar graph. This diagram may be used to display yearly statistical analysis. Use this PPT slide design to make impressive presentations.

Bar Graph With Five Icons Powerpoint Slides
This PowerPoint slide contains diagram bar graph with icons. This PPT slide helps to exhibit concepts of financial deal and planning. Use this business slide to make impressive presentations.

Business Steps Diagram With Icons Powerpoint Slides
Visually support your presentation with our above template containing graphics of stairs diagram. It helps to portray directions of business actions. Etch your views in the brains of your audience with this diagram slide.

Checklist With Financial Planning Icons Powerpoint Slides
This PowerPoint template contains business checklist with icons. Download this diagram slide to display financial planning and analysis. Etch your views in the brains of your audience with this diagram slide.

Circle Chart With Percentage Value Analysis Powerpoint Slides
This PowerPoint template has been designed with circular process diagram. This business diagram helps to exhibit financial process control and analysis. Use this diagram to visually support your content.
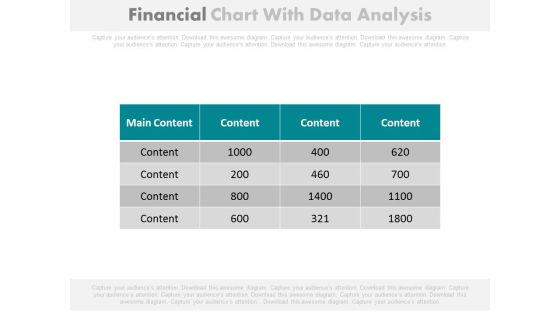
Financial Figures Data Analysis Report Powerpoint Slides
Our above PowerPoint template contains table chart with financial figures. This professional slide may be used to display data analysis report. Enlighten your audience with your breathtaking ideas.
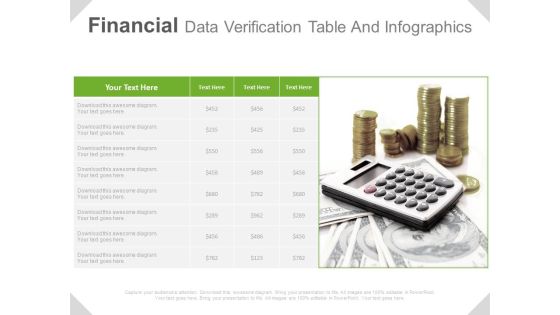
Financial Planning Table Infographic Diagram Powerpoint Slides
This PowerPoint template has been designed with table infographic diagram. This business slide is suitable for financial planning. Use this PPT slide to build an exclusive presentation.
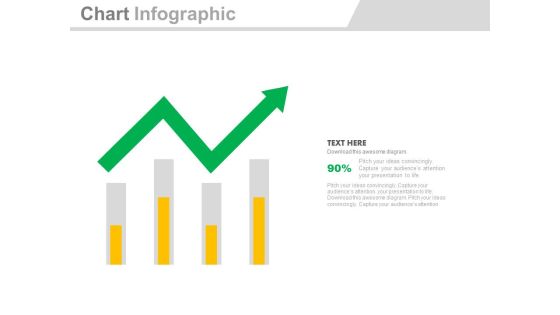
Four Bars With Green Growth Arrow Powerpoint Slides
Four bars with green arrow have been displayed in this business slide. This business diagram helps to exhibit process of business planning. Use this diagram to build an exclusive presentation.

Four Circles With Percentage Data Display Powerpoint Slides
This PowerPoint template has been designed with graphics of four circles. Download this PPT slide to display percentage data display. Use this professional template to build an exclusive presentation.
Four Colored Text Boxes With Icons Powerpoint Slides
This PowerPoint template has been designed with graphics of four text boxes. Download this PPT slide to display percentage data display. Use this professional template to build an exclusive presentation.
Four Linear Steps And Icons Powerpoint Slides
This PPT slide has been designed with four linear text boxes with icons. This PowerPoint template helps to exhibit process of business planning. Use this diagram slide to build an exclusive presentation.
Four Steps Financial Chart With Icons Powerpoint Slides
This business slide illustrates four steps financial chart. This PowerPoint template helps to exhibit process flow steps. Use this PowerPoint slide to build an exclusive presentation.

Four Steps For Organizational Learning Methods Powerpoint Slides
Four text boxes have been displayed in this business slide. This PowerPoint template helps to exhibit organizational learning methods. Use this diagram slide to build an exclusive presentation.

Four Tags For Financial Review And Analysis Powerpoint Slides
This PowerPoint template has been designed with four tags and financial values. This PowerPoint template helps to exhibit financial review and analysis. Use this diagram slide to build an exclusive presentation.
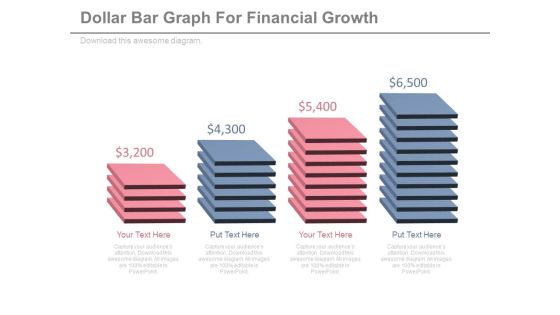
Illustration Of Dollar Value Slabs Powerpoint Slides
Pricing slabs have been displayed in this business slide. This PowerPoint template helps to exhibit financial growth process. Use this diagram slide to build an exclusive presentation.

Infographic Diagram For Business Process Analysis Powerpoint Slides
This PowerPoint slide contains business infographic diagram. This professional slide may be used to display business process analysis. Use this business template to make impressive presentations.
Mountain Chart With Social Media Icons Powerpoint Slides
The above PPT template displays mountain chart with social media icons. This PowerPoint template has been designed to exhibit users of social media. Download this PPT slide to attract the attention of your audience.

Pie Chart For Financial Ratio Analysis Powerpoint Slides
This PPT slide contains graphics of eight stage pie chart. Download this PowerPoint template slide for financial ratio analysis. This diagram is editable you can edit text, color, shade and style as per you need.
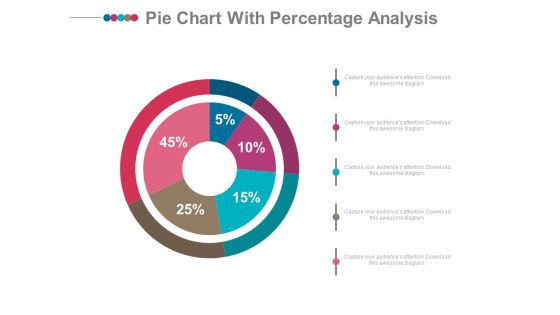
Pie Chart With Financial Data Comparison Powerpoint Slides
Emphatically define your message with our above template which contains graphics of pie chart. This PowerPoint template may be used to display financial data comparison. Grab the attention of your listeners with this slide.
Process Flow Diagram With Business Icons Powerpoint Slides
Emphatically define your message with our above infographic template. This PowerPoint template may be used to display business process flow. Grab the attention of your listeners with this slide.
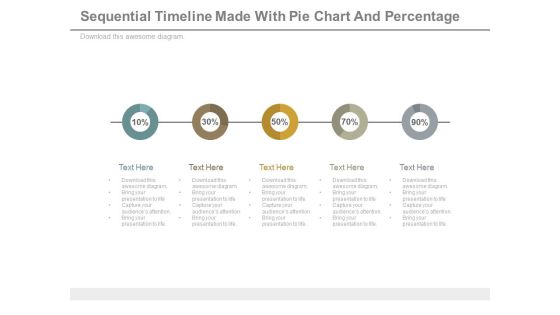
Sequential Timeline Diagram With Percentage Values Powerpoint Slides
This diagram contains graphics of linear circles timeline diagram. Download this diagram slide to display business planning and management. This diagram is editable you can edit text, color, shade and style as per you need.
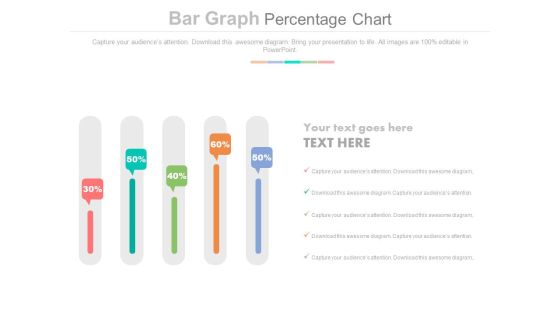
Sliders Percentage Data Chart Powerpoint Slides
This PowerPoint slide has been designed with slider chart and percentage data. This PPT diagram may be used to display business trends. This diagram slide can be used to make impressive presentations.
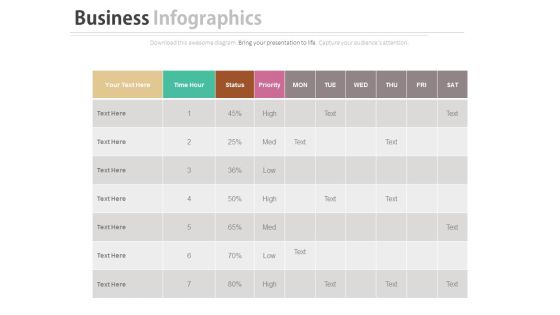
Work Sheet For Daily Activity Plan Schedule Powerpoint Slides
Our above business slide contains graphics of daily worksheet. This PowerPoint slide may be used to exhibit activity plan and schedule. Capture the attention of your audience with this slide.
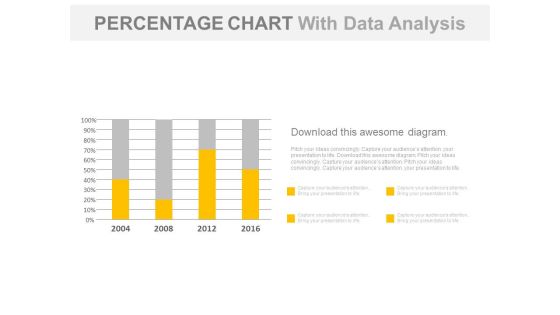
Year Based Chart With Percentage Data Analysis Powerpoint Slides
Our above business slide contains year based statistical chart. This PowerPoint template can be used to display percentage data analysis. Capture the attention of your audience with this slide.

Four Steps For Financial Data Analysis Powerpoint Slides
This PowerPoint contains four circles with percentage values. Download this diagram slide to display financial data analysis. This template is editable, You can edit text, color, shade and style of this diagram as per you need.

Parameters Of Growth And Development Powerpoint Slides
Dashboard design has been displayed in this business slide. This business diagram helps to exhibit parameters of growth and development. Download this PowerPoint template to build an exclusive presentation.
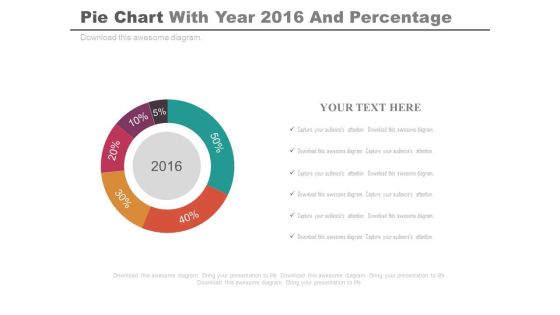
Pie Chart For Projected Profit Of 2016 Powerpoint Slides
Our above PPT slide displays graphics of Pie chart. This PowerPoint template may be used to display projected profit report of 2016. Download this template to leave permanent impression on your audience.
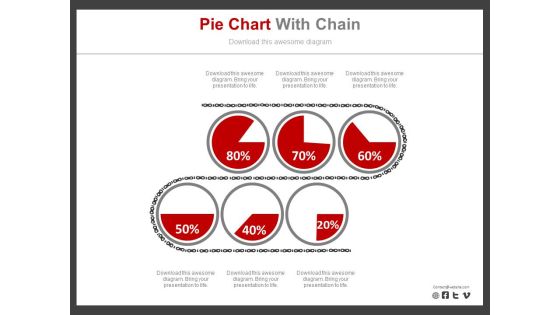
Six Pie Charts For Revenue Analysis Report Powerpoint Slides
Six pie charts have been displayed in this business slide. This business diagram helps to exhibit revenue analysis report. Download this PowerPoint template to build an exclusive presentation.

Circle Chart With Man And Woman Ratio Comparison Powerpoint Slides
This PowerPoint template has been designed with graphics of circle chart. You may download this PPT slide to depict man and woman ratio analysis. Add this slide to your presentation and impress your superiors.

Four Months Sales Statistics Chart Powerpoint Slides
This PowerPoint template has been designed with four shopping bags with percentage values. Download this PPT slide to display four months sales statistics. Add this slide to your presentation and impress your superiors.
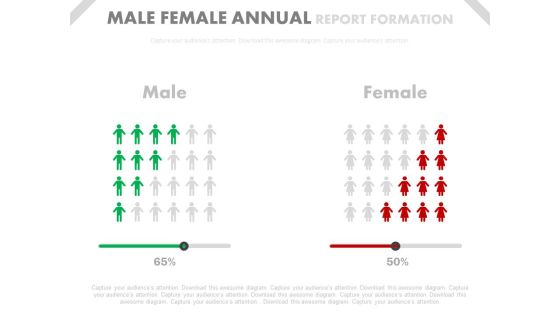
Male Female Ratio Comparison Chart Powerpoint Slides
This PowerPoint template has been designed with graphics of comparison chart. You may download this PPT slide to depict male female ratio comparison chart. Add this slide to your presentation and impress your superiors.

Red Green Teams Comparison Chart Powerpoint Slides
This PPT slide displays graphics of two red and green teams. Use this PPT design to display comparison of teams performances. This PowerPoint template can be customized as per requirements of business education or any other theme.

Test Tubes With Percentage Data For Comparison Powerpoint Slides
This PowerPoint template has been designed with test tubes and percentage data. You may download this PPT slide to display data comparison and analysis. Add this slide to your presentation and impress your superiors.

Bar Graph For Profit Growth Analysis Powerpoint Slides
This PowerPoint template has been designed with bar graph with percentage values. This diagram is useful to exhibit profit growth analysis. This diagram slide can be used to make impressive presentations.

Bar Graph For Yearly Statistical Analysis Powerpoint Slides
This PowerPoint template has been designed with bar graph. This PowerPoint diagram is useful to exhibit yearly statistical analysis. This diagram slide can be used to make impressive presentations.

Circular Diagram For Percentage Analysis Powerpoint Slides
This PowerPoint slide has been designed with circular diagram with social media icons. This diagram slide may be used to display users of social media. Prove the viability of your ideas with this professional slide.

Data Driven Comparison Charts For Analysis Powerpoint Slides
You can download this PowerPoint template to display statistical data and analysis. This PPT slide contains data driven comparison charts. Draw an innovative business idea using this professional diagram.
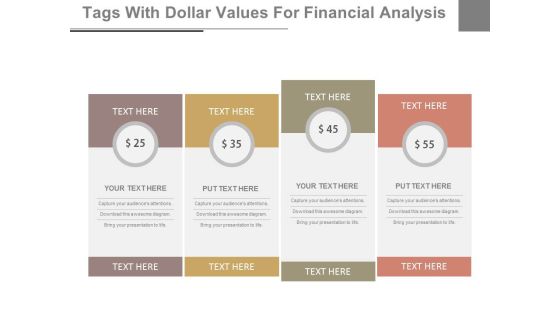
Dollar Value Pricing Table Powerpoint Slides
This PowerPoint template has been designed with dollar value pricing table chart. This PPT slide may be used for sample marketing proposal. Download this slide to build unique presentation.
Five Linear Circles And Icons For Technology Powerpoint Slides
This PowerPoint template has been designed with five linear circles and icons. This professional PPT slide is suitable to present technology growth steps. Capture the attention of your audience using this professional slide.

Five Steps Bar Graph For Financial Management Powerpoint Slides
This PowerPoint template has been designed with five steps bar graph and icons. This diagram is useful to exhibit financial management. This diagram slide can be used to make impressive presentations.
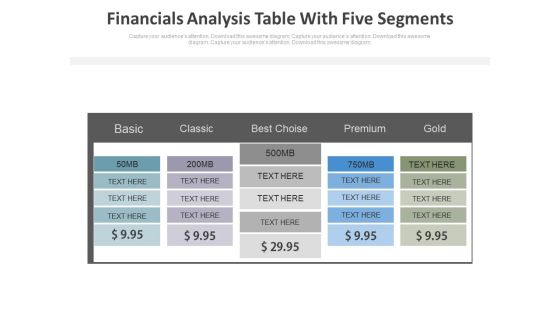
Five Steps Financial Analysis Table Powerpoint Slides
This PowerPoint template has been designed with dollar value pricing table chart. This PPT slide may be used for sample marketing proposal. Download this slide to build unique presentation.
Four Banners With Icons For Financial Planning Powerpoint Slides
The above PowerPoint template displays graphics of four text banners with icons. This diagram has been professionally designed to display steps of financial planning. Capture the attention of your audience.
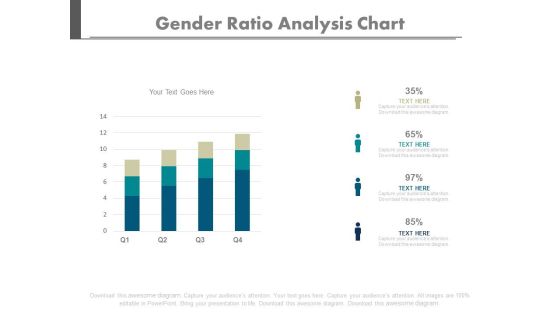
Four Bars Gender Population Ratio Chart Powerpoint Slides
Create dynamic presentations with our creative template of bar graph. This diagram may be used to present gender population. Download this template to leave permanent impression on your audience.

Four Circles Chart Financial Growth Steps Powerpoint Slides
Our professionally designed business diagram is as an effective tool for communicating cyclic processes. It contains circular graphics with icons. Above slide is suitable to display process management steps.
Four Clouds With Arrows And Icons Powerpoint Slides
This business slide displays diagram of four clouds with arrow and icons. Download this PowerPoint diagram to display technology development and management. Enlighten your audience with your breathtaking ideas.
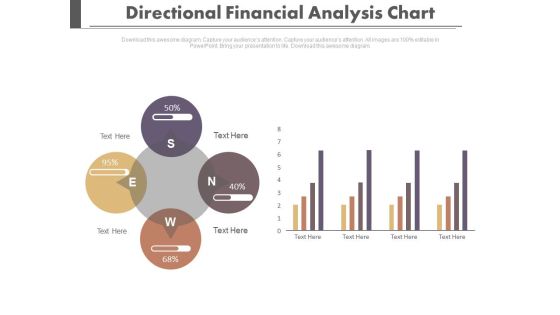
Four Directions Circular Analysis Chart Powerpoint Slides
Our professionally designed business diagram is as an effective tool for communicating business strategy. It contains four directional circular charts. Above slide is also suitable to display financial planning and strategy.

Four Dollar Value Financial Tags For Analysis Powerpoint Slides
This PowerPoint template has been designed with dollar value financial tags. This PPT slide may be used for sample marketing proposal. Download this slide to build unique presentation.

Four Options Circle Chart With Percentage Powerpoint Slides
This PowerPoint template has been designed with graphics of four options circle chart. This PowerPoint template may be used to display four steps of financial analysis. Prove the viability of your ideas using this impressive slide.

Four Pyramids With Growth Steps Powerpoint Slides
This business slide has been designed with four pyramids. This PowerPoint template may use to display sales growth and analysis. Prove the viability of your ideas using this impressive slide.
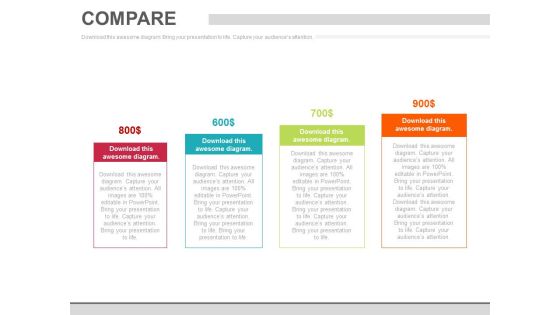
Four Steps Pricing Option Chart Powerpoint Slides
This PowerPoint template has been designed with dollar value pricing table chart. This PPT slide may be used for sample marketing proposal. Download this slide to build unique presentation.
Four Steps Pricing Table With Icons Powerpoint Slides
This PowerPoint template has been designed with dollar value pricing table chart. This PPT slide may be used for sample marketing proposal. Download this slide to build unique presentation.
