AI PPT Maker
Templates
PPT Bundles
Design Services
Business PPTs
Business Plan
Management
Strategy
Introduction PPT
Roadmap
Self Introduction
Timelines
Process
Marketing
Agenda
Technology
Medical
Startup Business Plan
Cyber Security
Dashboards
SWOT
Proposals
Education
Pitch Deck
Digital Marketing
KPIs
Project Management
Product Management
Artificial Intelligence
Target Market
Communication
Supply Chain
Google Slides
Research Services
 One Pagers
All Categories
-
Home
- Customer Favorites
- Resource Plan
Resource Plan

Performance Metrics Dashboard Of Procurement Department Download PDF
This slide provides an overview of the various KPIs tracked by the procurement department to determine the status. Major performance indicators covered are total, contracted and unlisted suppliers, rate of contract compliance, cycle time, total spending and savings. Slidegeeks has constructed Performance Metrics Dashboard Of Procurement Department Download PDF after conducting extensive research and examination. These presentation templates are constantly being generated and modified based on user preferences and critiques from editors. Here, you will find the most attractive templates for a range of purposes while taking into account ratings and remarks from users regarding the content. This is an excellent jumping off point to explore our content and will give new users an insight into our top notch PowerPoint Templates.

Procurement Dashboard To Measure Suppliers Performance Infographics PDF
This slide provides an overview of the procurement dashboard to determine vendors capacity for providing the right goods and services. The KPIs covered are defect rate, on-time supplies, supplier availability, delivery and lead time. This Procurement Dashboard To Measure Suppliers Performance Infographics PDF from Slidegeeks makes it easy to present information on your topic with precision. It provides customization options, so you can make changes to the colors, design, graphics, or any other component to create a unique layout. It is also available for immediate download, so you can begin using it right away. Slidegeeks has done good research to ensure that you have everything you need to make your presentation stand out. Make a name out there for a brilliant performance.
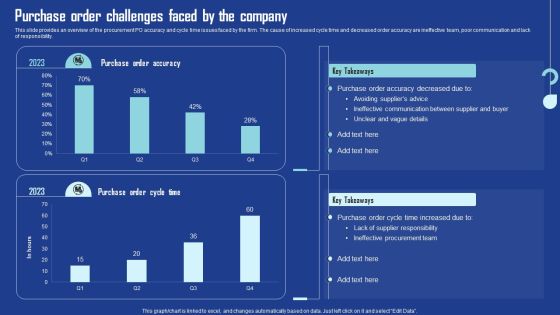
Purchase Order Challenges Faced By The Company Background PDF
This slide provides an overview of the procurement PO accuracy and cycle time issues faced by the firm. The cause of increased cycle time and decreased order accuracy are ineffective team, poor communication and lack of responsibility. Do you have to make sure that everyone on your team knows about any specific topic I yes, then you should give Purchase Order Challenges Faced By The Company Background PDF a try. Our experts have put a lot of knowledge and effort into creating this impeccable Purchase Order Challenges Faced By The Company Background PDF. You can use this template for your upcoming presentations, as the slides are perfect to represent even the tiniest detail. You can download these templates from the Slidegeeks website and these are easy to edit. So grab these today.
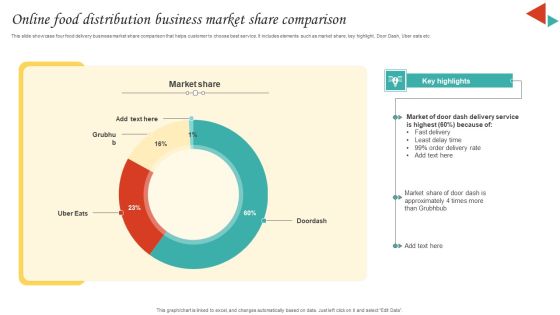
Online Food Distribution Business Market Share Comparison Diagrams PDF
This slide showcase four food delivery business market share comparison that helps customer to choose best service. It includes elements such as market share, key highlight, Door Dash, Uber eats etc. Showcasing this set of slides titled Online Food Distribution Business Market Share Comparison Diagrams PDF. The topics addressed in these templates are Market Share, Delivery Service, Least Delay Time. All the content presented in this PPT design is completely editable. Download it and make adjustments in color, background, font etc. as per your unique business setting.

Digital Service Delivery Market Size For Retail Sector Structure PDF
Mentioned slide demonstrates market size of automated services which can be used to determine organisation competitive advantage. It includes services such as supply chain management, demand forecasting, pricing, promotion, store management, etc. Showcasing this set of slides titled Digital Service Delivery Market Size For Retail Sector Structure PDF. The topics addressed in these templates are Services Market, Retail Sector, Automated Supply Chain. All the content presented in this PPT design is completely editable. Download it and make adjustments in color, background, font etc. as per your unique business setting.

Service Delivery Digital Market Size By Countries Demonstration PDF
Following slide demonstrates forecasted market size of service delivery automation by different countries which can be used by businesses to determine future opportunities. It includes various countries such as North America, Latin America, Europe, Asia pacific and south America. Pitch your topic with ease and precision using this Service Delivery Digital Market Size By Countries Demonstration PDF. This layout presents information on Global Service, Delivery Automation, Market Size Forecast. It is also available for immediate download and adjustment. So, changes can be made in the color, design, graphics or any other component to create a unique layout.

IOT Implementation Project Synopsis Report Summary PDF
This slide illustrate internet of thing project summary status to analyze project activities and make required changes. It includes elements such as project name, task, progress, health, timeline, updates etc. Pitch your topic with ease and precision using this IOT Implementation Project Synopsis Report Summary PDF. This layout presents information on Development Stage, Testing Stage, Implementation Stage. It is also available for immediate download and adjustment. So, changes can be made in the color, design, graphics or any other component to create a unique layout.

KPI Dashboard To Track Management Rate Throughout User Lifecycle Portrait PDF
This slide demonstrates KPI dashboard monitoring customer lifecycle to determine progress in customer response rate. It includes elements such as abandonment rate, response rate, engagement rate, response on popular topics and response on non popular topics. Showcasing this set of slides titled KPI Dashboard To Track Management Rate Throughout User Lifecycle Portrait PDF. The topics addressed in these templates are Customer Engagement, Response, Response Rate. All the content presented in this PPT design is completely editable. Download it and make adjustments in color, background, font etc. as per your unique business setting.

Statistics Highlighting Customer Management Lifecycle Stages Introduction PDF
Mentioned slide demonstrates customer lifecycle analysis to determine engagement rate in quarter 4. it includes customer lifecycle stages such as awareness, acquisition, activation, purchase, customer retention and referrals. Showcasing this set of slides titled Statistics Highlighting Customer Management Lifecycle Stages Introduction PDF. The topics addressed in these templates are Customer Lifecycle Analysis, Engagement Rate, Loyalty Customers. All the content presented in this PPT design is completely editable. Download it and make adjustments in color, background, font etc. as per your unique business setting.
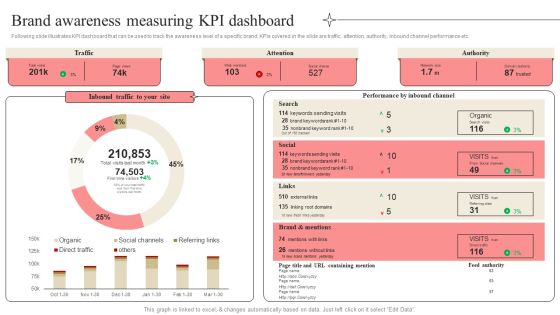
Developing Market Leading Businesses Brand Awareness Measuring KPI Dashboard Themes PDF
Following slide illustrates KPI dashboard that can be used to track the awareness level of a specific brand. KPIs covered in the slide are traffic, attention, authority, inbound channel performance etc. Are you in need of a template that can accommodate all of your creative concepts This one is crafted professionally and can be altered to fit any style. Use it with Google Slides or PowerPoint. Include striking photographs, symbols, depictions, and other visuals. Fill, move around, or remove text boxes as desired. Test out color palettes and font mixtures. Edit and save your work, or work with colleagues. Download Developing Market Leading Businesses Brand Awareness Measuring KPI Dashboard Themes PDF and observe how to make your presentation outstanding. Give an impeccable presentation to your group and make your presentation unforgettable.
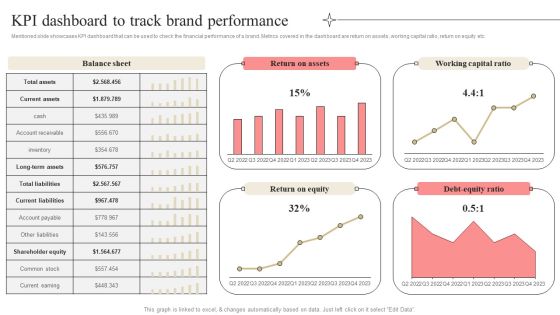
Developing Market Leading Businesses KPI Dashboard To Track Brand Performance Summary PDF
Mentioned slide showcases KPI dashboard that can be used to check the financial performance of a brand. Metrics covered in the dashboard are return on assets, working capital ratio, return on equity etc. Coming up with a presentation necessitates that the majority of the effort goes into the content and the message you intend to convey. The visuals of a PowerPoint presentation can only be effective if it supplements and supports the story that is being told. Keeping this in mind our experts created Developing Market Leading Businesses KPI Dashboard To Track Brand Performance Summary PDF to reduce the time that goes into designing the presentation. This way, you can concentrate on the message while our designers take care of providing you with the right template for the situation.
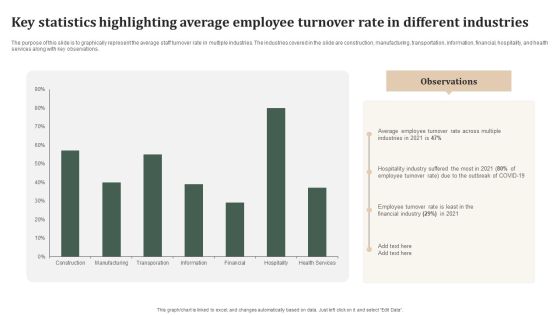
Key Statistics Highlighting Average Employee Turnover Rate In Different Industries Template PDF
The purpose of this slide is to graphically represent the average staff turnover rate in multiple industries. The industries covered in the slide are construction, manufacturing, transportation, information, financial, hospitality, and health services along with key observations. Here you can discover an assortment of the finest PowerPoint and Google Slides templates. With these templates, you can create presentations for a variety of purposes while simultaneously providing your audience with an eye catching visual experience. Download Key Statistics Highlighting Average Employee Turnover Rate In Different Industries Template PDF to deliver an impeccable presentation. These templates will make your job of preparing presentations much quicker, yet still, maintain a high level of quality. Slidegeeks has experienced researchers who prepare these templates and write high quality content for you. Later on, you can personalize the content by editing the Key Statistics Highlighting Average Employee Turnover Rate In Different Industries Template PDF.

Commodity Launch Kickoff Administration Playbook Product Launch Activities Structure PDF
This slide provides information regarding product launch team performance with key result area scores for idea generation, engineering and design and key result areas performance. Take your projects to the next level with our ultimate collection of Commodity Launch Kickoff Administration Playbook Product Launch Activities Structure PDF. Slidegeeks has designed a range of layouts that are perfect for representing task or activity duration, keeping track of all your deadlines at a glance. Tailor these designs to your exact needs and give them a truly corporate look with your own brand colors they will make your projects stand out from the rest.

Commodity Launch Kickoff Administration Playbook Product Launch Team Download PDF
This slide provides information regarding product launch team performance with key result area scores for idea generation, engineering and design and key result areas performance. Do you know about Slidesgeeks Commodity Launch Kickoff Administration Playbook Product Launch Team Download PDF These are perfect for delivering any kind od presentation. Using it, create PowerPoint presentations that communicate your ideas and engage audiences. Save time and effort by using our pre designed presentation templates that are perfect for a wide range of topic. Our vast selection of designs covers a range of styles, from creative to business, and are all highly customizable and easy to edit. Download as a PowerPoint template or use them as Google Slides themes.
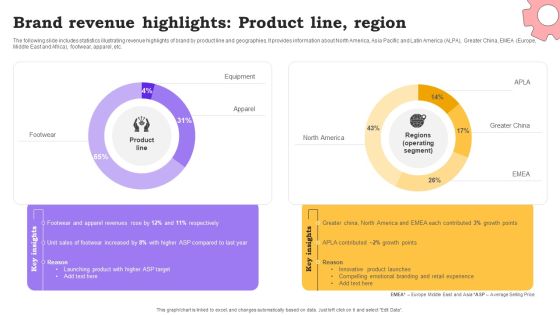
Marketing Commodities And Offerings Brand Revenue Highlights Product Line Region Designs PDF
The following slide includes statistics illustrating revenue highlights of brand by product line and geographies. It provides information about North America, Asia Pacific and Latin America ALPA, Greater China, EMEA Europe, Middle East and Africa, footwear, apparel, etc. Take your projects to the next level with our ultimate collection of Marketing Commodities And Offerings Brand Revenue Highlights Product Line Region Designs PDF. Slidegeeks has designed a range of layouts that are perfect for representing task or activity duration, keeping track of all your deadlines at a glance. Tailor these designs to your exact needs and give them a truly corporate look with your own brand colors they will make your projects stand out from the rest.
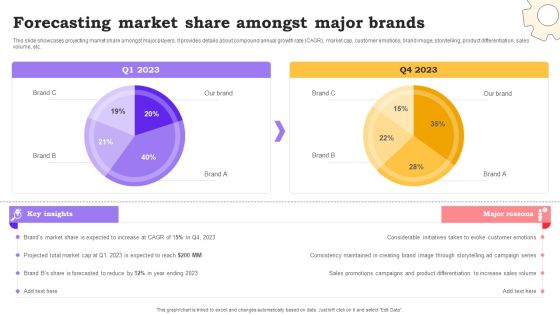
Marketing Commodities And Offerings Forecasting Market Share Amongst Major Brands Designs PDF
This slide showcases projecting market share amongst major players. It provides details about compound annual growth rate CAGR, market cap, customer emotions, brand image, storytelling, product differentiation, sales volume, etc. From laying roadmaps to briefing everything in detail, our templates are perfect for you. You can set the stage with your presentation slides. All you have to do is download these easy to edit and customizable templates. Marketing Commodities And Offerings Forecasting Market Share Amongst Major Brands Designs PDF will help you deliver an outstanding performance that everyone would remember and praise you for. Do download this presentation today.
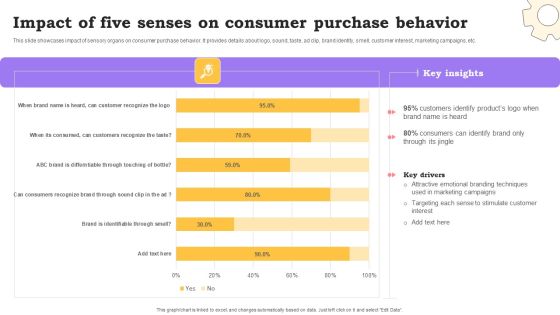
Marketing Commodities And Offerings Impact Of Five Senses On Consumer Purchase Behavior Guidelines PDF
This slide showcases impact of sensory organs on consumer purchase behavior. It provides details about logo, sound, taste, ad clip, brand identity, smell, customer interest, marketing campaigns, etc. Do you have an important presentation coming up Are you looking for something that will make your presentation stand out from the rest Look no further than Marketing Commodities And Offerings Impact Of Five Senses On Consumer Purchase Behavior Guidelines PDF. With our professional designs, you can trust that your presentation will pop and make delivering it a smooth process. And with Slidegeeks, you can trust that your presentation will be unique and memorable. So why wait Grab Marketing Commodities And Offerings Impact Of Five Senses On Consumer Purchase Behavior Guidelines PDF today and make your presentation stand out from the rest.

Occupational Health And Safety At Workplace Occupation Of Fatal And Injured Employees Introduction PDF
This slide highlights the occupation of fatal and injured employees on the organization which showcase machine operator, care worker, maintenance worker, plant operatives and emergency service worker. Here you can discover an assortment of the finest PowerPoint and Google Slides templates. With these templates, you can create presentations for a variety of purposes while simultaneously providing your audience with an eye catching visual experience. Download Occupational Health And Safety At Workplace Occupation Of Fatal And Injured Employees Introduction PDF to deliver an impeccable presentation. These templates will make your job of preparing presentations much quicker, yet still, maintain a high level of quality. Slidegeeks has experienced researchers who prepare these templates and write high quality content for you. Later on, you can personalize the content by editing the Occupational Health And Safety At Workplace Occupation Of Fatal And Injured Employees Introduction PDF.
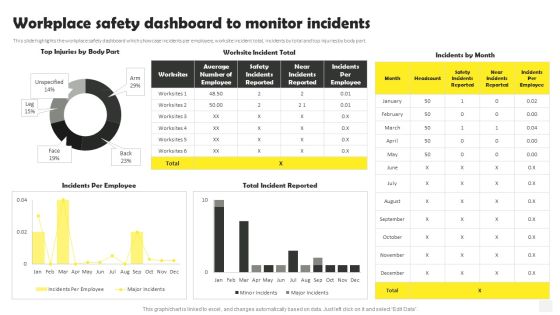
Occupational Health And Safety At Workplace Workplace Safety Dashboard To Monitor Incidents Inspiration PDF
This slide highlights the workplace safety dashboard which showcase incidents per employee, worksite incident total, incidents by total and top injuries by body part. Get a simple yet stunning designed Occupational Health And Safety At Workplace Workplace Safety Dashboard To Monitor Incidents Inspiration PDF. It is the best one to establish the tone in your meetings. It is an excellent way to make your presentations highly effective. So, download this PPT today from Slidegeeks and see the positive impacts. Our easy to edit Occupational Health And Safety At Workplace Workplace Safety Dashboard To Monitor Incidents Inspiration PDF can be your go to option for all upcoming conferences and meetings. So, what are you waiting for Grab this template today.
Leveraging Cloud For Project And Team Coordination Cloud Dashboard For Tracking Pictures PDF
The following slide depicts cloud dashboard for monitoring project sprints. It provides information about sprint blockers, resolved issues, under performers, sprint health, releases, sprint burndown, etc. Create an editable Leveraging Cloud For Project And Team Coordination Cloud Dashboard For Tracking Pictures PDF that communicates your idea and engages your audience. Whether you are presenting a business or an educational presentation, pre designed presentation templates help save time. Leveraging Cloud For Project And Team Coordination Cloud Dashboard For Tracking Pictures PDF is highly customizable and very easy to edit, covering many different styles from creative to business presentations. Slidegeeks has creative team members who have crafted amazing templates. So, go and get them without any delay.
Leveraging Cloud For Project And Team Coordination Tracking Progress Of Project Clipart PDF
The following slide illustrates task management tool for tracking project status. It provides information about requirements, coding, development, knowledge, user acceptance testing, standup meeting, etc. Present like a pro with Leveraging Cloud For Project And Team Coordination Tracking Progress Of Project Clipart PDF Create beautiful presentations together with your team, using our easy to use presentation slides. Share your ideas in real time and make changes on the fly by downloading our templates. So whether you are in the office, on the go, or in a remote location, you can stay in sync with your team and present your ideas with confidence. With Slidegeeks presentation got a whole lot easier. Grab these presentations today.
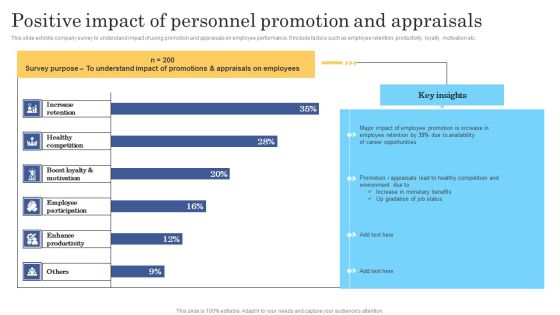
Positive Impact Of Personnel Promotion And Appraisals Clipart PDF
This slide exhibits company survey to understand impact of using promotion and appraisals on employee performance. It include factors such as employee retention, productivity, loyalty, motivation etc. Showcasing this set of slides titled Positive Impact Of Personnel Promotion And Appraisals Clipart PDF. The topics addressed in these templates are Opportunities, Employee, Key Insights. All the content presented in this PPT design is completely editable. Download it and make adjustments in color, background, font etc. as per your unique business setting.

Digital Terrorism Attack Trends On USA Ideas PDF
This slide shows cyber terrorism attack trends on USA organizations for decade to highlight importance of cyber security systems. It includes valuation of losses, categories of cyber attacks and victim companies etc. Showcasing this set of slides titled Digital Terrorism Attack Trends On USA Ideas PDF. The topics addressed in these templates are Key Insights, Internet, Digital Terrorism Attack Trends. All the content presented in this PPT design is completely editable. Download it and make adjustments in color, background, font etc. as per your unique business setting.
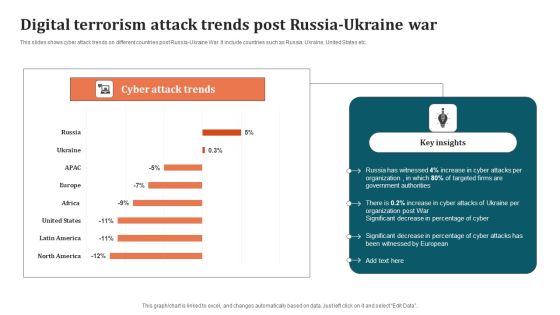
Digital Terrorism Attack Trends Post Russia Ukraine War Graphics PDF
This slides shows cyber attack trends on different countries post Russia-Ukraine War. It include countries such as Russia, Ukraine, United States etc. Pitch your topic with ease and precision using this Digital Terrorism Attack Trends Post Russia Ukraine War Graphics PDF. This layout presents information on Organization, Digital Terrorism Attack Trends. It is also available for immediate download and adjustment. So, changes can be made in the color, design, graphics or any other component to create a unique layout.

Digital Terrorism International Statistical Trends Brochure PDF
This slide shows International Statistical Trends of cyber terrorism at global level for building cyber security systems. It include statistics such as Global business attacks, International BYOD registrations etc. Showcasing this set of slides titled Digital Terrorism International Statistical Trends Brochure PDF. The topics addressed in these templates are International Businesses, Cyber Security Statistical Trends, Business Operations. All the content presented in this PPT design is completely editable. Download it and make adjustments in color, background, font etc. as per your unique business setting.

Benefits And Impact Of Presence Functionality Usage On Employee Productivity Ppt Slides Graphics Pictures PDF
Following slide displays informational stats about benefits of using presence functionality on employee productivity along with the impact stats of instant messaging software on the same. Find highly impressive Benefits And Impact Of Presence Functionality Usage On Employee Productivity Ppt Slides Graphics Pictures PDF on Slidegeeks to deliver a meaningful presentation. You can save an ample amount of time using these presentation templates. No need to worry to prepare everything from scratch because Slidegeeks experts have already done a huge research and work for you. You need to download Benefits And Impact Of Presence Functionality Usage On Employee Productivity Ppt Slides Graphics Pictures PDF for your upcoming presentation. All the presentation templates are 100 percent editable and you can change the color and personalize the content accordingly. Download now

Employee Occupancy And First Call Resolution Rate Ppt Professional Templates PDF
Following slide illustrates information about employee occupancy rate along with net promoter score, first call resolution rate and unresolved call rate. Are you in need of a template that can accommodate all of your creative concepts This one is crafted professionally and can be altered to fit any style. Use it with Google Slides or PowerPoint. Include striking photographs, symbols, depictions, and other visuals. Fill, move around, or remove text boxes as desired. Test out color palettes and font mixtures. Edit and save your work, or work with colleagues. Download Employee Occupancy And First Call Resolution Rate Ppt Professional Templates PDF and observe how to make your presentation outstanding. Give an impeccable presentation to your group and make your presentation unforgettable.

KPI Dashboard To Track Risk Events Ppt Layouts Format Ideas PDF
This slide displays KPI dashboard that can be used by a firm to track multiple risk events. Metrics covered in the dashboard are residual risks by period and risk category by total risk rating. Crafting an eye-catching presentation has never been more straightforward. Let your presentation shine with this tasteful yet straightforward KPI Dashboard To Track Risk Events Ppt Layouts Format Ideas PDF template. It offers a minimalistic and classy look that is great for making a statement. The colors have been employed intelligently to add a bit of playfulness while still remaining professional. Construct the ideal KPI Dashboard To Track Risk Events Ppt Layouts Format Ideas PDF that effortlessly grabs the attention of your audience Begin now and be certain to wow your customers
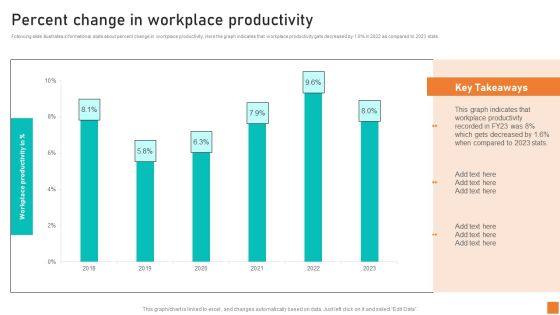
Percent Change In Workplace Productivity Ppt Summary Slide Portrait
Following slide illustrates informational stats about percent change in workplace productivity. Here the graph indicates that workplace productivity gets decreased by 1.6 percent in 2022 as compared to 2023 stats. Formulating a presentation can take up a lot of effort and time, so the content and message should always be the primary focus. The visuals of the PowerPoint can enhance the presenters message, so our Percent Change In Workplace Productivity Ppt Summary Slide Portrait was created to help save time. Instead of worrying about the design, the presenter can concentrate on the message while our designers work on creating the ideal templates for whatever situation is needed. Slidegeeks has experts for everything from amazing designs to valuable content, we have put everything into Percent Change In Workplace Productivity Ppt Summary Slide Portrait.

Sales Opportunity Monitoring Dashboard Ppt Professional Mockup PDF
This Sales Opportunity Monitoring Dashboard Ppt Professional Mockup PDF is perfect for any presentation, be it in front of clients or colleagues. It is a versatile and stylish solution for organizing your meetings. The Sales Opportunity Monitoring Dashboard Ppt Professional Mockup PDF features a modern design for your presentation meetings. The adjustable and customizable slides provide unlimited possibilities for acing up your presentation. Slidegeeks has done all the homework before launching the product for you. So, do not wait, grab the presentation templates today

Dashboard For Tracking Aftersales Customer Services Team Performance Portrait PDF
This slide covers the KPI dashboard for ticket tracking. It includes metrics such as tickets by month, service level, and details of customer service department agents. Retrieve professionally designed Dashboard For Tracking Aftersales Customer Services Team Performance Portrait PDF to effectively convey your message and captivate your listeners. Save time by selecting pre-made slideshows that are appropriate for various topics, from business to educational purposes. These themes come in many different styles, from creative to corporate, and all of them are easily adjustable and can be edited quickly. Access them as PowerPoint templates or as Google Slides themes. You do not have to go on a hunt for the perfect presentation because Slidegeeks got you covered from everywhere.

Impact Of Good Customer Experience On Loyalty Sample PDF
This slide covers the graphical representation of the effect of excellent support services on customer loyalty. It impacts the percentage of customers likely to purchase more, recommend the company, forgive a bad experience, etc. Slidegeeks has constructed Impact Of Good Customer Experience On Loyalty Sample PDF after conducting extensive research and examination. These presentation templates are constantly being generated and modified based on user preferences and critiques from editors. Here, you will find the most attractive templates for a range of purposes while taking into account ratings and remarks from users regarding the content. This is an excellent jumping-off point to explore our content and will give new users an insight into our top-notch PowerPoint Templates.
KPI Dashboard For Tracking Customer Retention Elements PDF
This slide covers the dashboard for analyzing customer loyalty with metrics such as NPS, loyal customer rate, premium users, CLV, customer churn, revenue churn, net retention, MRR growth, etc. Presenting this PowerPoint presentation, titled KPI Dashboard For Tracking Customer Retention Elements PDF, with topics curated by our researchers after extensive research. This editable presentation is available for immediate download and provides attractive features when used. Download now and captivate your audience. Presenting this KPI Dashboard For Tracking Customer Retention Elements PDF. Our researchers have carefully researched and created these slides with all aspects taken into consideration. This is a completely customizable KPI Dashboard For Tracking Customer Retention Elements PDF that is available for immediate downloading. Download now and make an impact on your audience. Highlight the attractive features available with our PPTs.

Determining Ideal Time To Send Personalized Emails Demonstration PDF
This slide showcases ideal time to send personalized email to different audience. It can help organization to increase the click through rate and click to open rates of emails. Create an editable Determining Ideal Time To Send Personalized Emails Demonstration PDF that communicates your idea and engages your audience. Whether you are presenting a business or an educational presentation, pre-designed presentation templates help save time. Determining Ideal Time To Send Personalized Emails Demonstration PDF is highly customizable and very easy to edit, covering many different styles from creative to business presentations. Slidegeeks has creative team members who have crafted amazing templates. So, go and get them without any delay.

Website Analytics Dashboard For Consumer Data Insights Clipart PDF
This slide showcases dashboard for website analytics that can help organization to gather data about visitors and formulate targeted marketing campaigns. It can also help to make individual and group buyer personas. Want to ace your presentation in front of a live audience Our Website Analytics Dashboard For Consumer Data Insights Clipart PDF can help you do that by engaging all the users towards you.. Slidegeeks experts have put their efforts and expertise into creating these impeccable powerpoint presentations so that you can communicate your ideas clearly. Moreover, all the templates are customizable, and easy-to-edit and downloadable. Use these for both personal and commercial use.

Consumer Partition Dashboard For Email Campaigns Infographics PDF
The following slide depicts a dashboard which can be used by marketers for sending targeted mails to customers and enhance customer retention. The key performing indicators are number of customers, average value or orders, number of orders, top ten percent customers etc. Showcasing this set of slides titled Consumer Partition Dashboard For Email Campaigns Infographics PDF. The topics addressed in these templates are Average Life Time Value, Average Value Of Orders, Returns, Average Number Of Orders. All the content presented in this PPT design is completely editable. Download it and make adjustments in color, background, font etc. as per your unique business setting.

Dashboard For Consumer Partition In Marketing Research Microsoft PDF
The following slide depicts a dashboard which can be used by business to conduct customer segmentation in research and make marketing offers accordingly. the key performing indicators are gender, age, user location, education level etc. Showcasing this set of slides titled Dashboard For Consumer Partition In Marketing Research Microsoft PDF. The topics addressed in these templates are General, Education And Job, Household. All the content presented in this PPT design is completely editable. Download it and make adjustments in color, background, font etc. as per your unique business setting.

Customer Attrition And Retention Analysis Dashboard Background PDF
This slide illustrates facts and figures related to customer retention and churn prediction. It includes customer churn, revenue churn, net revenue, MRR growth etc. Showcasing this set of slides titled Customer Attrition And Retention Analysis Dashboard Background PDF. The topics addressed in these templates are Net Promoter Score, Loyal Customers, Premium Users, Customer Churn, Revenue Churn. All the content presented in this PPT design is completely editable. Download it and make adjustments in color, background, font etc. as per your unique business setting.

Offline Media Channel Analysis Customer Survey Results Of Referral Marketing Pictures PDF
This slide provides an overview of a survey conducted for referral marketing campaigns. It showcases the percentage of people influenced by various sources. Are you in need of a template that can accommodate all of your creative concepts This one is crafted professionally and can be altered to fit any style. Use it with Google Slides or PowerPoint. Include striking photographs, symbols, depictions, and other visuals. Fill, move around, or remove text boxes as desired. Test out color palettes and font mixtures. Edit and save your work, or work with colleagues. Download Offline Media Channel Analysis Customer Survey Results Of Referral Marketing Pictures PDF and observe how to make your presentation outstanding. Give an impeccable presentation to your group and make your presentation unforgettable.

Offline Media Channel Analysis Lead Generation By Source In Traditional Marketing Formats PDF
This slide showcases current and estimated lead generation from traditional marketing. Major sources covered are print, outdoor, broadcasting, one-on-one and referral marketing. Crafting an eye-catching presentation has never been more straightforward. Let your presentation shine with this tasteful yet straightforward Offline Media Channel Analysis Lead Generation By Source In Traditional Marketing Formats PDF template. It offers a minimalistic and classy look that is great for making a statement. The colors have been employed intelligently to add a bit of playfulness while still remaining professional. Construct the ideal Offline Media Channel Analysis Lead Generation By Source In Traditional Marketing Formats PDF that effortlessly grabs the attention of your audience Begin now and be certain to wow your customers

Food Company Financial Performance Summary Business Revenue Generation By Geographical Area Elements PDF
The slide highlights the revenue generated from the USA and rest of the world in US dollar from 2019 to 2023. It showcases key insights describing revenue trend. Retrieve professionally designed Food Company Financial Performance Summary Business Revenue Generation By Geographical Area Elements PDF to effectively convey your message and captivate your listeners. Save time by selecting pre-made slideshows that are appropriate for various topics, from business to educational purposes. These themes come in many different styles, from creative to corporate, and all of them are easily adjustable and can be edited quickly. Access them as PowerPoint templates or as Google Slides themes. You do not have to go on a hunt for the perfect presentation because Slidegeeks got you covered from everywhere.

Food Company Financial Performance Summary Food Company Export Partners Share Background PDF
The following slide highlights the percentage share of food and other food-related products exported to different countries. The countries included are united states of America, Netherlands, France, Germany, Brazil, Belgium, Thailand, and India. Slidegeeks has constructed Food Company Financial Performance Summary Food Company Export Partners Share Background PDF after conducting extensive research and examination. These presentation templates are constantly being generated and modified based on user preferences and critiques from editors. Here, you will find the most attractive templates for a range of purposes while taking into account ratings and remarks from users regarding the content. This is an excellent jumping-off point to explore our content and will give new users an insight into our top-notch PowerPoint Templates.
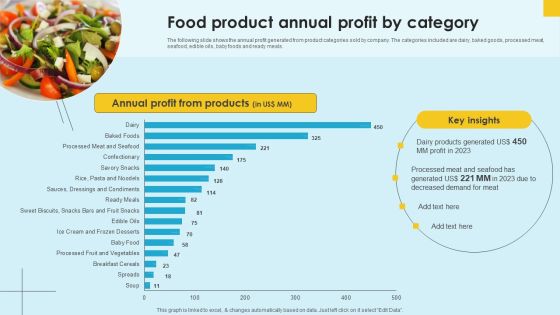
Food Company Financial Performance Summary Food Product Annual Profit By Category Formats PDF
The following slide shows the annual profit generated from product categories sold by company. The categories included are dairy, baked goods, processed meat, seafood, edible oils, baby foods and ready meals. Presenting this PowerPoint presentation, titled Food Company Financial Performance Summary Food Product Annual Profit By Category Formats PDF, with topics curated by our researchers after extensive research. This editable presentation is available for immediate download and provides attractive features when used. Download now and captivate your audience. Presenting this Food Company Financial Performance Summary Food Product Annual Profit By Category Formats PDF. Our researchers have carefully researched and created these slides with all aspects taken into consideration. This is a completely customizable Food Company Financial Performance Summary Food Product Annual Profit By Category Formats PDF that is available for immediate downloading. Download now and make an impact on your audience. Highlight the attractive features available with our PPTs.
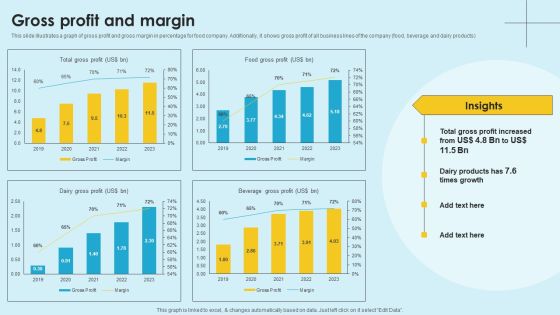
Food Company Financial Performance Summary Gross Profit And Margin Introduction PDF
This slide illustrates a graph of gross profit and gross margin in percentage for food company. Additionally, it shows gross profit of all business lines of the company food, beverage and dairy products. Here you can discover an assortment of the finest PowerPoint and Google Slides templates. With these templates, you can create presentations for a variety of purposes while simultaneously providing your audience with an eye-catching visual experience. Download Food Company Financial Performance Summary Gross Profit And Margin Introduction PDF to deliver an impeccable presentation. These templates will make your job of preparing presentations much quicker, yet still, maintain a high level of quality. Slidegeeks has experienced researchers who prepare these templates and write high-quality content for you. Later on, you can personalize the content by editing the Food Company Financial Performance Summary Gross Profit And Margin Introduction PDF.
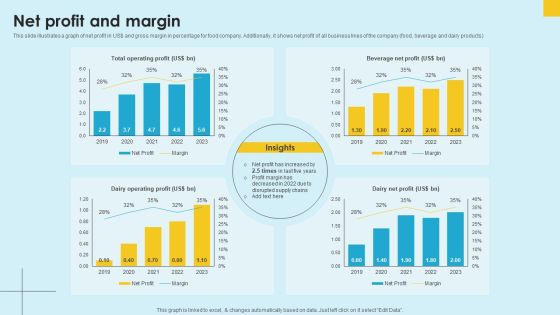
Food Company Financial Performance Summary Net Profit And Margin Professional PDF
This slide illustrates a graph of net profit in US dollar and gross margin in percentage for food company. Additionally, it shows net profit of all business lines of the company food, beverage and dairy products. Do you know about Slidesgeeks Food Company Financial Performance Summary Net Profit And Margin Professional PDF These are perfect for delivering any kind od presentation. Using it, create PowerPoint presentations that communicate your ideas and engage audiences. Save time and effort by using our pre-designed presentation templates that are perfect for a wide range of topic. Our vast selection of designs covers a range of styles, from creative to business, and are all highly customizable and easy to edit. Download as a PowerPoint template or use them as Google Slides themes.

Food Company Financial Performance Summary Operating Profit And Margin Topics PDF
This slide illustrates a graph of operating profit in US dollar and gross margin in percentage for food company. Additionally, it shows operating profit of all business lines of the company food, beverage and dairy products. Find a pre-designed and impeccable Food Company Financial Performance Summary Operating Profit And Margin Topics PDF. The templates can ace your presentation without additional effort. You can download these easy-to-edit presentation templates to make your presentation stand out from others. So, what are you waiting for Download the template from Slidegeeks today and give a unique touch to your presentation.

Food Company Financial Performance Summary Sales Contribution From Vegan Proteins Products Topics PDF
The following slide highlights the comparative assessment of vegan protein and traditional sales for multiple products. The products included are packaged products, snacks, nutritional beverages, frozen meals, frozen snacks, and pizza. Create an editable Food Company Financial Performance Summary Sales Contribution From Vegan Proteins Products Topics PDF that communicates your idea and engages your audience. Whether you are presenting a business or an educational presentation, pre-designed presentation templates help save time. Food Company Financial Performance Summary Sales Contribution From Vegan Proteins Products Topics PDF is highly customizable and very easy to edit, covering many different styles from creative to business presentations. Slidegeeks has creative team members who have crafted amazing templates. So, go and get them without any delay.

Print Advertising Survey Results Of Business For Print Advertising Portrait PDF
This slide provides an overview of the survey results obtained to identify the most trusted channel by people. The channels covered are print, TV, mail, radio, outdoor, video, social media, mobile, podcast and search engine advertising. This modern and well-arranged Print Advertising Survey Results Of Business For Print Advertising Portrait PDF provides lots of creative possibilities. It is very simple to customize and edit with the Powerpoint Software. Just drag and drop your pictures into the shapes. All facets of this template can be edited with Powerpoint, no extra software is necessary. Add your own material, put your images in the places assigned for them, adjust the colors, and then you can show your slides to the world, with an animated slide included.

Sales Employee Representative Performance Scorecard Dashboard For Healthcare Industry Clipart PDF
This slide showcases sales performance of healthcare products which can be used by managers to evaluate business achievements. It includes key components such as monthly sales comparison, sales performance of products by different channels, sales team performance. Pitch your topic with ease and precision using this Sales Employee Representative Performance Scorecard Dashboard For Healthcare Industry Clipart PDF. This layout presents information on Monthly Sales Comparison, Revenue By Previous Year, Sales Performance, Different Products, Different Channels, Sales Team Performance . It is also available for immediate download and adjustment. So, changes can be made in the color, design, graphics or any other component to create a unique layout.

Yearly Sales Employee Representative Performance Scorecard With Booking Price Summary PDF
Following slide highlights yearly sales performance assessment by various key performance metrics. It includes key metrics such as calls made, demos given, opportunities created, opportunities won and product booking price. Showcasing this set of slides titled Yearly Sales Employee Representative Performance Scorecard With Booking Price Summary PDF. The topics addressed in these templates are Calls Made, Demos Given, Opportunities Created, Opportunities Won, Product Booking Price. All the content presented in this PPT design is completely editable. Download it and make adjustments in color, background, font etc. as per your unique business setting.
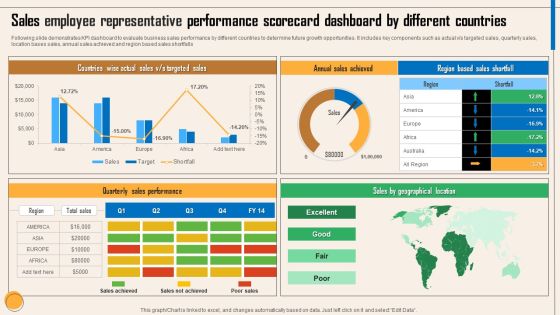
Sales Employee Representative Performance Scorecard Dashboard By Different Countries Themes PDF
Following slide demonstrates KPI dashboard to evaluate business sales performance by different countries to determine future growth opportunities. It includes key components such as actual v or s targeted sales, quarterly sales, location bases sales, annual sales achieved and region based sales shortfalls. Showcasing this set of slides titled Sales Employee Representative Performance Scorecard Dashboard By Different Countries Themes PDF. The topics addressed in these templates are Countries Wise Actual Sales, V Or S Targeted Sales, Annual Sales Achieved, Quarterly Sales Performance, Sales By Geographical Location. All the content presented in this PPT design is completely editable. Download it and make adjustments in color, background, font etc. as per your unique business setting.

Brand Recommendation Influence On Business Growth Diagrams PDF
Following slide demonstrates impact of brand endorsement on business market share to determine level of increased brand market share. This includes impacts on business such as leverage reputation, independent positioning, increase customer base and reduce. Pitch your topic with ease and precision using this Brand Recommendation Influence On Business Growth Diagrams PDF. This layout presents information on Leverage Reputation, Independent Positioning, Increase Customer Base, Customer Loyalty. It is also available for immediate download and adjustment. So, changes can be made in the color, design, graphics or any other component to create a unique layout.

Impact 1 Increased Customer Churn Rate And Support Tickets Summary PDF
This slide showcases the negative impact of customer onboarding challenges on the business. The challenges covered are increased user churn rate and number of onboarding support tickets. Create an editable Impact 1 Increased Customer Churn Rate And Support Tickets Summary PDF that communicates your idea and engages your audience. Whether you are presenting a business or an educational presentation, pre-designed presentation templates help save time. Impact 1 Increased Customer Churn Rate And Support Tickets Summary PDF is highly customizable and very easy to edit, covering many different styles from creative to business presentations. Slidegeeks has creative team members who have crafted amazing templates. So, go and get them without any delay.

Impact Of Efficient Customer Onboarding On Business Sample PDF
This slide showcases positive impact of proper customer onboarding process. It includes reduced customer churn rate and onboarding support tickets. Want to ace your presentation in front of a live audience Our Impact Of Efficient Customer Onboarding On Business Sample PDF can help you do that by engaging all the users towards you.. Slidegeeks experts have put their efforts and expertise into creating these impeccable powerpoint presentations so that you can communicate your ideas clearly. Moreover, all the templates are customizable, and easy-to-edit and downloadable. Use these for both personal and commercial use.

Annual Growth Comparison Of B2B Marketing Automation Microsoft PDF
The purpose of this slide is to show the statistical growth trend of marketing with the adoption of a process automation system along with the estimation of future revenue growth. Showcasing this set of slides titled Annual Growth Comparison Of B2B Marketing Automation Microsoft PDF. The topics addressed in these templates are Growing Technical, Automation Systems, Grew Gradually. All the content presented in this PPT design is completely editable. Download it and make adjustments in color, background, font etc. as per your unique business setting.

Big Data Global Market Revenue Annual Comparison Structure PDF
The purpose of this slide is to showcase a comprehensive overview of the international big data market evolution serving the most valuable contribution to revenue growth along with key insights. Pitch your topic with ease and precision using this Big Data Global Market Revenue Annual Comparison Structure PDF. This layout presents information on Market Revenues, Global Market, Growing Trend. It is also available for immediate download and adjustment. So, changes can be made in the color, design, graphics or any other component to create a unique layout.
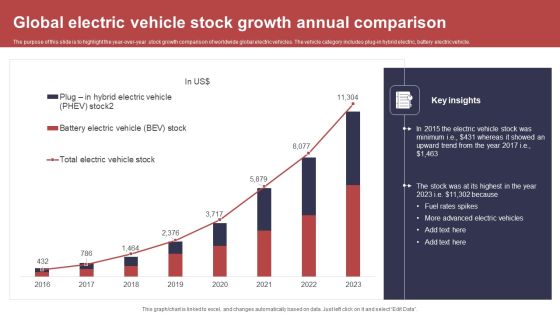
Global Electric Vehicle Stock Growth Annual Comparison Ideas PDF
The purpose of this slide is to highlight the year over year stock growth comparison of worldwide global electric vehicles. The vehicle category includes plug in hybrid electric, battery electric vehicle. Showcasing this set of slides titled Global Electric Vehicle Stock Growth Annual Comparison Ideas PDF. The topics addressed in these templates are Electric Vehicles, Stock Minimum, Highest. All the content presented in this PPT design is completely editable. Download it and make adjustments in color, background, font etc. as per your unique business setting.

Social Media Global Usage Year Over Year Comparison Professional PDF
The purpose of this slide is to showcase the utilization of social media marketing worldwide with an upward trend influenced by technical advancements. The years include 2013 2023 along with the key insights. Showcasing this set of slides titled Social Media Global Usage Year Over Year Comparison Professional PDF. The topics addressed in these templates are Social Media, Technological Advancement, Technical Innovations. All the content presented in this PPT design is completely editable. Download it and make adjustments in color, background, font etc. as per your unique business setting.
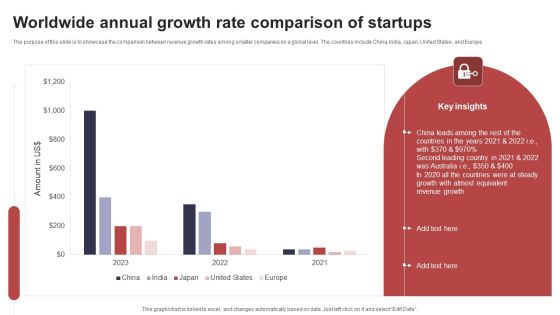
Worldwide Annual Growth Rate Comparison Of Startups Template PDF
The purpose of this slide is to showcase the comparison between revenue growth rates among smaller companies on a global level. The countries include China, India, Japan, United States, and Europe. Pitch your topic with ease and precision using this Worldwide Annual Growth Rate Comparison Of Startups Template PDF. This layout presents information on China Leads Among, Almost Equivalent, Revenue Growth. It is also available for immediate download and adjustment. So, changes can be made in the color, design, graphics or any other component to create a unique layout.
KPI Dashboard For Tracking Corporate Objectives Progress Template PDF
Following slide demonstrates progress tracking dashboard to determine objectives achieved by business. It includes elements such as objectives achieved, unachieved objectives, objectives achievement in progress and all objectives status. Showcasing this set of slides titled KPI Dashboard For Tracking Corporate Objectives Progress Template PDF. The topics addressed in these templates are Objectives Achieved, Unachieved Objectives, Objectives Progress . All the content presented in this PPT design is completely editable. Download it and make adjustments in color, background, font etc. as per your unique business setting.
