AI PPT Maker
Templates
PPT Bundles
Design Services
Business PPTs
Business Plan
Management
Strategy
Introduction PPT
Roadmap
Self Introduction
Timelines
Process
Marketing
Agenda
Technology
Medical
Startup Business Plan
Cyber Security
Dashboards
SWOT
Proposals
Education
Pitch Deck
Digital Marketing
KPIs
Project Management
Product Management
Artificial Intelligence
Target Market
Communication
Supply Chain
Google Slides
Research Services
 One Pagers
All Categories
-
Home
- Customer Favorites
- Resource Plan
Resource Plan
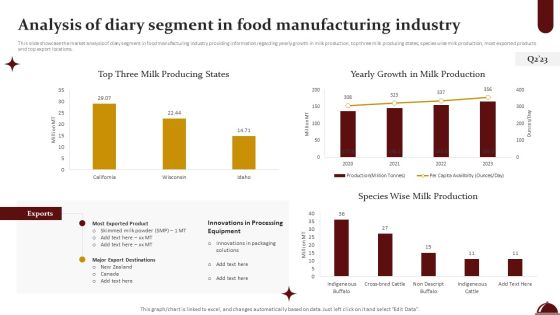
Food Processing Industry Latest Insights Trends And Analytics Analysis Of Diary Segment In Food Manufacturing Industry Mockup PDF
This slide showcase the market analysis of diary segment in food manufacturing industry providing information regarding yearly growth in milk production, top three milk producing states, species wise milk production, most exported products and top export locations. This Food Processing Industry Latest Insights Trends And Analytics Analysis Of Diary Segment In Food Manufacturing Industry Mockup PDF from Slidegeeks makes it easy to present information on your topic with precision. It provides customization options, so you can make changes to the colors, design, graphics, or any other component to create a unique layout. It is also available for immediate download, so you can begin using it right away. Slidegeeks has done good research to ensure that you have everything you need to make your presentation stand out. Make a name out there for a brilliant performance.

Food Processing Industry Latest Insights Trends And Analytics Analysis Of Meat Segment In Food Manufacturing Industry Inspiration PDF
This slide provides information regarding the market analysis of meat segment in food manufacturing industry in terms of leading states in meat production, species wise meat production, top exported products, opportunities in meat processing technology. Take your projects to the next level with our ultimate collection of Food Processing Industry Latest Insights Trends And Analytics Analysis Of Meat Segment In Food Manufacturing Industry Inspiration PDF. Slidegeeks has designed a range of layouts that are perfect for representing task or activity duration, keeping track of all your deadlines at a glance. Tailor these designs to your exact needs and give them a truly corporate look with your own brand colors they will make your projects stand out from the rest.
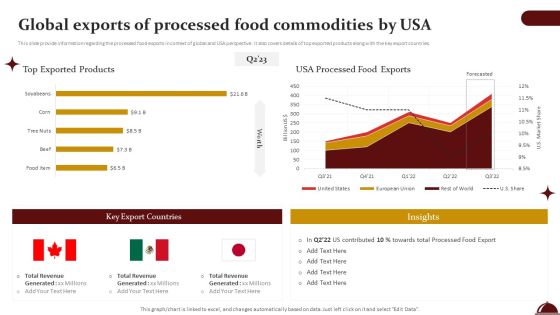
Food Processing Industry Latest Insights Trends And Analytics Global Exports Of Processed Food Commodities By USA Professional PDF
This slide provide information regarding the processed food exports in context of global and USA perspective. It also covers details of top exported products along with the key export countries. Do you know about Slidesgeeks Food Processing Industry Latest Insights Trends And Analytics Global Exports Of Processed Food Commodities By USA Professional PDF These are perfect for delivering any kind od presentation. Using it, create PowerPoint presentations that communicate your ideas and engage audiences. Save time and effort by using our pre designed presentation templates that are perfect for a wide range of topic. Our vast selection of designs covers a range of styles, from creative to business, and are all highly customizable and easy to edit. Download as a PowerPoint template or use them as Google Slides themes.
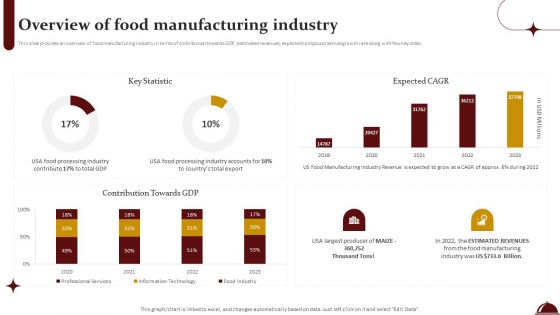
Food Processing Industry Latest Insights Trends And Analytics Overview Of Food Manufacturing Industry Download PDF
This slide provides an overview of food manufacturing industry in terms of contribution towards GDP, estimated revenues, expected compound annual growth rate along with few key stats. Do you have to make sure that everyone on your team knows about any specific topic I yes, then you should give Food Processing Industry Latest Insights Trends And Analytics Overview Of Food Manufacturing Industry Download PDF a try. Our experts have put a lot of knowledge and effort into creating this impeccable Food Processing Industry Latest Insights Trends And Analytics Overview Of Food Manufacturing Industry Download PDF. You can use this template for your upcoming presentations, as the slides are perfect to represent even the tiniest detail. You can download these templates from the Slidegeeks website and these are easy to edit. So grab these today.
Food Processing Industry Latest Insights Trends And Analytics Performance Monitoring Dashboard For Consumer Goods Icons PDF
This slide showcase the performance monitoring dashboard for consumer goods providing information regarding the overview of food and beverages sales, top selling products and on shelf availability. Get a simple yet stunning designed Food Processing Industry Latest Insights Trends And Analytics Performance Monitoring Dashboard For Consumer Goods Icons PDF. It is the best one to establish the tone in your meetings. It is an excellent way to make your presentations highly effective. So, download this PPT today from Slidegeeks and see the positive impacts. Our easy to edit Food Processing Industry Latest Insights Trends And Analytics Performance Monitoring Dashboard For Consumer Goods Icons PDF can be your go to option for all upcoming conferences and meetings. So, what are you waiting for Grab this template today.

Food Segments Contribution Towards Total Production And Global Export Topics PDF
This slide graphically provides information regarding the contribution of multiple food components such as meats, diary, grains and oil seeds, fruits and vegetables etc. towards total food production and global export. From laying roadmaps to briefing everything in detail, our templates are perfect for you. You can set the stage with your presentation slides. All you have to do is download these easy to edit and customizable templates. Food Segments Contribution Towards Total Production And Global Export Topics PDF will help you deliver an outstanding performance that everyone would remember and praise you for. Do download this presentation today.

Strategic FM Services Facilities Management Dashboard With Repair Services And Work Orders Infographics PDF
This slide highlights dashboard for facilities management services which includes tasks by work order type, task by status, lobs logged, repair services and priority work orders. Formulating a presentation can take up a lot of effort and time, so the content and message should always be the primary focus. The visuals of the PowerPoint can enhance the presenters message, so our Strategic FM Services Facilities Management Dashboard With Repair Services And Work Orders Infographics PDF was created to help save time. Instead of worrying about the design, the presenter can concentrate on the message while our designers work on creating the ideal templates for whatever situation is needed. Slidegeeks has experts for everything from amazing designs to valuable content, we have put everything into Strategic FM Services Facilities Management Dashboard With Repair Services And Work Orders Infographics PDF.

Strategic FM Services Facility Management Services Global Market Scenario Introduction PDF
This slide highlights the facility management services market share and future growth rate in graphical format which showcases product life cycle of different countries and organized and unorganized sector future growth rate. This modern and well arranged Strategic FM Services Facility Management Services Global Market Scenario Introduction PDF provides lots of creative possibilities. It is very simple to customize and edit with the Powerpoint Software. Just drag and drop your pictures into the shapes. All facets of this template can be edited with Powerpoint no extra software is necessary. Add your own material, put your images in the places assigned for them, adjust the colors, and then you can show your slides to the world, with an animated slide included.

Quarterly Performance Highlights Of Company Brochure PDF
The purpose of this slide is to showcase the snapshot of companys quarterly performance in terms of revenue generated, adjusted EBITDA, employee engagement activities conducted. It also contains details of the decline in companys growth by comparing its performance with the benchmark market indices. This Quarterly Performance Highlights Of Company Brochure PDF is perfect for any presentation, be it in front of clients or colleagues. It is a versatile and stylish solution for organizing your meetings. The Quarterly Performance Highlights Of Company Brochure PDF features a modern design for your presentation meetings. The adjustable and customizable slides provide unlimited possibilities for acing up your presentation. Slidegeeks has done all the homework before launching the product for you. So, do not wait, grab the presentation templates today.

Revenue Weekly Performance Report Dashboard Topics PDF
This slide displays the overall revenue that has been earned by an organization during a weekly performance report with the gross margin percent , total revenue , no. Of customers , etc. Showcasing this set of slides titled Revenue Weekly Performance Report Dashboard Topics PDF. The topics addressed in these templates are Gross Margin, Total Revenue, Customers. All the content presented in this PPT design is completely editable. Download it and make adjustments in color, background, font etc. as per your unique business setting.
Individuals Marketing Engagement Mapping Through Psychological Responses Icons PDF
This slide shows the response of individuals on articles shared on web and mapped. The various emotions that had great influence are awe, anger, laughter ,amusement ,joy ,empathy ,sadness, surprised. Showcasing this set of slides titled Individuals Marketing Engagement Mapping Through Psychological Responses Icons PDF. The topics addressed in these templates are Individuals Marketing, Engagement Mapping, Through Psychological Responses. All the content presented in this PPT design is completely editable. Download it and make adjustments in color, background, font etc. as per your unique business setting.

Senseable City Development Initiatives Survey Report Inspiration PDF
This slide illustrate survey report of 50 smart cities that implement initiatives to develop quality of living. It includes elements such as public transport connectivity, smart traffic management system, e waste management bins, CCTV surveillance etc. Showcasing this set of slides titledSenseable City Development Initiatives Survey Report Inspiration PDF. The topics addressed in these templates are Public Transport Connectivity, CCTV Surveillance, Smart Traffic Management . All the content presented in this PPT design is completely editable. Download it and make adjustments in color, background, font etc. as per your unique business setting.
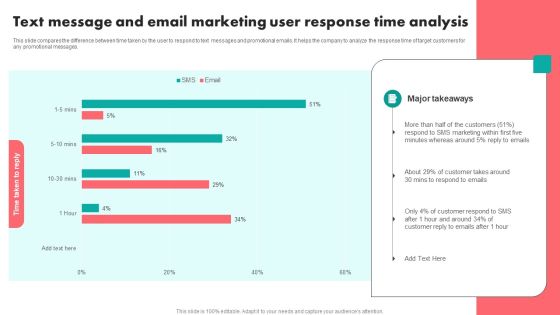
Text Message And Email Marketing User Response Time Analysis Template PDF
This slide compares the difference between time taken by the user to respond to text messages and promotional emails. It helps the company to analyze the response time of target customers for any promotional messages. Pitch your topic with ease and precision using this Text Message And Email Marketing User Response Time Analysis Template PDF. This layout presents information on Text Message, Email Marketing User, Response Time Analysis. It is also available for immediate download and adjustment. So, changes can be made in the color, design, graphics or any other component to create a unique layout.

Average Employee Compensation And Salary Dashboard Download PDF
The following slide showcases workforce compensation management dashboard to keep a track of benefits provided to employees. The dashboard includes employee count by salary range, workforce details and count by rating. Showcasing this set of slides titled Average Employee Compensation And Salary Dashboard Download PDF. The topics addressed in these templates are Average Employee Compensation, Salary Dashboard. All the content presented in this PPT design is completely editable. Download it and make adjustments in color, background, font etc. as per your unique business setting.

Average Sales Compensation And Salary Dashboard Introduction PDF
The following slide showcases compensation administration dashboard highlighting sales compensation. The dashboard further includes average monthly compensation per employee. Pitch your topic with ease and precision using this Average Sales Compensation And Salary Dashboard Introduction PDF. This layout presents information on Salary Dashboard, Average Sales Compensation. It is also available for immediate download and adjustment. So, changes can be made in the color, design, graphics or any other component to create a unique layout.

Compensation And Salary Dashboard With Estimated Income Ideas PDF
The following slide showcases dashboard highlighting employee compensation and performance analysis. The dashboard also includes credit, attainment and estimated earnings. Showcasing this set of slides titled Compensation And Salary Dashboard With Estimated Income Ideas PDF. The topics addressed in these templates are Performance Analysis, Compensation Analysis, Historical Performance Analysis. All the content presented in this PPT design is completely editable. Download it and make adjustments in color, background, font etc. as per your unique business setting.

Dashboard Showcasing Workforce Compensation And Salary By Department And Gender Microsoft PDF
The following slide showcases compensation review dashboard which includes salary breakdown, employees by gender, total departments and workforce, average performance score and sick days. Showcasing this set of slides titled Dashboard Showcasing Workforce Compensation And Salary By Department And Gender Microsoft PDF. The topics addressed in these templates are Dashboard Showcasing, Workforce Compensation. All the content presented in this PPT design is completely editable. Download it and make adjustments in color, background, font etc. as per your unique business setting.
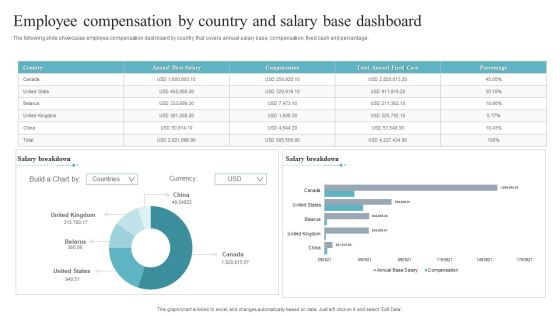
Employee Compensation By Country And Salary Base Dashboard Mockup PDF
The following slide showcases employee compensation dashboard by country that covers annual salary base, compensation, fixed cash and percentage. Pitch your topic with ease and precision using this Employee Compensation By Country And Salary Base Dashboard Mockup PDF. This layout presents information on Employee Compensation, Country Salary Base Dashboard. It is also available for immediate download and adjustment. So, changes can be made in the color, design, graphics or any other component to create a unique layout.
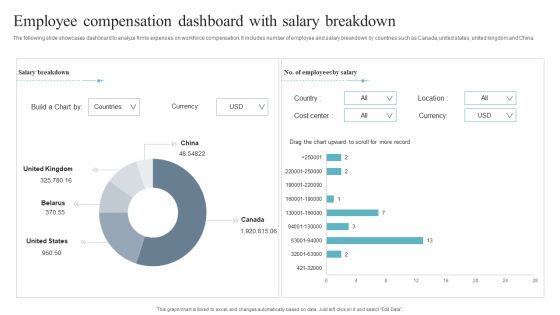
Employee Compensation Dashboard With Salary Breakdown Inspiration PDF
The following slide showcases dashboard to analyze firms expenses on workforce compensation. It includes number of employee and salary breakdown by countries such as Canada, united states, united kingdom and China. Showcasing this set of slides titled Employee Compensation Dashboard With Salary Breakdown Inspiration PDF. The topics addressed in these templates are Dashboard With Salary Breakdown, Employee Compensation. All the content presented in this PPT design is completely editable. Download it and make adjustments in color, background, font etc. as per your unique business setting.

Employee Compensation Salary By Gender And Designation Levels Dashboard Portrait PDF
The following slides showcases overview of compensation analytics dashboard that includes average male and female salary, headcount by gender and salary distribution. Pitch your topic with ease and precision using this Employee Compensation Salary By Gender And Designation Levels Dashboard Portrait PDF. This layout presents information on Employee Compensation Salary, Designation Levels Dashboard. It is also available for immediate download and adjustment. So, changes can be made in the color, design, graphics or any other component to create a unique layout.

Employee Payroll Compensation And Salary Dashboard With Expenses Professional PDF
The following slide showcases payroll and compensation dashboard to assist HR team analyze and track important KPIs. The dashboard depicts expenses , items processed and compensation comparison. Showcasing this set of slides titled Employee Payroll Compensation And Salary Dashboard With Expenses Professional PDF. The topics addressed in these templates are Employee Payroll Compensation, Salary Dashboard With Expenses. All the content presented in this PPT design is completely editable. Download it and make adjustments in color, background, font etc. as per your unique business setting.
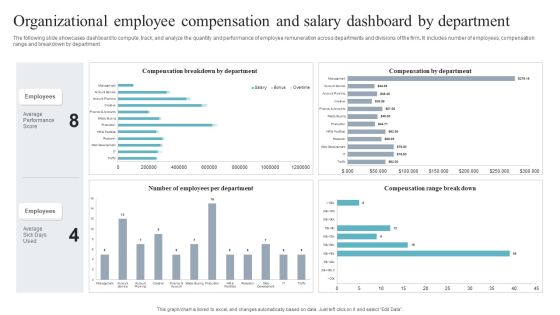
Organizational Employee Compensation And Salary Dashboard By Department Sample PDF
The following slide showcases dashboard to compute, track, and analyze the quantity and performance of employee remuneration across departments and divisions of the firm. It includes number of employees, compensation range and breakdown by department. Showcasing this set of slides titled Organizational Employee Compensation And Salary Dashboard By Department Sample PDF. The topics addressed in these templates are Organizational Employee Compensation, Salary Dashboard By Department. All the content presented in this PPT design is completely editable. Download it and make adjustments in color, background, font etc. as per your unique business setting.

Workforce Compensation And Salary Dashboard Brochure PDF
The following slide showcases compensation dashboard that highlights regular payroll tasks. The dashboard includes number of workforce, departments, average performance and sick days, headcount, salary breakdown and number of employees by salary. Pitch your topic with ease and precision using this Workforce Compensation And Salary Dashboard Brochure PDF. This layout presents information on Workforce Compensation, Salary Dashboard. It is also available for immediate download and adjustment. So, changes can be made in the color, design, graphics or any other component to create a unique layout.
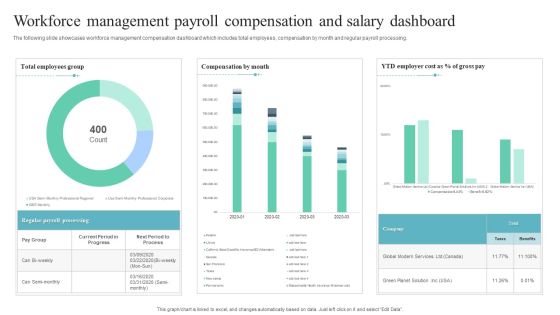
Workforce Management Payroll Compensation And Salary Dashboard Professional PDF
The following slide showcases workforce management compensation dashboard which includes total employees, compensation by month and regular payroll processing. Showcasing this set of slides titled Workforce Management Payroll Compensation And Salary Dashboard Professional PDF. The topics addressed in these templates are Workforce Management Payroll Compensation, Salary Dashboard. All the content presented in this PPT design is completely editable. Download it and make adjustments in color, background, font etc. as per your unique business setting.

Company Sales Employee Performance Measurement Dashboard Information PDF
This slide exhibits sales performance dashboard to analyze revenue and track business progress. It includes various indicators such as leads created, opportunities won, sales ratio and top revenue generating products. Showcasing this set of slides titled Company Sales Employee Performance Measurement Dashboard Information PDF. The topics addressed in these templates are Quick Ratio Target, Opportunities Won, Revenue Generating Products. All the content presented in this PPT design is completely editable. Download it and make adjustments in color, background, font etc. as per your unique business setting.

Department Salary Management Dashboard With Financial Summary Portrait PDF
The following slide highlights the department payroll management dashboard with financial summary illustrating key headings which includes company name, department name, payroll period, net pay employees, payment mode, net cash, employee tax and employer tax. Showcasing this set of slides titled Department Salary Management Dashboard With Financial Summary Portrait PDF. The topics addressed in these templates are Sales Department, Employee Tax, Financial Summary. All the content presented in this PPT design is completely editable. Download it and make adjustments in color, background, font etc. as per your unique business setting.

Personnel Salary Process Dashboard With Trend Brochure PDF
The following slide highlights the employee payroll process dashboard with trend illustrating key headings which includes payroll process status, status, payroll period, employees and payroll trend. Pitch your topic with ease and precision using this Personnel Salary Process Dashboard With Trend Brochure PDF. This layout presents information on Personnel Salary Process, Dashboard With Trend. It is also available for immediate download and adjustment. So, changes can be made in the color, design, graphics or any other component to create a unique layout.

Salary Management Dashboard For Origination Graphics PDF
The following slide highlights the payroll management dashboard for organization illustrating key headings which includes home, task to do, messages, last payroll and trends Pitch your topic with ease and precision using this Salary Management Dashboard For Origination Graphics PDF. This layout presents information on Salary Management Dashboard, Origination. It is also available for immediate download and adjustment. So, changes can be made in the color, design, graphics or any other component to create a unique layout.

Courier Service Delivery And Management Dashboard With Order Details Summary PDF
The purpose of this slide is to measure the services delivered by a courier company based on certain metrics. It includes pending orders, assigned orders to rider, third party courier and freelancers. Showcasing this set of slides titled Courier Service Delivery And Management Dashboard With Order Details Summary PDF. The topics addressed in these templates are Management Dashboard, Courier Service Delivery. All the content presented in this PPT design is completely editable. Download it and make adjustments in color, background, font etc. as per your unique business setting.

Food Service Delivery And Management Dashboard With Annual Sales Brochure PDF
This slide shows a food delivery company dashboard keeping track of all the orders or services delivered. Moreover, it covers KPIs such as total restaurants, registered users, weekly sales, total orders etc. Showcasing this set of slides titled Food Service Delivery And Management Dashboard With Annual Sales Brochure PDF. The topics addressed in these templates are Food Service Delivery, Management Dashboard, Annual Sales. All the content presented in this PPT design is completely editable. Download it and make adjustments in color, background, font etc. as per your unique business setting.
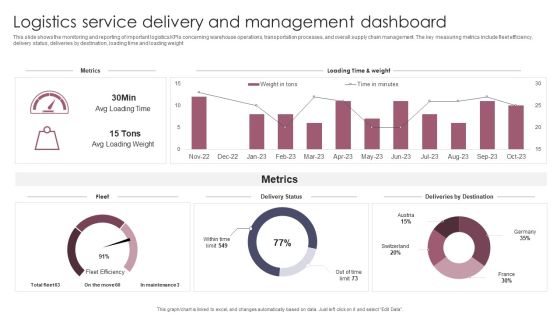
Logistics Service Delivery And Management Dashboard Introduction PDF
This slide shows the monitoring and reporting of important logistics KPIs concerning warehouse operations, transportation processes, and overall supply chain management. The key measuring metrics include fleet efficiency, delivery status, deliveries by destination, loading time and loading weight. Showcasing this set of slides titled Logistics Service Delivery And Management Dashboard Introduction PDF. The topics addressed in these templates are Logistics Service Delivery, Management Dashboard. All the content presented in this PPT design is completely editable. Download it and make adjustments in color, background, font etc. as per your unique business setting.

Supermarket Online Service Delivery And Management Dashboard Formats PDF
This slide shows the online grocery delivery dashboard of various products based on certain metrics and KPIs to achieve grocery retail revenue goals. It includes total orders, total customers total categories, and revenue. Showcasing this set of slides titled Supermarket Online Service Delivery And Management Dashboard Formats PDF. The topics addressed in these templates are Total Revenue, Total Customers, Dashboard. All the content presented in this PPT design is completely editable. Download it and make adjustments in color, background, font etc. as per your unique business setting.

Supply Chain Management Service Delivery And Management Dashboard Guidelines PDF
This slide shows an overview of the supply chain management delivery service to track the operationality of the overall process. It includes metrics such as on time deliveries, the average time to sell, and the out of stock rate. Pitch your topic with ease and precision using this Supply Chain Management Service Delivery And Management Dashboard Guidelines PDF. This layout presents information on Supply Chain Management, Service Delivery, Management Dashboard. It is also available for immediate download and adjustment. So, changes can be made in the color, design, graphics or any other component to create a unique layout.

Retail Inventory Management Kpi Dashboard Rules PDF
This slide gives overview of inventory management in retail industry showcasing expected date of order placed for top selling item, sales return by product category, average inventory value in FY 2022 and purchase order summary. Pitch your topic with ease and precision using this Retail Inventory Management Kpi Dashboard Rules PDF. This layout presents information on Retail Inventory Management, Dashboard. It is also available for immediate download and adjustment. So, changes can be made in the color, design, graphics or any other component to create a unique layout.
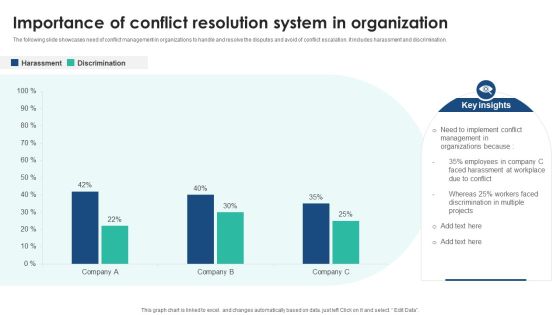
Importance Of Conflict Resolution System In Organization Demonstration PDF
The following slide showcases need of conflict management in organizations to handle and resolve the disputes and avoid of conflict escalation. It includes harassment and discrimination. Showcasing this set of slides titled Importance Of Conflict Resolution System In Organization Demonstration PDF. The topics addressed in these templates are Importance Of Conflict, Resolution System, Organization. All the content presented in this PPT design is completely editable. Download it and make adjustments in color, background, font etc. as per your unique business setting.

Preferred Conflict Resolution Styles In Organization Demonstration PDF
The following slide showcases preferred conflict management styles and their effectiveness in organizations. Main styles included are dominating, compromising, collaborating, accommodating and avoiding. Pitch your topic with ease and precision using this Preferred Conflict Resolution Styles In Organization Demonstration PDF. This layout presents information on Preferred Conflict, Resolution Styles, Organization. It is also available for immediate download and adjustment. So, changes can be made in the color, design, graphics or any other component to create a unique layout.

Effect Of Conflict Resolution On The Organization Functioning Pictures PDF
The following slide showcases graph representing the effects of conflict management on the organization. Key effects included are reduction in turnover, absenteeism, defects and increase in productivity, sales, profitability and customer satisfaction. Showcasing this set of slides titled Effect Of Conflict Resolution On The Organization Functioning Topics PDF. The topics addressed in these templates areEffect Of Conflict Resolution On The Organization Functioning Pictures PDF. All the content presented in this PPT design is completely editable. Download it and make adjustments in color, background, font etc. as per your unique business setting.
Operational Savings Due To Adoption Of Cloud Based Service Ppt Infographics Icons PDF
This slide depicts cloud spending corresponds with lower spending on traditional IT services. It includes saving on infrastructure outsourcing, contractors, systems integration, application outsourcing, technical consulting, etc. Showcasing this set of slides titled Operational Savings Due To Adoption Of Cloud Based Service Ppt Infographics Icons PDF. The topics addressed in these templates are Infrastructure Outsourcing Expenses, Traditional Services Reduced, Technical Consulting Expenses. All the content presented in this PPT design is completely editable. Download it and make adjustments in color, background, font etc. as per your unique business setting.
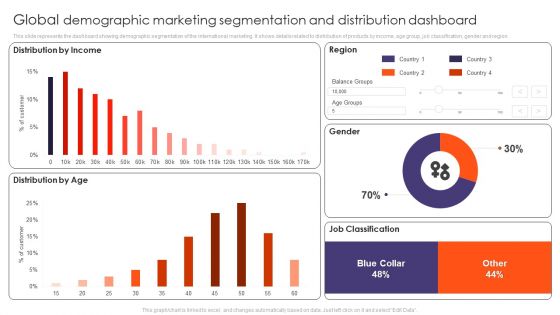
Global Demographic Marketing Segmentation And Distribution Dashboard Ppt Gallery Tips PDF
This slide represents the dashboard showing demographic segmentation of the international marketing. It shows details related to distribution of products by income, age group, job classification, gender and region. Pitch your topic with ease and precision using this Global Demographic Marketing Segmentation And Distribution Dashboard Ppt Gallery Tips PDF. This layout presents information on Distribution Income, Distribution Age, Region, Gender, Job Classification. It is also available for immediate download and adjustment. So, changes can be made in the color, design, graphics or any other component to create a unique layout.

Global Products Customer Segmentation Dashboard With Descriptions Ppt Styles Template PDF
This slide represents a dashboard showing the customer segmentation for an international product. It shows details related to total customers in each segments, segments description, characteristics and search customers by ID. Showcasing this set of slides titled Global Products Customer Segmentation Dashboard With Descriptions Ppt Styles Template PDF. The topics addressed in these templates are Total Customer, Each Segments, Segments Description, Search Customers. All the content presented in this PPT design is completely editable. Download it and make adjustments in color, background, font etc. as per your unique business setting.

Marketing Performance Dashboard With Analytics Campaign Ppt Infographics Background Images PDF
This slide represents dashboard for campaign performance analytics report. It covers total clicks, CTR, impressions , view-through conversions , total conversion, lead generation, activity per click etc to track campaign progress. Showcasing this set of slides titled Marketing Performance Dashboard With Analytics Campaign Ppt Infographics Background Images PDF. The topics addressed in these templates are Total Clicks, Total Impressions, Total Conversions, Activity Per Click. All the content presented in this PPT design is completely editable. Download it and make adjustments in color, background, font etc. as per your unique business setting.
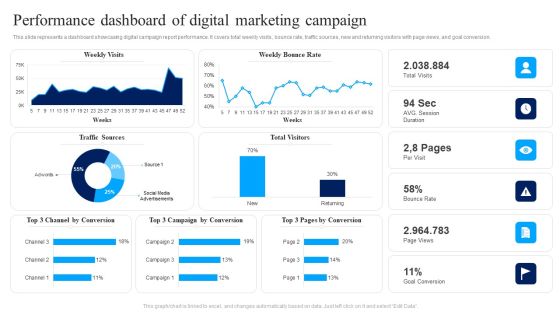
Performance Dashboard Of Digital Marketing Campaign Ppt Show Slide PDF
This slide represents a dashboard showcasing digital campaign report performance. It covers total weekly visits, bounce rate, traffic sources, new and returning visitors with page views, and goal conversion. Pitch your topic with ease and precision using this Performance Dashboard Of Digital Marketing Campaign Ppt Show Slide PDF. This layout presents information on Weekly Visits, Weekly Bounce Rate, Bounce Rate. It is also available for immediate download and adjustment. So, changes can be made in the color, design, graphics or any other component to create a unique layout.
You Tube Advertising Campaign Performance Analytics Dashboard Ppt Icon Diagrams PDF
This slide represents dashboard showing analytics of performance of you tube marketing campaign. It includes data related to no. of visitors, qualified leads, customers and annual recurring revenue, lifetime value, gross volume etc generated through the campaign. Showcasing this set of slides titled You Tube Advertising Campaign Performance Analytics Dashboard Ppt Icon Diagrams PDF. The topics addressed in these templates are Monthly Recurring Revenue, Bounce Rate, Customer Churn Rate. All the content presented in this PPT design is completely editable. Download it and make adjustments in color, background, font etc. as per your unique business setting.
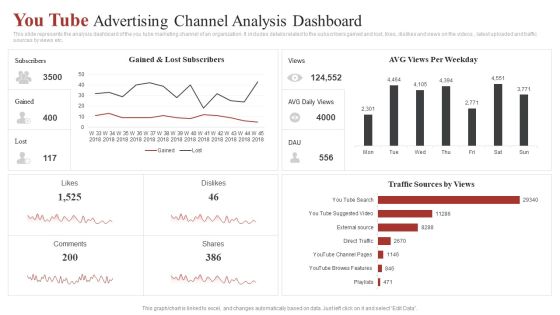
You Tube Advertising Channel Analysis Dashboard Ppt Gallery Clipart Images PDF
This slide represents the analysis dashboard of the you tube marketing channel of an organization. It includes details related to the subscribers gained and lost, likes, dislikes and views on the videos , latest uploaded and traffic sources by views etc. Pitch your topic with ease and precision using this You Tube Advertising Channel Analysis Dashboard Ppt Gallery Clipart Images PDF. This layout presents information on AVG Views, Per Weekday, Traffic Sources Views . It is also available for immediate download and adjustment. So, changes can be made in the color, design, graphics or any other component to create a unique layout.

You Tube Advertising Influence Survey On Different Age Groups Ppt Diagram Ppt PDF
This slide represents the survey conducted by an organization in order to study the influence or effect which the you tube marketing has on various age groups of the country. Pitch your topic with ease and precision using this You Tube Advertising Influence Survey On Different Age Groups Ppt Diagram Ppt PDF. This layout presents information on Larger Influence, You Tube Marketing, Young Generation. It is also available for immediate download and adjustment. So, changes can be made in the color, design, graphics or any other component to create a unique layout.

Kpi Dashboard To Track Performance Of Management Analyst Inspiration PDF
Following slide demonstrates KPI dashboard for monitoring monthly and annual performance of business process analyst to identify best talents. It includes elements such as individual performance, monthly department performance, performance by year and team wise performance rates. Showcasing this set of slides titled Kpi Dashboard To Track Performance Of Management Analyst Inspiration PDF. The topics addressed in these templates are Annual Business Process, Analyst Team Performance, Average Team. All the content presented in this PPT design is completely editable. Download it and make adjustments in color, background, font etc. as per your unique business setting.
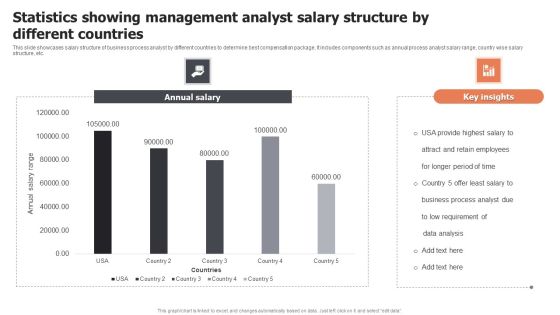
Statistics Showing Management Analyst Salary Structure By Different Countries Sample PDF
Pitch your topic with ease and precision using this Statistics Showing Management Analyst Salary Structure By Different Countries Sample PDF. This layout presents information on Annual Salary, Key Insights, USA Provide, Highest Salary. It is also available for immediate download and adjustment. So, changes can be made in the color, design, graphics or any other component to create a unique layout.
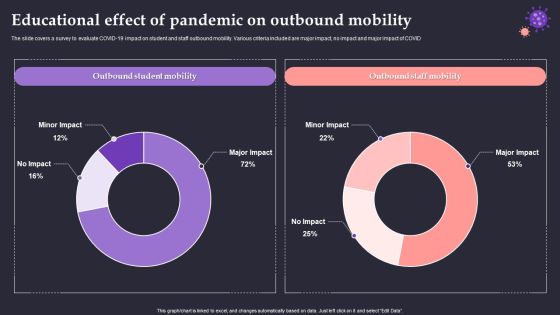
Educational Effect Of Pandemic On Outbound Mobility Elements PDF
The slide covers a survey to evaluate COVID-19 impact on student and staff outbound mobility. Various criteria included are major impact, no impact and major impact of COVID. Showcasing this set of slides titled Educational Effect Of Pandemic On Outbound Mobility Elements PDF. The topics addressed in these templates are Outbound Student Mobility, Outbound Staff Mobility, Minor Impact. All the content presented in this PPT design is completely editable. Download it and make adjustments in color, background, font etc. as per your unique business setting.
Effect Of Pandemic On Education By Global School Closures Icons PDF
The slide illustrates the impact of COVID-19 on schools worldwide to estimate the educational loss to learners. The data included is the number of learners impacted by COVID from march 25 to april 30, 2020. Pitch your topic with ease and precision using this Effect Of Pandemic On Education By Global School Closures Icons PDF. This layout presents information on Total Estimated, Localized Level Educational, Institutions Closure. It is also available for immediate download and adjustment. So, changes can be made in the color, design, graphics or any other component to create a unique layout.
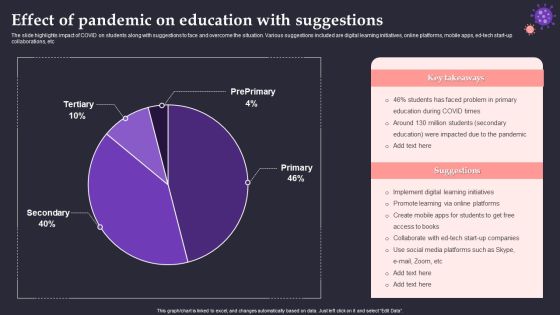
Effect Of Pandemic On Education With Suggestions Formats PDF
The slide highlights impact of COVID on students along with suggestions to face and overcome the situation. Various suggestions included are digital learning initiatives, online platforms, mobile apps, ed-tech start-up collaborations, etc. Showcasing this set of slides titled Effect Of Pandemic On Education With Suggestions Formats PDF. The topics addressed in these templates are Problem Primary, COVID Times, Digital Learning Initiatives. All the content presented in this PPT design is completely editable. Download it and make adjustments in color, background, font etc. as per your unique business setting.
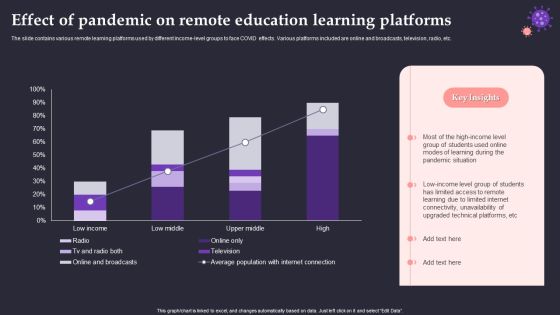
Effect Of Pandemic On Remote Education Learning Platforms Sample PDF
The slide contains various remote learning platforms used by different income-level groups to face COVID effects. Various platforms included are online and broadcasts, television, radio, etc. Pitch your topic with ease and precision using this Effect Of Pandemic On Remote Education Learning Platforms Sample PDF. This layout presents information on Pandemic Situation, High Income Level, Technical Platforms. It is also available for immediate download and adjustment. So, changes can be made in the color, design, graphics or any other component to create a unique layout.
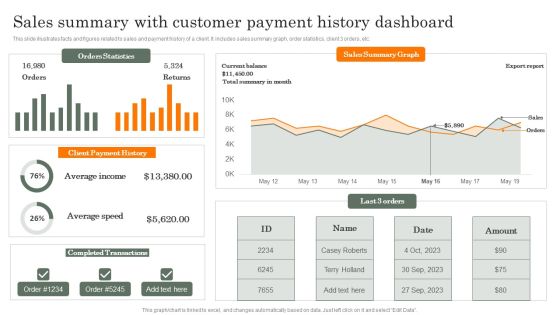
Sales Summary With Customer Payment History Dashboard Guidelines PDF
This slide illustrates facts and figures related to sales and payment history of a client. It includes sales summary graph, order statistics, client 3 orders, etc. Showcasing this set of slides titled Sales Summary With Customer Payment History Dashboard Guidelines PDF. The topics addressed in these templates are Average Income, Average Speed, Completed Transactions. All the content presented in this PPT design is completely editable. Download it and make adjustments in color, background, font etc. as per your unique business setting.

Administrative Dashboard For Customer Order History Formats PDF
This slide illustrates admin dashboard for facts and figures related to order history of a client. It includes total sales, payment by card, monthly expenditure, etc. Showcasing this set of slides titled Administrative Dashboard For Customer Order History Formats PDF. The topics addressed in these templates are Administrative, Dashboard For Customer, Order History. All the content presented in this PPT design is completely editable. Download it and make adjustments in color, background, font etc. as per your unique business setting.

Customer Business Account Transactions History Overview Dashboard Guidelines PDF
This slide illustrates transaction history of a clients business account. It includes last 5 days balance, monthly expenditure, transaction history, etc. Showcasing this set of slides titled Customer Business Account Transactions History Overview Dashboard Guidelines PDF. The topics addressed in these templates are Customer Business, Account Transactions, History Overview. All the content presented in this PPT design is completely editable. Download it and make adjustments in color, background, font etc. as per your unique business setting.

Dashboard For Skill Assessment During Leadership Recruitment Infographics PDF
The slide shows industry wise top skills that are assessed during leadership hiring. It includes skill assessment in hiring by different industries, average time taken in hiring, skill assessment tools in leadership hiring. Showcasing this set of slides titled Dashboard For Skill Assessment During Leadership Recruitment Infographics PDF. The topics addressed in these templates are Skill Assessment Tools, Skill Analysis. All the content presented in this PPT design is completely editable. Download it and make adjustments in color, background, font etc. as per your unique business setting.

Financial Data Revelation To Varied Stakeholders Composition Of Gross Revenue By Services And Region Slides PDF
This slide shows the composition of revenue and sales by regions such as America, China, Europe, etc. Create an editable Financial Data Revelation To Varied Stakeholders Composition Of Gross Revenue By Services And Region Slides PDF that communicates your idea and engages your audience. Whether you are presenting a business or an educational presentation, pre designed presentation templates help save time. Financial Data Revelation To Varied Stakeholders Composition Of Gross Revenue By Services And Region Slides PDF is highly customizable and very easy to edit, covering many different styles from creative to business presentations. Slidegeeks has creative team members who have crafted amazing templates. So, go and get them without any delay.
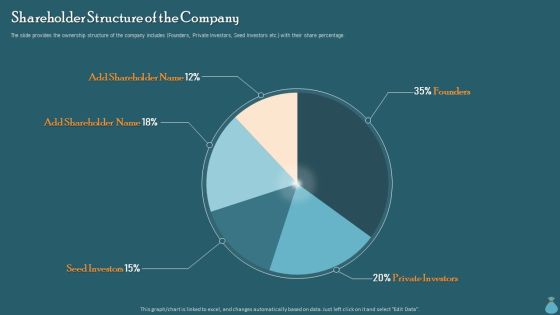
Financial Data Revelation To Varied Stakeholders Shareholder Structure Of The Company Microsoft PDF
The slide provides the ownership structure of the company includes Founders, Private Investors, Seed Investors etc. with their share percentage. Slidegeeks is here to make your presentations a breeze with Financial Data Revelation To Varied Stakeholders Shareholder Structure Of The Company Microsoft PDF With our easy to use and customizable templates, you can focus on delivering your ideas rather than worrying about formatting. With a variety of designs to choose from, you are sure to find one that suits your needs. And with animations and unique photos, illustrations, and fonts, you can make your presentation pop. So whether you are giving a sales pitch or presenting to the board, make sure to check out Slidegeeks first.

Financial Data Revelation To Varied Stakeholders Total Revenues And Net Income For Five Years Brochure PDF
This slide shows the Total Revenues and Net Income of ABC Corporation for five years In Million dollar Do you have an important presentation coming up Are you looking for something that will make your presentation stand out from the rest Look no further than Financial Data Revelation To Varied Stakeholders Total Revenues And Net Income For Five Years Brochure PDF. With our professional designs, you can trust that your presentation will pop and make delivering it a smooth process. And with Slidegeeks, you can trust that your presentation will be unique and memorable. So why wait Grab Financial Data Revelation To Varied Stakeholders Total Revenues And Net Income For Five Years Brochure PDF today and make your presentation stand out from the rest.
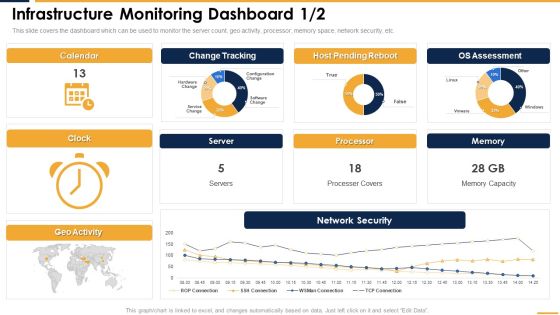
Infrastructure Monitoring Dashboard Structure PDF
This slide covers the dashboard which can be used to monitor the server count, geo activity, processor, memory space, network security, etc. Formulating a presentation can take up a lot of effort and time, so the content and message should always be the primary focus. The visuals of the PowerPoint can enhance the presenters message, so our Infrastructure Monitoring Dashboard Structure PDF was created to help save time. Instead of worrying about the design, the presenter can concentrate on the message while our designers work on creating the ideal templates for whatever situation is needed. Slidegeeks has experts for everything from amazing designs to valuable content, we have put everything into Infrastructure Monitoring Dashboard Structure PDF.

Infrastructure Visibility Into Application Server Performance Dashboard Structure PDF
This slide covers the dashboard which can be used to monitor server applications and business transactions of the organization. Coming up with a presentation necessitates that the majority of the effort goes into the content and the message you intend to convey. The visuals of a PowerPoint presentation can only be effective if it supplements and supports the story that is being told. Keeping this in mind our experts created Infrastructure Visibility Into Application Server Performance Dashboard Structure PDF to reduce the time that goes into designing the presentation. This way, you can concentrate on the message while our designers take care of providing you with the right template for the situation.
