AI PPT Maker
Templates
PPT Bundles
Design Services
Business PPTs
Business Plan
Management
Strategy
Introduction PPT
Roadmap
Self Introduction
Timelines
Process
Marketing
Agenda
Technology
Medical
Startup Business Plan
Cyber Security
Dashboards
SWOT
Proposals
Education
Pitch Deck
Digital Marketing
KPIs
Project Management
Product Management
Artificial Intelligence
Target Market
Communication
Supply Chain
Google Slides
Research Services
 One Pagers
All Categories
-
Home
- Customer Favorites
- Resource Plan
Resource Plan
Two Companies Comparison Chart With Sustainability Ppt PowerPoint Presentation Icon Model PDF
Showcasing this set of slides titled two companies comparison chart with sustainability ppt powerpoint presentation icon model pdf. The topics addressed in these templates are develop, leadership, sustainability. All the content presented in this PPT design is completely editable. Download it and make adjustments in color, background, font etc. as per your unique business setting.
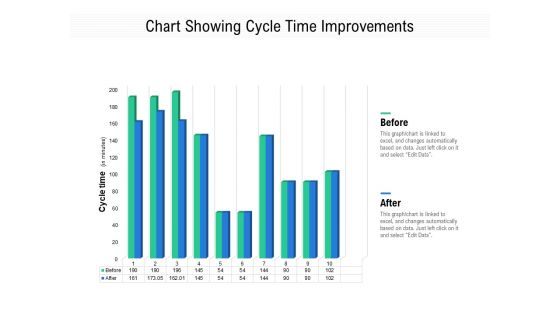
Chart Showing Cycle Time Improvements Ppt PowerPoint Presentation Infographic Template Rules PDF
Pitch your topic with ease and precision using this chart showing cycle time improvements ppt powerpoint presentation infographic template rules pdf. This layout presents information on before, after. It is also available for immediate download and adjustment. So, changes can be made in the color, design, graphics or any other component to create a unique layout.
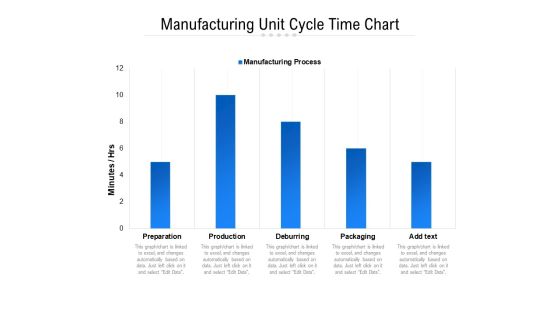
Manufacturing Unit Cycle Time Chart Ppt PowerPoint Presentation Visual Aids PDF
Showcasing this set of slides titled manufacturing unit cycle time chart ppt powerpoint presentation visual aids pdf. The topics addressed in these templates are preparation, production, deburring, packaging, manufacturing process. All the content presented in this PPT design is completely editable. Download it and make adjustments in color, background, font etc. as per your unique business setting.

Coronavirus Disease 19 Contagiousness Comparison Chart Ppt PowerPoint Presentation Professional Background Designs PDF
Pitch your topic with ease and precision using this coronavirus disease 19 contagiousness comparison chart ppt powerpoint presentation professional background designs pdf. This layout presents information on x values seasonal norovirus case fatality rate. It is also available for immediate download and adjustment. So, changes can be made in the color, design, graphics or any other component to create a unique layout.

Monthly Website Performance Analysis Chart Ppt PowerPoint Presentation Model Skills PDF
Pitch your topic with ease and precision using this monthly website performance analysis chart ppt powerpoint presentation model skills pdf. This layout presents information on visitor devices, maverage time, the breakdown, laptop, desktop, mobile. It is also available for immediate download and adjustment. So, changes can be made in the color, design, graphics or any other component to create a unique layout.

Monthly Website Performance Analysis Chart Ppt PowerPoint Presentation Ideas Master Slide PDF
Pitch your topic with ease and precision using this monthly website performance analysis chart ppt powerpoint presentation ideas master slide pdf. This layout presents information on visitor devices, website traffic trends, the breakdown, average time. It is also available for immediate download and adjustment. So, changes can be made in the color, design, graphics or any other component to create a unique layout.

Pie Chart Showing Product Classification Of A Business Ppt PowerPoint Presentation File Guide PDF
Pitch your topic with ease and precision using this pie chart showing product classification of a business ppt powerpoint presentation file guide pdf. This layout presents information on entertainment products, hardware products, software products. It is also available for immediate download and adjustment. So, changes can be made in the color, design, graphics or any other component to create a unique layout.

Chart Representing Digital Marketing Channel Mix Used For Promotion Ppt Icon Graphic Tips PDF
Showcasing this set of slides titled chart representing digital marketing channel mix used for promotion ppt icon graphic tips pdf. The topics addressed in these templates are email marketing, social media organic, paid search marketing. All the content presented in this PPT design is completely editable. Download it and make adjustments in color, background, font etc. as per your unique business setting.
Pie Chart Showing Three Phases Of Business Transformation Process Ppt PowerPoint Presentation Gallery Icon PDF
Showcasing this set of slides titled pie chart showing three phases of business transformation process ppt powerpoint presentation gallery icon pdf. The topics addressed in these templates are analysis phase, design phase, implementation phase. All the content presented in this PPT design is completely editable. Download it and make adjustments in color, background, font etc. as per your unique business setting.
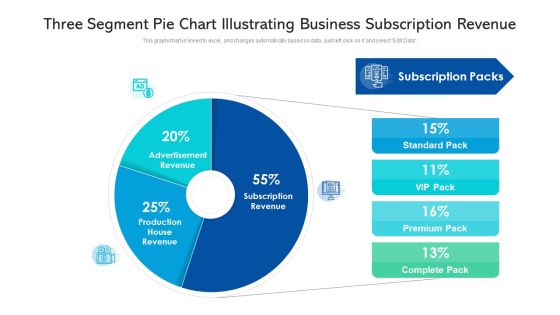
Three Segment Pie Chart Illustrating Business Subscription Revenue Ppt PowerPoint Presentation File Slideshow PDF
Showcasing this set of slides titled three segment pie chart illustrating business subscription revenue ppt powerpoint presentation file slideshow pdf. The topics addressed in these templates are advertisement revenue, production house revenue, subscription revenue. All the content presented in this PPT design is completely editable. Download it and make adjustments in color, background, font etc. as per your unique business setting.

Financial Chart Showing Business Life Cycle Ppt PowerPoint Presentation Gallery Designs PDF
Introducing our financial chart showing business life cycle ppt powerpoint presentation gallery designs pdf set of slides. The topics discussed in these slides are sales, profits, business. This is an immediately available PowerPoint presentation that can be conveniently customized. Download it and convince your audience.

Business Chart Showing Consumer Satisfaction Level Ppt PowerPoint Presentation Slides Guidelines PDF
Showcasing this set of slides titled business chart showing consumer satisfaction level ppt powerpoint presentation slides guidelines pdf. The topics addressed in these templates are dissatisfied, satisfied, services quality. All the content presented in this PPT design is completely editable. Download it and make adjustments in color, background, font etc. as per your unique business setting.
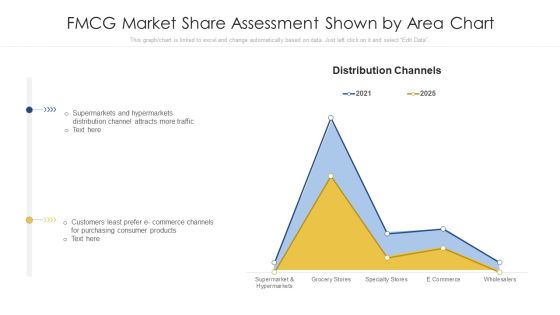
Fmcg Market Share Assessment Shown By Area Chart Ppt PowerPoint Presentation Show Infographic Template PDF
Showcasing this set of slides titled fmcg market share assessment shown by area chart ppt powerpoint presentation show infographic template pdf. The topics addressed in these templates are hypermarkets distribution, purchasing consumer products, distribution channels. All the content presented in this PPT design is completely editable. Download it and make adjustments in color, background, font etc. as per your unique business setting.

Bar Chart With Percentage Of Weekly Product Sales Ppt PowerPoint Presentation File Clipart Images PDF
Showcasing this set of slides titled bar chart with percentage of weekly product sales ppt powerpoint presentation file clipart images pdf. The topics addressed in these templates are . All the content presented in this PPT design is completely editable. Download it and make adjustments in color, background, font etc. as per your unique business setting.

Operational Process Improvement Dashboard With RACI Chart And Action Timeline Metric Designs PDF
Deliver an awe inspiring pitch with this creative operational process improvement dashboard with raci chart and action timeline metric designs pdf bundle. Topics like metric, target, quality, customer can be discussed with this completely editable template. It is available for immediate download depending on the needs and requirements of the user.

Operational Process Improvement Dashboard With RACI Chart And Action Timeline Target Summary PDF
Deliver and pitch your topic in the best possible manner with this operational process improvement dashboard with raci chart and action timeline target summary pdf. Use them to share invaluable insights on quality, metrics, customer and impress your audience. This template can be altered and modified as per your expectations. So, grab it now.
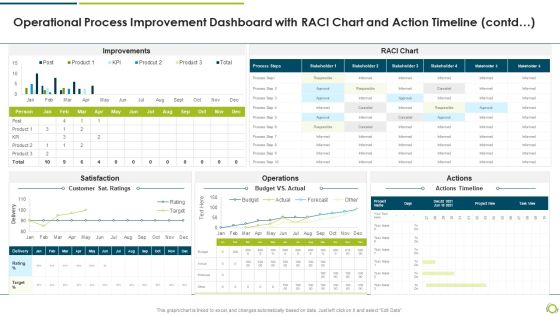
Operational Process Improvement Dashboard With RACI Chart And Action Timeline Contd Mockup PDF
Deliver and pitch your topic in the best possible manner with this operational process improvement dashboard with raci chart and action timeline contd mockup pdf. Use them to share invaluable insights on Satisfaction, operations, actions and impress your audience. This template can be altered and modified as per your expectations. So, grab it now.
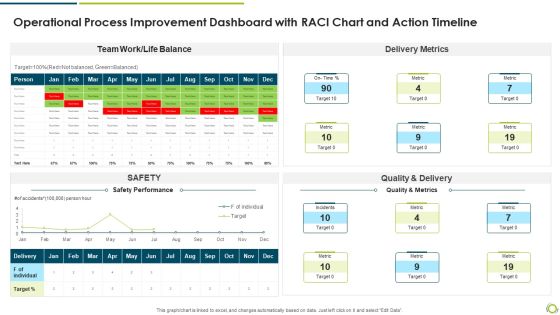
Operational Process Improvement Dashboard With RACI Chart And Action Timeline Themes PDF
Deliver an awe inspiring pitch with this creative operational process improvement dashboard with raci chart and action timeline themes pdf bundle. Topics like quality and delivery, delivery metrics, safety performance can be discussed with this completely editable template. It is available for immediate download depending on the needs and requirements of the user.

Bar Chart Representing Latest Labor Market Trend In 2022 Ppt PowerPoint Presentation File Objects PDF
Showcasing this set of slides titled bar chart representing latest labor market trend in 2022 ppt powerpoint presentation file objects pdf. The topics addressed in these templates are university, college, trades, high school, less than high school. All the content presented in this PPT design is completely editable. Download it and make adjustments in color, background, font etc. as per your unique business setting.

Quality Of Talent Scorecard With Employee Performance Bar Chart Formats PDF
Deliver an awe inspiring pitch with this creative Quality Of Talent Scorecard With Employee Performance Bar Chart Formats PDF bundle. Topics like Technical Skills, Communication Skills, Selling Skills can be discussed with this completely editable template. It is available for immediate download depending on the needs and requirements of the user.
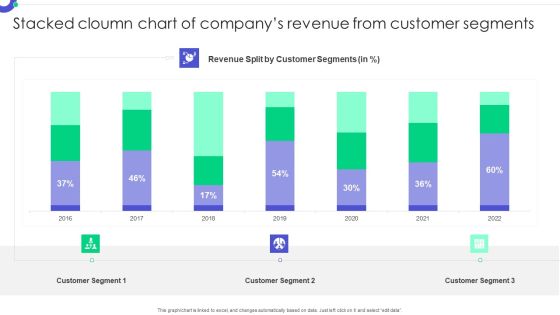
Stacked Cloumn Chart Of Companys Revenue From Customer Segments Mockup PDF
Showcasing this set of slides titled Stacked Cloumn Chart Of Companys Revenue From Customer Segments Mockup PDF. The topics addressed in these templates are Customer Segments, Revenue Split, Customer Segment. All the content presented in this PPT design is completely editable. Download it and make adjustments in color, background, font etc. as per your unique business setting.
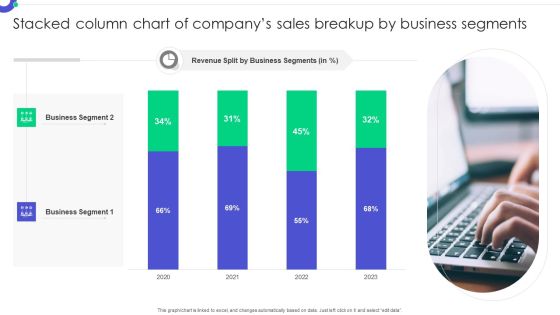
Stacked Column Chart Of Companys Sales Breakup By Business Segments Rules PDF
Pitch your topic with ease and precision using this Stacked Column Chart Of Companys Sales Breakup By Business Segments Rules PDF. This layout presents information on Business Segment, Revenue Split, Business Segments. It is also available for immediate download and adjustment. So, changes can be made in the color, design, graphics or any other component to create a unique layout.

Stacked Column Chart Of Product Sold By A Healthcare Company Download PDF
Pitch your topic with ease and precision using this Stacked Column Chart Of Product Sold By A Healthcare Company Download PDF. This layout presents information on Sales Split Products, Medical Product, Healthcare Company. It is also available for immediate download and adjustment. So, changes can be made in the color, design, graphics or any other component to create a unique layout.

Customer Churn Rate Projection For Next Five Years Ppt Layouts Influencers PDF
This slide provides the five years projection 2021 2025 of the companys customer churn rate along with the key strategic reasons behind the sudden decrease in the churn rate. Deliver and pitch your topic in the best possible manner with this customer churn rate projection for next five years ppt layouts influencers pdf. Use them to share invaluable insights on implementing, software, process, rate, techniques and impress your audience. This template can be altered and modified as per your expectations. So, grab it now.
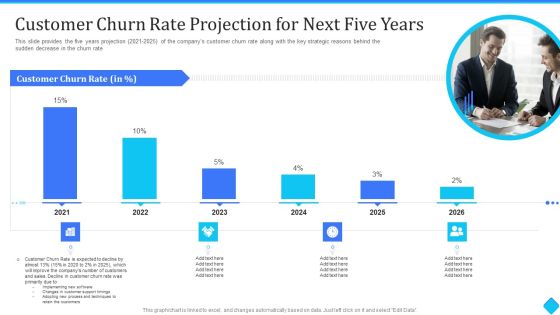
User Onboarding Process Development Customer Churn Rate Projection For Next Five Years Summary PDF
This slide provides the five years projection 2021-2025 of the companys customer churn rate along with the key strategic reasons behind the sudden decrease in the churn rate. Deliver an awe-inspiring pitch with this creative User Onboarding Process Development Customer Churn Rate Projection For Next Five Years Summary PDF bundle. Topics like customer churn rate, customers and sales, process and techniques can be discussed with this completely editable template. It is available for immediate download depending on the needs and requirements of the user.

Causes Of Low Sales Of The Company Ppt Layouts Show PDF
This slide shows that the latest marketing techniques are the triggers of a decrease in consumer satisfaction and retention rate from last year to this year. Thus, customer satisfaction rate fell by 30 percent and customer retention rate dropped by 45 percent. Deliver an awe inspiring pitch with this creative causes of low sales of the company ppt layouts show pdf bundle. Topics like customer retention, direct selling, customer satisfaction can be discussed with this completely editable template. It is available for immediate download depending on the needs and requirements of the user.
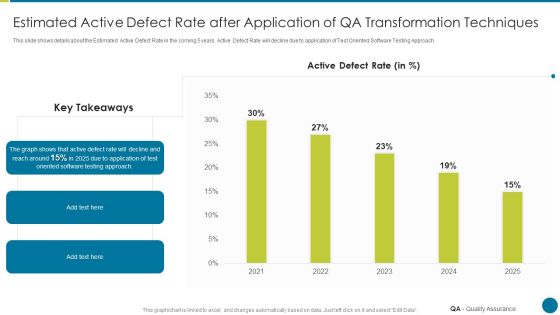
QA Modification For Product Quality Development And Consumer Satisfaction Estimated Active Defect Rate Slides PDF
This slide shows details about the Estimated Active Defect Rate in the coming 5 years. Active Defect Rate will decline due to application of Test Oriented Software Testing Approach. Deliver an awe inspiring pitch with this creative qa modification for product quality development and consumer satisfaction estimated active defect rate slides pdf bundle. Topics like estimated active defect rate after application of qa transformation techniques can be discussed with this completely editable template. It is available for immediate download depending on the needs and requirements of the user.

Sales Promotion Of Upgraded Product Through Upselling Causes Of Low Sales Of The Company Infographics PDF
This slide shows that the latest marketing techniques are the triggers of a decrease in consumer satisfaction and retention rate from last year to this year. Thus, customer satisfaction rate fell by 30 percent and customer retention rate dropped by 45 percent. Deliver an awe inspiring pitch with this creative sales promotion of upgraded product through upselling causes of low sales of the company infographics pdf bundle. Topics like direct selling, through internet can be discussed with this completely editable template. It is available for immediate download depending on the needs and requirements of the user.

Deploying Quality Assurance QA Transformation Estimated Active Defect Rate After Application Icons PDF
This slide shows details about the estimated active defect rate in the coming 5 years. Active defect rate will decline due to application of test oriented software testing approach.Deliver an awe inspiring pitch with this creative Deploying Quality Assurance QA Transformation Estimated Active Defect Rate After Application Icons PDF bundle. Topics like Estimated Active Defect Rate After Application Of QA Transformation Techniques can be discussed with this completely editable template. It is available for immediate download depending on the needs and requirements of the user.
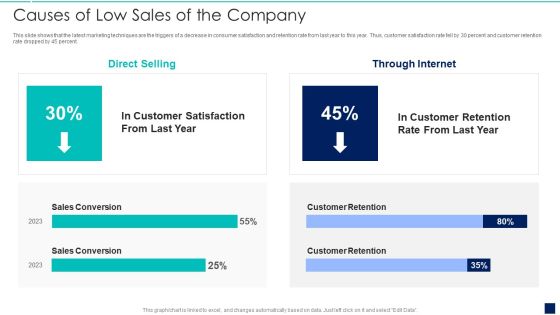
Influence Buyers To Purchase Additional High Causes Of Low Sales Of The Company Topics PDF
This slide shows that the latest marketing techniques are the triggers of a decrease in consumer satisfaction and retention rate from last year to this year. Thus, customer satisfaction rate fell by 30 percent and customer retention rate dropped by 45 percent.Deliver an awe inspiring pitch with this creative Influence Buyers To Purchase Additional High Causes Of Low Sales Of The Company Topics PDF bundle. Topics like Sales Conversion, Customer Retention, Direct Selling can be discussed with this completely editable template. It is available for immediate download depending on the needs and requirements of the user.
Sales Process Automation For Revenue Growth Decline In Sales Volume For Past 4 Years Icons PDF
This slide shows the decline in sales volume for past 4 years due to multiple reasons such as poor sales forecasting, minimal sales training, fails in sales prospecting, outdated marketing techniques, etc.Deliver an awe inspiring pitch with this creative Sales Process Automation For Revenue Growth Decline In Sales Volume For Past 4 Years Icons PDF bundle. Topics like Lost Opportunities, Pipeline By Territory, Sales By Product can be discussed with this completely editable template. It is available for immediate download depending on the needs and requirements of the user.

Latest Digital Marketing Trend Analysis Statistical Template PDF
This slide represents the graph showing the latest trends in the field of digital marketing. It includes trends such as content marketing, AI and machine learning, marketing automation, big data, CRO and improving website experiences, social media marketing etc. Deliver an awe inspiring pitch with this creative Latest Digital Marketing Trend Analysis Statistical Template PDF bundle. Topics like Business Growth, Content Marketing, Technique can be discussed with this completely editable template. It is available for immediate download depending on the needs and requirements of the user.
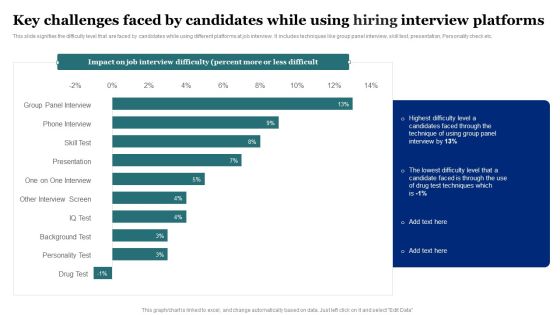
Key Challenges Faced By Candidates While Using Hiring Interview Platforms Rules PDF
This slide signifies the difficulty level that are faced by candidates while using different platforms at job interview. It includes techniques like group panel interview, skill test, presentation, Personality check etc. Pitch your topic with ease and precision using this Key Challenges Faced By Candidates While Using Hiring Interview Platforms Rules PDF. This layout presents information on Group Panel Interview, Phone Interview, Skill Test, Presentation. It is also available for immediate download and adjustment. So, changes can be made in the color, design, graphics or any other component to create a unique layout.
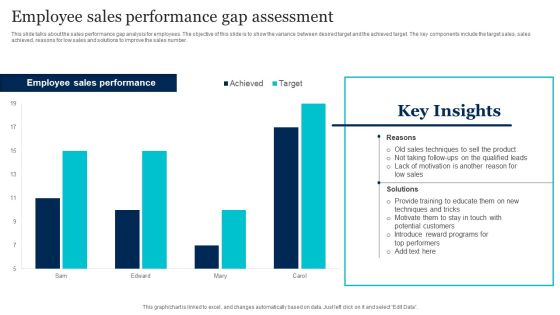
Employee Sales Performance Gap Assessment Template PDF
This slide talks about the sales performance gap analysis for employees. The objective of this slide is to show the variance between desired target and the achieved target. The key components include the target sales, sales achieved, reasons for low sales and solutions to improve the sales number. Showcasing this set of slides titled Employee Sales Performance Gap Assessment Template PDF. The topics addressed in these templates are Sales Techniques, Low Sales, Potential Customers. All the content presented in this PPT design is completely editable. Download it and make adjustments in color, background, font etc. as per your unique business setting.

Inbound And Outbound Marketing Tactics Impact After Implementing Inbound Outbound Summary PDF
This slide showcases the impact after implementing inbound and outbound marketing techniques. It includes impact on satisfaction rate, conversion rate, website traffic and profit. Want to ace your presentation in front of a live audience Our Inbound And Outbound Marketing Tactics Impact After Implementing Inbound Outbound Summary PDF can help you do that by engaging all the users towards you. Slidegeeks experts have put their efforts and expertise into creating these impeccable powerpoint presentations so that you can communicate your ideas clearly. Moreover, all the templates are customizable, and easy to edit and downloadable. Use these for both personal and commercial use.
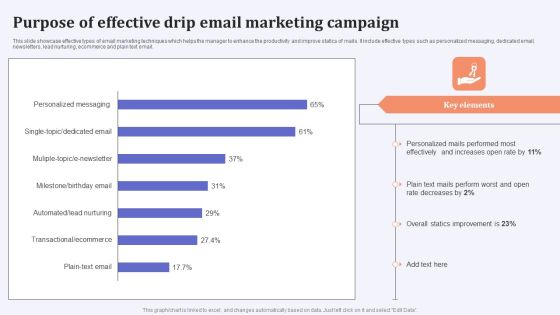
Purpose Of Effective Drip Email Marketing Campaign Brochure PDF
This slide showcase effective types of email marketing techniques which helps the manager to enhance the productivity and improve statics of mails. It include effective types such as personalized messaging, dedicated email, newsletters, lead nurturing, ecommerce and plain text email. Showcasing this set of slides titled Purpose Of Effective Drip Email Marketing Campaign Brochure PDF. The topics addressed in these templates are Personalized Mails, Rate Decreases, Overall Statics Improvement. All the content presented in this PPT design is completely editable. Download it and make adjustments in color, background, font etc. as per your unique business setting.
Business Process Flow Diagram Examples With Profit PowerPoint Templates Ppt Backgrounds For Slides
We present our business process flow diagram examples with profit PowerPoint templates PPT backgrounds for slides.Present our People PowerPoint Templates because Our PowerPoint Templates and Slides are aesthetically designed to attract attention. We gaurantee that they will grab all the eyeballs you need. Present our Globe PowerPoint Templates because Our PowerPoint Templates and Slides will let Your superior ideas hit the target always and everytime. Download and present our Success PowerPoint Templates because You are an avid believer in ethical practices. Highlight the benefits that accrue with our PowerPoint Templates and Slides. Use our Shapes PowerPoint Templates because Your ideas provide food for thought. Our PowerPoint Templates and Slides will help you create a dish to tickle the most discerning palate. Download and present our Business PowerPoint Templates because Our PowerPoint Templates and Slides will embellish your thoughts. See them provide the desired motivation to your team.Use these PowerPoint slides for presentations relating to 3d, Accounting, Advertising, Arrow, Bar, Business, Character, Computer, Concept, Diagram, Fast, Finance, Forecast, Gesture, Goal, Graph, Growth Chart, Hands, Human, Illustration, Income, Increase, Investment, Isolated, Marketing, Offer, People, Person, Present, Presentation, Profit, Progress, Render, Rise, Sale, Showing, Sign, Standing, Statistic, Successful, Up. The prominent colors used in the PowerPoint template are Blue light, Gray, White. PowerPoint presentation experts tell us our business process flow diagram examples with profit PowerPoint templates PPT backgrounds for slides are incredible easy to use. Professionals tell us our Computer PowerPoint templates and PPT Slides provide great value for your money. Be assured of finding the best projection to highlight your words. People tell us our business process flow diagram examples with profit PowerPoint templates PPT backgrounds for slides effectively help you save your valuable time. Presenters tell us our Business PowerPoint templates and PPT Slides are readymade to fit into any presentation structure. Professionals tell us our business process flow diagram examples with profit PowerPoint templates PPT backgrounds for slides are designed to make your presentations professional. We assure you our Bar PowerPoint templates and PPT Slides are topically designed to provide an attractive backdrop to any subject.

Manufacturing Operation Quality Improvement Practices Tools Templates Objectives And Key Results Of Manufacturing Information PDF
Purpose of the following slide is to show the objectives and key results that are expected to gain from the process of managing the manufacturing process. Presenting manufacturing operation quality improvement practices tools templates objectives and key results of manufacturing information pdf to provide visual cues and insights. Share and navigate important information on five stages that need your due attention. This template can be used to pitch topics like executive objectives, business strategies, project objectives, scope, results. In addtion, this PPT design contains high resolution images, graphics, etc, that are easily editable and available for immediate download.
Tips To Reduce HR Attrition Structure PDF
This slide provides various strategies to business managers for reducing employee turnover in order to save cost of recruiting and training new employees. Key elements covered are challenge, effect, strategy and result. Showcasing this set of slides titled Tips To Reduce HR Attrition Structure PDF. The topics addressed in these templates are Strategy, Reduced Productivity, Lack Of Career Growth. All the content presented in this PPT design is completely editable. Download it and make adjustments in color, background, font etc. as per your unique business setting.

Chart Of Four Business Steps Powerpoint Templates
This business diagram displays flow of four business steps. This editable slide is suitable to present growth management. Use this diagram for business and finance related topics and display complete data analysis in your presentation.
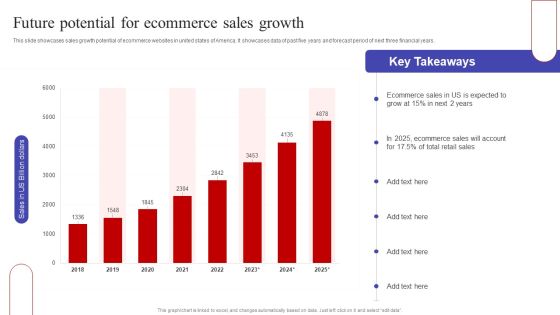
Future Potential For Ecommerce Sales Growth Ppt PowerPoint Presentation Diagram Graph Charts PDF
This slide showcases sales growth potential of ecommerce websites in united states of America. It showcases data of past five years and forecast period of next three financial years. Here you can discover an assortment of the finest PowerPoint and Google Slides templates. With these templates, you can create presentations for a variety of purposes while simultaneously providing your audience with an eye catching visual experience. Download Future Potential For Ecommerce Sales Growth Ppt PowerPoint Presentation Diagram Graph Charts PDF to deliver an impeccable presentation. These templates will make your job of preparing presentations much quicker, yet still, maintain a high level of quality. Slidegeeks has experienced researchers who prepare these templates and write high quality content for you. Later on, you can personalize the content by editing the Future Potential For Ecommerce Sales Growth Ppt PowerPoint Presentation Diagram Graph Charts PDF.

Nestle Performance Management Report Pie Chart Ppt Ideas Graphics Example PDF
This graph or chart is linked to excel, and changes automatically based on data. Just left click on it and select Edit Data. Are you in need of a template that can accommodate all of your creative concepts This one is crafted professionally and can be altered to fit any style. Use it with Google Slides or PowerPoint. Include striking photographs, symbols, depictions, and other visuals. Fill, move around, or remove text boxes as desired. Test out color palettes and font mixtures. Edit and save your work, or work with colleagues. Download Nestle Performance Management Report Pie Chart Ppt Ideas Graphics Example PDF and observe how to make your presentation outstanding. Give an impeccable presentation to your group and make your presentation unforgettable.

Problems Related To Current Product Positioning Ppt PowerPoint Presentation Diagram Graph Charts PDF
This slide highlights the problems related to current product positioning which showcases in graphical format depicting downgrading product sales and changing consumer trends. Do you have an important presentation coming up Are you looking for something that will make your presentation stand out from the rest Look no further than Problems Related To Current Product Positioning Ppt PowerPoint Presentation Diagram Graph Charts PDF. With our professional designs, you can trust that your presentation will pop and make delivering it a smooth process. And with Slidegeeks, you can trust that your presentation will be unique and memorable. So why wait Grab Problems Related To Current Product Positioning Ppt PowerPoint Presentation Diagram Graph Charts PDF today and make your presentation stand out from the rest

Data Driven Chart For Workers Turnover Assessment In Various Sectors Ppt PowerPoint Presentation Layouts Demonstration PDF
Presenting this set of slides with name data driven chart for workers turnover assessment in various sectors ppt powerpoint presentation layouts demonstration pdf. The topics discussed in these slides are share of workers quitting position annually, share of workers let go annually, leisure and hospitality, food services, manufacturing, construction. This is a completely editable PowerPoint presentation and is available for immediate download. Download now and impress your audience.

Famous Technology Trends Charts With Multichannel Analytics Ppt PowerPoint Presentation Ideas Graphics Tutorials PDF
Pitch your topic with ease and precision using this famous technology trends charts with multichannel analytics ppt powerpoint presentation ideas graphics tutorials pdf. This layout presents information on multichannel analytics, content marketing, paid media, social media marketing, email marketing . It is also available for immediate download and adjustment. So, changes can be made in the color, design, graphics or any other component to create a unique layout.
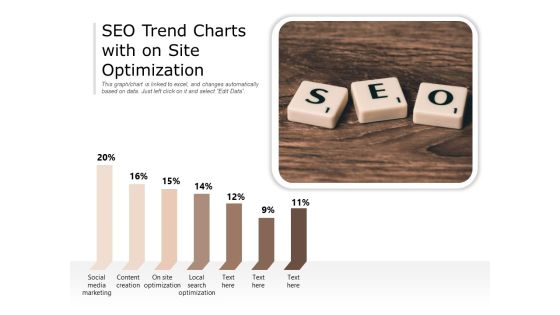
SEO Trend Charts With On Site Optimization Ppt PowerPoint Presentation Gallery Inspiration PDF
Pitch your topic with ease and precision using this seo trend charts with on site optimization ppt powerpoint presentation gallery inspiration pdf. This layout presents information on social media marketing, content creation, site optimization, local search optimization. It is also available for immediate download and adjustment. So, changes can be made in the color, design, graphics or any other component to create a unique layout.
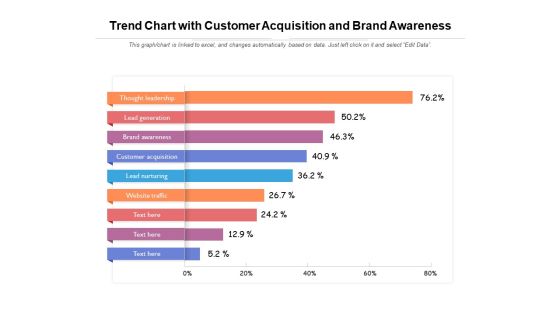
Trend Chart With Customer Acquisition And Brand Awareness Ppt PowerPoint Presentation Show Samples PDF
Pitch your topic with ease and precision using this trend chart with customer acquisition and brand awareness ppt powerpoint presentation show samples pdf. This layout presents information on thought leadership, lead generation, brand awareness, customer acquisition, lead nurturing. It is also available for immediate download and adjustment. So, changes can be made in the color, design, graphics or any other component to create a unique layout.
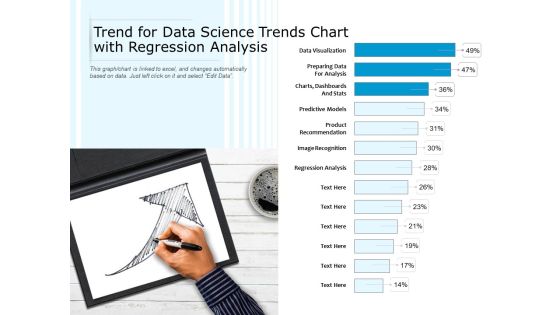
Trend For Data Science Trends Chart With Regression Analysis Ppt PowerPoint Presentation Visual Aids Layouts PDF
Showcasing this set of slides titled trend for data science trends chart with regression analysis ppt powerpoint presentation visual aids layouts pdf. The topics addressed in these templates are data visualization, preparing data for analysis, dashboards and stats, predictive models. All the content presented in this PPT design is completely editable. Download it and make adjustments in color, background, font etc. as per your unique business setting.

Chart Indicating United States Marine Corps Yearly Attrition Rate Ppt PowerPoint Presentation File Background Images PDF
Pitch your topic with ease and precision using this chart indicating united states marine corps yearly attrition rate ppt powerpoint presentation file background images pdf. This layout presents information on hart indicating united states marine corps yearly attrition rate. It is also available for immediate download and adjustment. So, changes can be made in the color, design, graphics or any other component to create a unique layout.

Business Profile Of It Company With Financial Charts Ppt PowerPoint Presentation Model Ideas PDF
Deliver and pitch your topic in the best possible manner with this business profile of it company with financial charts ppt powerpoint presentation model ideas pdf. Use them to share invaluable insights on the company reported strong financials in last five years, operating income, net income and impress your audience. This template can be altered and modified as per your expectations. So, grab it now.
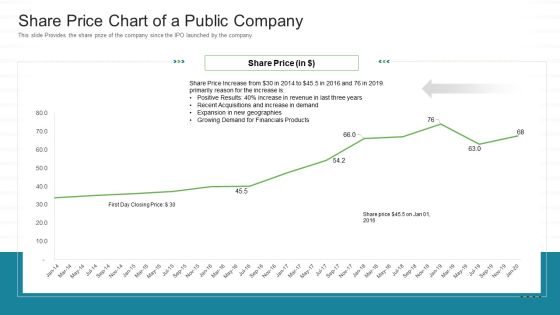
Investor Pitch Stock Market Launch Financial Institutions Share Price Chart Of A Public Company Sample PDF
This slide Provides the share prize of the company since the IPO launched by the company. Deliver and pitch your topic in the best possible manner with this investor pitch stock market launch financial institutions share price chart of a public company sample pdf. Use them to share invaluable insights on growing demand, financials products, share price and impress your audience. This template can be altered and modified as per your expectations. So, grab it now.
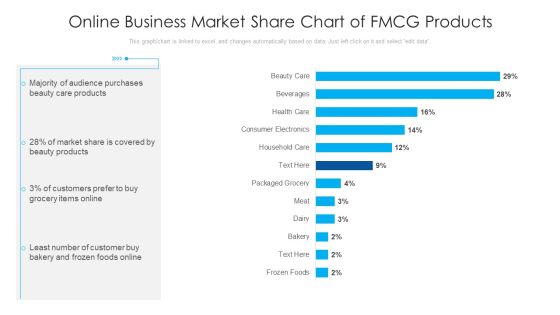
Online Business Market Share Chart Of Fmcg Products Ppt PowerPoint Presentation Portfolio Format Ideas PDF
Showcasing this set of slides titled online business market share chart of fmcg products ppt powerpoint presentation portfolio format ideas pdf. The topics addressed in these templates are majority of audience purchases, grocery items online, beauty care products. All the content presented in this PPT design is completely editable. Download it and make adjustments in color, background, font etc. as per your unique business setting.
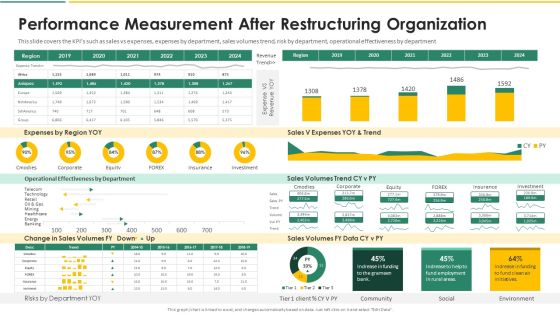
Organization Chart And Corporate Model Transformation Performance Measurement After Slides PDF
This slide covers the KPIs such as sales vs expenses, expenses by department, sales volumes trend, risk by department, operational effectiveness by department. Deliver and pitch your topic in the best possible manner with this organization chart and corporate model transformation performance measurement after slides pdf. Use them to share invaluable insights on operational effectiveness by department, expenses by region yoy, sales volumes trend and impress your audience. This template can be altered and modified as per your expectations. So, grab it now.

Organization Chart And Corporate Model Transformation Restructuring Organization Results Elements PDF
This is an analysis carried out to capture the overall experience of the Restructuring Organization process. On the views such as strongly agree, agree, disagree, strongly disagree. Deliver an awe inspiring pitch with this creative organization chart and corporate model transformation restructuring organization results elements pdf bundle. Topics like effective, involvement, organizations can be discussed with this completely editable template. It is available for immediate download depending on the needs and requirements of the user.

Brand Comparative Analysis Chart With Market Size And Pricing Model Pictures PDF
This slide illustrates comparative analysis of brands of XYZ product. It includes their market size, key features of these brands.Showcasing this set of slides titled Brand Comparative Analysis Chart With Market Size And Pricing Model Pictures PDF. The topics addressed in these templates are Pricing Model, Competitive Pricing, Market Size. All the content presented in this PPT design is completely editable. Download it and make adjustments in color, background, font etc. as per your unique business setting.

Market Chart Showing Revenue Breakdown Of IT Products Ppt File Elements PDF
This slide shows the revenue comparison graph of IT products over last six months. IT products covered in the slide are hardware and software. Pitch your topic with ease and precision using this Market Chart Showing Revenue Breakdown Of IT Products Ppt File Elements PDF. This layout presents information on Hardware, Software, Key Insights. It is also available for immediate download and adjustment. So, changes can be made in the color, design, graphics or any other component to create a unique layout.
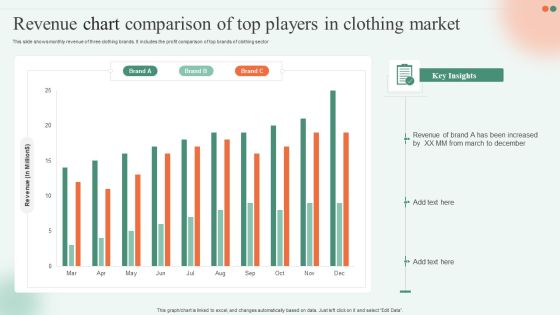
Revenue Chart Comparison Of Top Players In Clothing Market Ppt Infographics Skills PDF
This slide shows monthly revenue of three clothing brands. It includes the profit comparison of top brands of clothing sector Showcasing this set of slides titled Revenue Chart Comparison Of Top Players In Clothing Market Ppt Infographics Skills PDF. The topics addressed in these templates are Revenue, Brand, Key Insights. All the content presented in this PPT design is completely editable. Download it and make adjustments in color, background, font etc. as per your unique business setting.
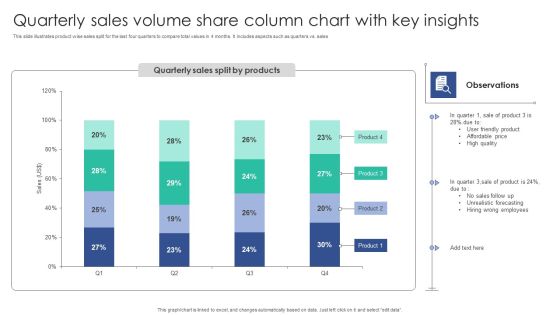
Quarterly Sales Volume Share Column Chart With Key Insights Structure PDF
This slide illustrates product wise sales split for the last four quarters to compare total values in 4 months. It includes aspects such as quarters vs. salesShowcasing this set of slides titled Quarterly Sales Volume Share Column Chart With Key Insights Structure PDF. The topics addressed in these templates are Unrealistic Forecasting, Wrong Employees, Friendly Product. All the content presented in this PPT design is completely editable. Download it and make adjustments in color, background, font etc. as per your unique business setting.

Clustered Column Chart Opening Retail Store In Untapped Industry For Sales Growth Mockup PDF
Want to ace your presentation in front of a live audience Our Clustered Column Chart Opening Retail Store In Untapped Industry For Sales Growth Mockup PDF can help you do that by engaging all the users towards you.. Slidegeeks experts have put their efforts and expertise into creating these impeccable powerpoint presentations so that you can communicate your ideas clearly. Moreover, all the templates are customizable, and easy-to-edit and downloadable. Use these for both personal and commercial use.
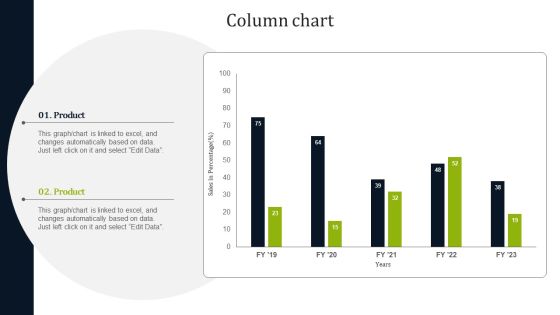
Column Chart Introducing New Commodities Through Product Line Extension Mockup PDF
From laying roadmaps to briefing everything in detail, our templates are perfect for you. You can set the stage with your presentation slides. All you have to do is download these easy-to-edit and customizable templates. Column Chart Introducing New Commodities Through Product Line Extension Mockup PDF will help you deliver an outstanding performance that everyone would remember and praise you for. Do download this presentation today.

Identifying And Increasing Brand Awareness Column Chart Ppt Pictures Brochure PDF
Want to ace your presentation in front of a live audience Our Identifying And Increasing Brand Awareness Column Chart Ppt Pictures Brochure PDF can help you do that by engaging all the users towards you. Slidegeeks experts have put their efforts and expertise into creating these impeccable powerpoint presentations so that you can communicate your ideas clearly. Moreover, all the templates are customizable, and easy-to-edit and downloadable. Use these for both personal and commercial use.
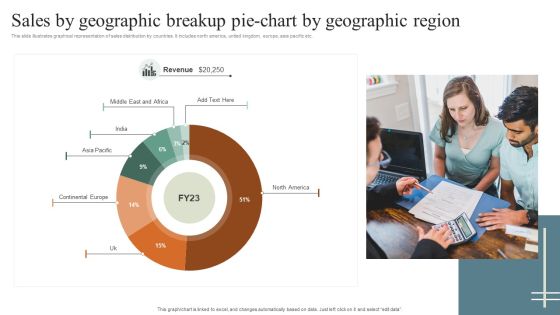
Sales By Geographic Breakup Pie Chart By Geographic Region Rules PDF
This slide illustrates graphical representation of sales distribution by countries. It includes north america, united kingdom, europe, asia pacific etc. Pitch your topic with ease and precision using this Sales By Geographic Breakup Pie Chart By Geographic Region Rules PDF. This layout presents information on Sales By Geographic, Geographic Region. It is also available for immediate download and adjustment. So, changes can be made in the color, design, graphics or any other component to create a unique layout.

Chart Showing Quarterly Product Sales By Various Vendors Ppt PowerPoint Presentation Professional Vector PDF
Pitch your topic with ease and precision using this chart showing quarterly product sales by various vendors ppt powerpoint presentation professional vector pdf. This layout presents information on number of products sold, region abc region, year 2020, product sales, supplier. It is also available for immediate download and adjustment. So, changes can be made in the color, design, graphics or any other component to create a unique layout.

Chart Showing Time And Business Impact Ppt PowerPoint Presentation Example 2015 PDF
Pitch your topic with ease and precision using this chart showing time and business impact ppt powerpoint presentation example 2015 pdf. This layout presents information on business impact mobilization, ramp up, steady state, time, conscious change, renewal, effort. It is also available for immediate download and adjustment. So, changes can be made in the color, design, graphics or any other component to create a unique layout.

Chart For Online Bullying Incidents By Gender Ppt PowerPoint Presentation Summary Layout PDF
Showcasing this set of slides titled chart for online bullying incidents by gender ppt powerpoint presentation summary layout pdf. The topics addressed in these templates are verbal abuse or threats, bullying, harassment including sexual, unwanted sexual attention, physical violence. All the content presented in this PPT design is completely editable. Download it and make adjustments in color, background, font etc. as per your unique business setting.
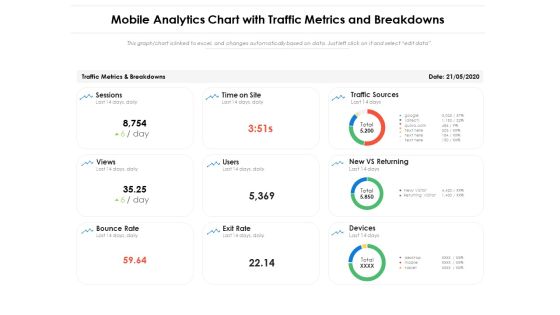
Mobile Analytics Chart With Traffic Metrics And Breakdowns Ppt PowerPoint Presentation Ideas Layout PDF
Pitch your topic with ease and precision using this mobile analytics chart with traffic metrics and breakdowns ppt powerpoint presentation ideas layout pdf. This layout presents information on traffic sources, new vs returning, devices, bounce rate, sessions. It is also available for immediate download and adjustment. So, changes can be made in the color, design, graphics or any other component to create a unique layout.
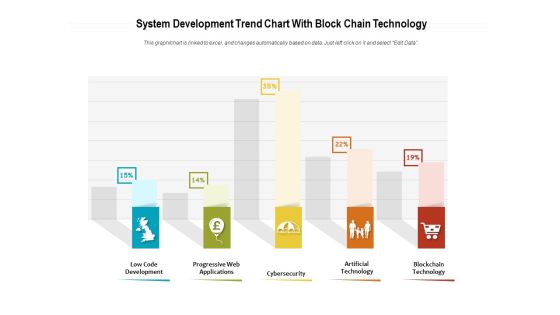
System Development Trend Chart With Block Chain Technology Ppt PowerPoint Presentation File Background Images PDF
Showcasing this set of slides titled system development trend chart with block chain technology ppt powerpoint presentation file background images pdf. The topics addressed in these templates are low code development, progressive web applications, cybersecurity, artificial technology, blockchain technology. All the content presented in this PPT design is completely editable. Download it and make adjustments in color, background, font etc. as per your unique business setting.
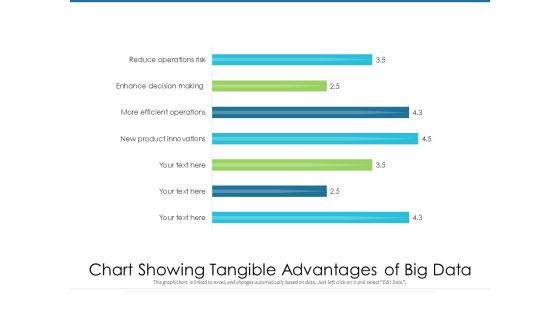
Chart Showing Tangible Advantages Of Big Data Ppt PowerPoint Presentation Infographics Clipart PDF
Pitch your topic with ease and precision using this chart showing tangible advantages of big data ppt powerpoint presentation infographics clipart pdf. This layout presents information on new product innovations, more efficient operations, enhance decision making, reduce operations risk. It is also available for immediate download and adjustment. So, changes can be made in the color, design, graphics or any other component to create a unique layout.

Chart Illustrating Consumer Journey Marketing With Key Insights Ppt PowerPoint Presentation File Demonstration PDF
The following slide illustrates the graph of customer lifecycle marketing with stages awareness, consideration, purchase , retention and advocacy. Showcasing this set of slides titled chart illustrating consumer journey marketing with key insights ppt powerpoint presentation file demonstration pdf. The topics addressed in these templates are awareness, consideration, purchase. All the content presented in this PPT design is completely editable. Download it and make adjustments in color, background, font etc. as per your unique business setting.

Product Market Share Chart Of Electronic Company Ppt Gallery Graphic Tips PDF
This slide shows the percentage of market share graph of electronic company products. It includes mobile phone, laptop, tablet, computer and others devices. Pitch your topic with ease and precision using this Product Market Share Chart Of Electronic Company Ppt Gallery Graphic Tips PDF. This layout presents information on Mobile Phone, Computer, Laptop, Tablet. It is also available for immediate download and adjustment. So, changes can be made in the color, design, graphics or any other component to create a unique layout.

Intelligent Manufacturing Column Chart Ppt PowerPoint Presentation File Example File PDF
The Intelligent Manufacturing Column Chart Ppt PowerPoint Presentation File Example File PDF is a compilation of the most recent design trends as a series of slides. It is suitable for any subject or industry presentation, containing attractive visuals and photo spots for businesses to clearly express their messages. This template contains a variety of slides for the user to input data, such as structures to contrast two elements, bullet points, and slides for written information. Slidegeeks is prepared to create an impression.

Success Pie Chart Business PowerPoint Templates And PowerPoint Themes 1012
Success Pie Chart Business PowerPoint Templates And PowerPoint Themes 1012-Microsoft Powerpoint Templates and Background with pie chart-Success Pie Chart Business PowerPoint Templates And PowerPoint Themes 1012-This PowerPoint template can be used for presentations relating to-Pie chart, business, finance, marketing, sales, success

Strategic Marketing For Hair And Beauty Salon To Increase Examining Impact Of Clients Formats PDF
This slide analyzes the relationship between frequency of client visits and business revenue. It includes two tables showcasing current projections and what if analysis covering metrics such as average weekly service sales, average number of visits per year, number of new clients per month, etc. Boost your pitch with our creative Strategic Marketing For Hair And Beauty Salon To Increase Examining Impact Of Clients Formats PDF. Deliver an awe-inspiring pitch that will mesmerize everyone. Using these presentation templates you will surely catch everyones attention. You can browse the ppts collection on our website. We have researchers who are experts at creating the right content for the templates. So you do not have to invest time in any additional work. Just grab the template now and use them.
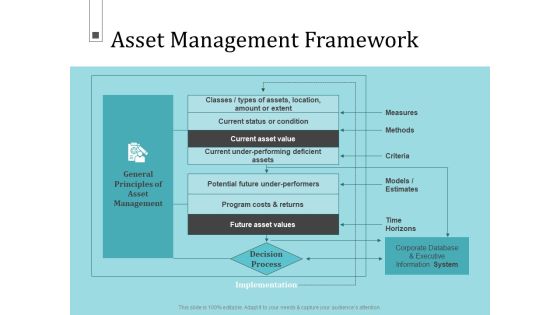
Infrastructure Project Management In Construction Asset Management Framework Diagrams PDF
Deliver an awe inspiring pitch with this creative infrastructure project management in construction asset management framework diagrams pdf. bundle. Topics like current asset value, future asset values, decision process, program costs and returns can be discussed with this completely editable template. It is available for immediate download depending on the needs and requirements of the user.

Business Activities Assessment Examples Asset Management Framework Demonstration PDF
Deliver an awe inspiring pitch with this creative business activities assessment examples asset management framework demonstration pdf bundle. Topics like current under performing deficient assets, potential future under performers, program costs and returns, future asset values, current status or condition can be discussed with this completely editable template. It is available for immediate download depending on the needs and requirements of the user.
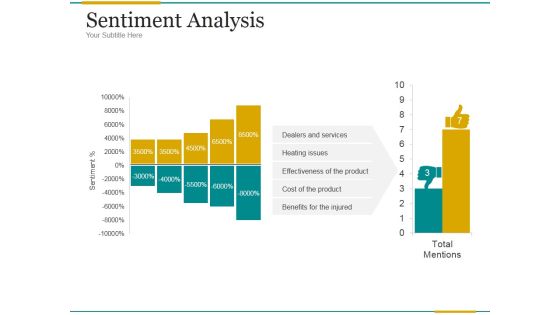
Sentiment Analysis Ppt PowerPoint Presentation Example File
This is a sentiment analysis ppt powerpoint presentation example file. This is a two stage process. The stages in this process are dealers and services, heating issues, effectiveness of the product, cost of the product, benefits for the injured.

Manufacturing Process Automation For Enhancing Productivity Ppt PowerPoint Presentation Complete With Slides
Incorporate this Manufacturing Process Automation For Enhancing Productivity Ppt PowerPoint Presentation Complete With Slides to grab your audiences attention towards your business and its cost-effective services. This predesigned PPT complete deck comprises a suitable graphic to highlight your business and has sufficient space to help you present your content. The combination of colors makes it special. Grab this vibrant and professional PowerPoint template to create your business publicity material. The presentation template is also equipped to do this with its 100 percent editable and customizable capability. Download now.

Comprehensive Guide To Acquire Customers For Startups Ppt PowerPoint Presentation Complete Deck With Slides
Incorporate this Comprehensive Guide To Acquire Customers For Startups Ppt PowerPoint Presentation Complete Deck With Slides to grab your audiences attention towards your business and its cost-effective services. This predesigned PPT complete deck comprises a suitable graphic to highlight your business and has sufficient space to help you present your content. The combination of colors makes it special. Grab this vibrant and professional PowerPoint template to create your business publicity material. The presentation template is also equipped to do this with its 100 precent editable and customizable capability. Download now.

Past Trends In Market Share Of ABC Carbonated Drink Company Ppt Diagram Graph Charts PDF
This slide shows the past trends in market share of ABC Carbonated Beverage Company worldwide. The market share has decreased due to decline in sales as people have become more health conscious and avoid beverages that have high sugar content and caffeine. Deliver an awe inspiring pitch with this creative past trends in market share of abc carbonated drink company ppt diagram graph charts pdf bundle. Topics like past trends in market share of abc carbonated drink company can be discussed with this completely editable template. It is available for immediate download depending on the needs and requirements of the user.

Russia Ukraine Ethereum Price Chart Before The Russia Invasion Of Ukraine Graphics PDF
The purpose of this slide is to exhibit day-to-day movement of Ethereum before the Russia Ukraine crisis. The statistics mentioned in the slide is related to the price movement from Jan 24 to Feb 21, 2022. Deliver an awe inspiring pitch with this creative russia ukraine ethereum price chart before the russia invasion of ukraine graphics pdf bundle. Topics like ethereum price can be discussed with this completely editable template. It is available for immediate download depending on the needs and requirements of the user.

Construction Industry Market Share Chart Comparison Of Big Players Ppt Portfolio Shapes PDF
This slide shows the year over year market share comparison of major construction firms. It also illustrates that market share of brand B has increased by slight margin. Pitch your topic with ease and precision using this Construction Industry Market Share Chart Comparison Of Big Players Ppt Portfolio Shapes PDF. This layout presents information on Market Share Percentage, 2022 To 2023, Market Share. It is also available for immediate download and adjustment. So, changes can be made in the color, design, graphics or any other component to create a unique layout.

Market Chart Showing Revenue Breakdown Of FMCG Company Ppt Layouts Layouts PDF
This slide shows the percentage of revenue generated in fast moving consumable goods industry from different segments which are food products, households, personal, baby and hair care, OTC products and others. Showcasing this set of slides titled Market Chart Showing Revenue Breakdown Of FMCG Company Ppt Layouts Layouts PDF. The topics addressed in these templates are Food Products, Personal Care, Households. All the content presented in this PPT design is completely editable. Download it and make adjustments in color, background, font etc. as per your unique business setting.

Usage Trend Chart Of Skincare Product Market Ppt Slides Graphics Download PDF
This slide shows market trend graph of skincare product usage in four quarters. It also indicates that product A is most preferred by the customers. Pitch your topic with ease and precision using this Usage Trend Chart Of Skincare Product Market Ppt Slides Graphics Download PDF. This layout presents information on Trend Product, Skincare Product, Quarter Due. It is also available for immediate download and adjustment. So, changes can be made in the color, design, graphics or any other component to create a unique layout.

Integrating Naas Service Model To Enhance Area Chart Ppt File Images PDF
Slidegeeks is here to make your presentations a breeze with Integrating Naas Service Model To Enhance Area Chart Ppt File Images PDF With our easy-to-use and customizable templates, you can focus on delivering your ideas rather than worrying about formatting. With a variety of designs to choose from, youre sure to find one that suits your needs. And with animations and unique photos, illustrations, and fonts, you can make your presentation pop. So whether youre giving a sales pitch or presenting to the board, make sure to check out Slidegeeks first.

Company Age Wise Employee Count Column Chart With Key Insights Microsoft PDF
This slide illustrates employee count by age to find the recruitment rate for company. It includes aspects such as the number of employees and age.Pitch your topic with ease and precision using this Company Age Wise Employee Count Column Chart With Key Insights Microsoft PDF. This layout presents information on Employees Working, Total Workforce, Require Replacement. It is also available for immediate download and adjustment. So, changes can be made in the color, design, graphics or any other component to create a unique layout.

Profit And Discount By Products Column Chart With Key Insights Template PDF
This slide illustrates the profits earned and discounts offered by respective products to measure efficient financial operations. It includes aspects such as products and profit, discount revenue.Showcasing this set of slides titled Profit And Discount By Products Column Chart With Key Insights Template PDF. The topics addressed in these templates are Product Profit, Generated Product, Version Launched. All the content presented in this PPT design is completely editable. Download it and make adjustments in color, background, font etc. as per your unique business setting.

Soft Drinks Brand Preference Column Chart With Key Insights Clipart PDF
This slide shows survey results of soft drinks consumption by different age groups of consumers. Major brands covered are coke, Pepsi, coke zero, and Pepsi max to visualize soda consumption.Showcasing this set of slides titled Soft Drinks Brand Preference Column Chart With Key Insights Clipart PDF. The topics addressed in these templates are Survey Consumers, Personalized Advertisements, Emotional Connect. All the content presented in this PPT design is completely editable. Download it and make adjustments in color, background, font etc. as per your unique business setting.
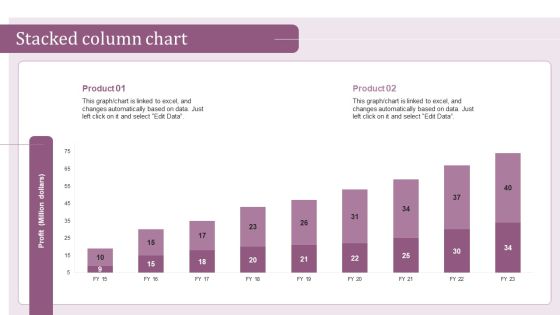
Internal Hiring Handbook Stacked Column Chart Ppt PowerPoint Presentation File Graphics Example PDF
This modern and well-arranged Internal Hiring Handbook Stacked Column Chart Ppt PowerPoint Presentation File Graphics Example PDF provides lots of creative possibilities. It is very simple to customize and edit with the Powerpoint Software. Just drag and drop your pictures into the shapes. All facets of this template can be edited with Powerpoint, no extra software is necessary. Add your own material, put your images in the places assigned for them, adjust the colors, and then you can show your slides to the world, with an animated slide included.

Effective Online And Offline Promotional Line Chart Ppt Styles Model PDF
Slidegeeks is here to make your presentations a breeze with Effective Online And Offline Promotional Line Chart Ppt Styles Model PDF With our easy-to-use and customizable templates, you can focus on delivering your ideas rather than worrying about formatting. With a variety of designs to choose from, youre sure to find one that suits your needs. And with animations and unique photos, illustrations, and fonts, you can make your presentation pop. So whether youre giving a sales pitch or presenting to the board, make sure to check out Slidegeeks first.

Area Chart Employee Performance Management System To Enhance Workforce Productivity Ideas PDF
This Area Chart Employee Performance Management System To Enhance Workforce Productivity Ideas PDF from Slidegeeks makes it easy to present information on your topic with precision. It provides customization options, so you can make changes to the colors, design, graphics, or any other component to create a unique layout. It is also available for immediate download, so you can begin using it right away. Slidegeeks has done good research to ensure that you have everything you need to make your presentation stand out. Make a name out there for a brilliant performance.
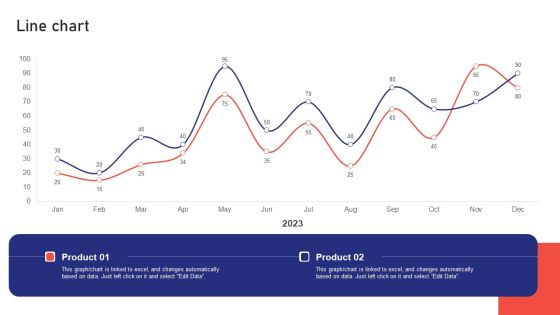
Sales Risk Assessment Profit Maximization Team Performance Enhancement Line Chart Information PDF
Slidegeeks is here to make your presentations a breeze with Sales Risk Assessment Profit Maximization Team Performance Enhancement Line Chart Information PDF With our easy to use and customizable templates, you can focus on delivering your ideas rather than worrying about formatting. With a variety of designs to choose from, you are sure to find one that suits your needs. And with animations and unique photos, illustrations, and fonts, you can make your presentation pop. So whether you are giving a sales pitch or presenting to the board, make sure to check out Slidegeeks first.

Product Review Description Donut Chart Ppt PowerPoint Presentation Gallery Deck PDF
The given below slide depicts the brief performance overview of product through customers review to modify and inculcate new features. It constitutes of top feedback based on affordability, suitability, convenience, uniqueness etc. Showcasing this set of slides titled Product Review Description Donut Chart Ppt PowerPoint Presentation Gallery Deck PDF. The topics addressed in these templates are Product Details, Key Insights, Product Affordable, Customer Believes. All the content presented in this PPT design is completely editable. Download it and make adjustments in color, background, font etc. as per your unique business setting.

Deploying Iot Solutions In The Retail Market Line Chart Inspiration PDF
The following slide highlights the estimated financial impact of internet of things on multiple sectors. The sectors included are factories, smart cities, retail, transportation, operations, and smart homes. The Deploying Iot Solutions In The Retail Market Line Chart Inspiration PDF is a compilation of the most recent design trends as a series of slides. It is suitable for any subject or industry presentation, containing attractive visuals and photo spots for businesses to clearly express their messages. This template contains a variety of slides for the user to input data, such as structures to contrast two elements, bullet points, and slides for written information. Slidegeeks is prepared to create an impression.

Determining Overall Impact Of CSR Implementation Ppt Pictures Model PDF
This slide covers information regarding the analysis of firms overall performance after the successful implementation of CSR program. Deliver and pitch your topic in the best possible manner with this determining overall impact of csr implementation ppt pictures model pdf. Use them to share invaluable insights on annual percentage of revenue spent on csr, annual percentage of recurring revenue generated due to csr, customer purchasing decision under csr influence, corp score and impress your audience. This template can be altered and modified as per your expectations. So, grab it now.

Decline In Revenue Of Ibn Outsourcing Company For 5 Years Ppt Layouts Inspiration PDF
This slide shows a graph of declining Revenue of IBN Outsourcing Company for past 5 years 2017-2021. Additionally, this slide provides key reasons for the decline High Customer Attrition Rate, Outdated Software Technology, Low Quality and Delayed Customer Service etc. Deliver and pitch your topic in the best possible manner with this decline in revenue of ibn outsourcing company for 5 years ppt layouts inspiration pdf. Use them to share invaluable insights on reward programs, software technology, customer service, low quality, revenue and impress your audience. This template can be altered and modified as per your expectations. So, grab it now.
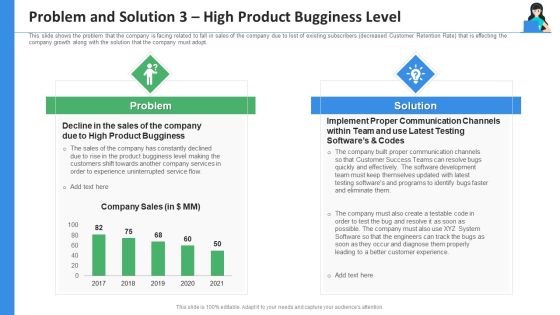
Problem And Solution 3 High Product Bugginess Level Ppt Slides Inspiration PDF
This slide shows the problem that the company is facing related to fall in sales of the company due to lost of existing subscribers decreased Customer Retention Rate that is effecting the company growth along with the solution that the company must adopt. Deliver an awe inspiring pitch with this creative problem and solution 3 high product bugginess level ppt slides inspiration pdf bundle. Topics like communication channels, softwares and programs, software development, product bugginess, 2017 to 2021 can be discussed with this completely editable template. It is available for immediate download depending on the needs and requirements of the user.

Challenge And Solutions 3 Employee Error Ppt Portfolio Good PDF
This slide shows the problem that the company is facing related to improper and unaware employee behavior leading to data loss and misuse. Also, some solutions are provided to solve the problem. Deliver an awe inspiring pitch with this creative challenge and solutions 3 employee error ppt portfolio good pdf bundle. Topics like problem, recommendation, perform proper employee onboarding and implement proper security training programs can be discussed with this completely editable template. It is available for immediate download depending on the needs and requirements of the user.

Decline In Revenue Of Ibn Outsourcing Company For 5 Years Download PDF
This slide shows a graph of declining Revenue of IBN Outsourcing Company for past 5 years 2017 2021. Additionally, this slide provides key reasons for the decline High Customer Attrition Rate, Outdated Software Technology, Low Quality and Delayed Customer Service etc. Deliver an awe-inspiring pitch with this creative decline in revenue of ibn outsourcing company for 5 years download pdf. bundle. Topics like revenue, outsourcing, reward programs, outdated software technology, customer service can be discussed with this completely editable template. It is available for immediate download depending on the needs and requirements of the user.

Problem And Solution 3 High Product Bugginess Level Rules PDF
This slide shows the problem that the company is facing related to fall in sales of the company due to lost of existing subscribers decreased Customer Retention Rate that is effecting the company growth along with the solution that the company must adopt. Deliver an awe-inspiring pitch with this creative problem and solution 3 high product bugginess level rules pdf. bundle. Topics like customers, services, product, software, programs can be discussed with this completely editable template. It is available for immediate download depending on the needs and requirements of the user.
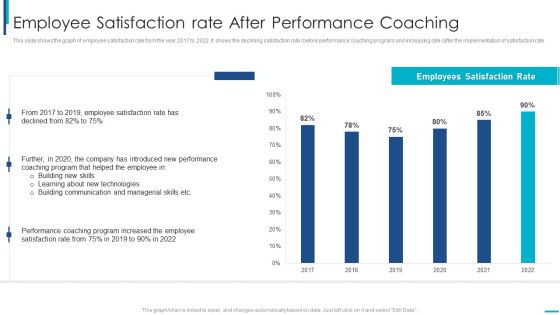
Skill Development Training To Strengthen Employee Performance Employee Satisfaction Rate After Summary PDF
This slide shows the graph of employee satisfaction rate from the year 2017 to 2022. It shows the declining satisfaction rate before performance coaching program and increasing rate after the implementation of satisfaction rate. Deliver and pitch your topic in the best possible manner with this skill development training to strengthen employee performance employee satisfaction rate after summary pdf. Use them to share invaluable insights on communication, technologies, performance, managerial skills and impress your audience. This template can be altered and modified as per your expectations. So, grab it now.
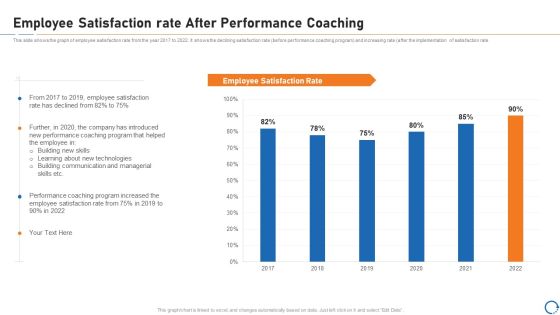
Upskill Training For Employee Performance Improvement Employee Satisfaction Rate After Performance Coaching Ideas PDF
This slide shows the graph of employee satisfaction rate from the year 2017 to 2022. It shows the declining satisfaction rate before performance coaching program and increasing rate after the implementation of satisfaction rate. Deliver and pitch your topic in the best possible manner with this upskill training for employee performance improvement employee satisfaction rate after performance coaching ideas pdf. Use them to share invaluable insights on communication, technologies, performance, managerial skills and impress your audience. This template can be altered and modified as per your expectations. So, grab it now.
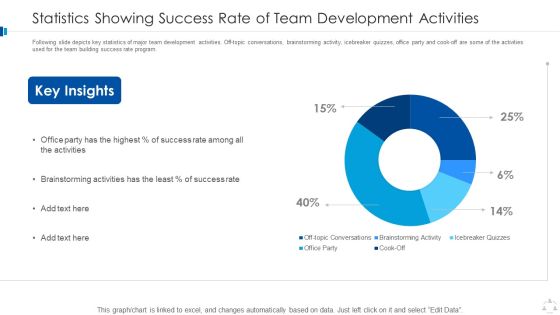
Statistics Showing Success Rate Of Team Development Activities Download PDF
Following slide depicts key statistics of major team development activities. Off topic conversations, brainstorming activity, icebreaker quizzes, office party and cook off are some of the activities used for the team building success rate program. Showcasing this set of slides titled statistics showing success rate of team development activities download pdf. The topics addressed in these templates are statistics showing success rate of team development activities. All the content presented in this PPT design is completely editable. Download it and make adjustments in color, background, font etc. as per your unique business setting.

Market Research Project Dashboard For Measuring Brand Awareness Rules PDF
Mentioned slide delineates research program dashboard which can be used by marketers for measuring brand awareness. This dashboard includes various elements such as celebrity analysis, top branding themes etc. Pitch your topic with ease and precision using this market research project dashboard for measuring brand awareness rules pdf. This layout presents information on brand awareness, celebrity analysis, advertisement. It is also available for immediate download and adjustment. So, changes can be made in the color, design, graphics or any other component to create a unique layout.
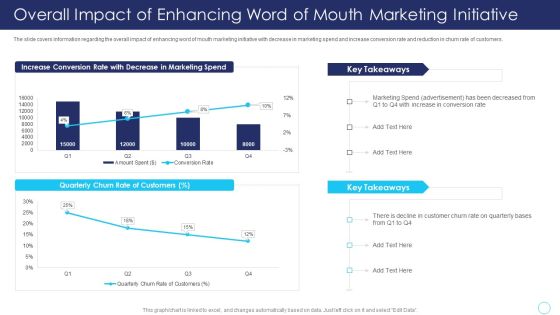
Positive Marketing For Corporate Reputation Overall Impact Of Enhancing Word Of Mouth Rules PDF
The slide covers information regarding the overall impact of enhancing word of mouth marketing initiative with decrease in marketing spend and increase conversion rate and reduction in churn rate of customers. Deliver an awe inspiring pitch with this creative positive marketing for corporate reputation overall impact of enhancing word of mouth rules pdf bundle. Topics like referral marketing program, impact assessment, dashboard assessment, mouth marketing solution can be discussed with this completely editable template. It is available for immediate download depending on the needs and requirements of the user.

Customer Relationship Management Software Dashboard For Customer Support System Demonstration PDF
This slide shows the dashboard to be used by the customer support system of the organisation. It represents the number of unresolved issues, average response time and level of customer satisfaction.Pitch your topic with ease and precision using this Customer Relationship Management Software Dashboard For Customer Support System Demonstration PDF This layout presents information on Customer Support, Vendor Management, Loyalty Programs It is also available for immediate download and adjustment. So, changes can be made in the color, design, graphics or any other component to create a unique layout.

Solid Waste Management Process KPI Dashboard Pictures PDF
Following slide highlights KPI dashboard for solid waste management which shows metrics like total material recycled by various categories, CO2 emissions by year, savings returned etc. Management can track such metrics to ensure waste management program is on track or not.Showcasing this set of slides titled Solid Waste Management Process KPI Dashboard Pictures PDF The topics addressed in these templates are Recycled Category, Sent Recycling, Tones Recycle All the content presented in this PPT design is completely editable. Download it and make adjustments in color, background, font etc. as per your unique business setting.
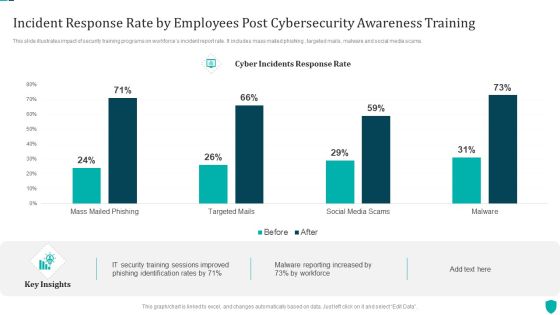
Incident Response Rate By Employees Post Cybersecurity Awareness Training Demonstration PDF
This slide illustrates impact of security training programs on workforces incident report rate. It includes mass mailed phishing , targeted mails, malware and social media scams.Pitch your topic with ease and precision using this Incident Response Rate By Employees Post Cybersecurity Awareness Training Demonstration PDF. This layout presents information on Training Sessions, Phishing Identification, Malware Reporting. It is also available for immediate download and adjustment. So, changes can be made in the color, design, graphics or any other component to create a unique layout.

Key HR Service Delivery Statistics On A Global Scal Portrait PDF
This slide shows the some of the key HR Service Delivery Statistics on a Global Scale such as percentage of companies that are that are expected to perform better due to ethnic diversity, percentage of employees whose loyalty will increase to additional paid time, increase in annual growth rate due to more employee engagement programs etc. Deliver and pitch your topic in the best possible manner with this Key HR Service Delivery Statistics On A Global Scal Portrait PDF. Use them to share invaluable insights on Produce Better, Employee Engagement, Employee Termination and impress your audience. This template can be altered and modified as per your expectations. So, grab it now.

Project Metrics Dashboard With Due Tasks Microsoft PDF
This slide shows the project management dashboard which includes hours taken by client, account manager, service, actual working hours, description of services such as web programming, search engine optimization, graphic designing, etc. Pitch your topic with ease and precision using this Project Metrics Dashboard With Due Tasks Microsoft PDF. This layout presents information on Service, Optimization, Graphic Design. It is also available for immediate download and adjustment. So, changes can be made in the color, design, graphics or any other component to create a unique layout.

Cyber Security Risk Dashboard With KPI Metrics Elements PDF
This slide depicts global cyber security and risk trends providing information about every aspect of threat. It includes overall progression, critical risk identified, initiatives, incident and vulnerabilities management, compliance and patches. Showcasing this set of slides titled Cyber Security Risk Dashboard With KPI Metrics Elements PDF. The topics addressed in these templates are Vulnerability Management Program, Reports And Metrics Elaboration, Critical Risk Identified. All the content presented in this PPT design is completely editable. Download it and make adjustments in color, background, font etc. as per your unique business setting.
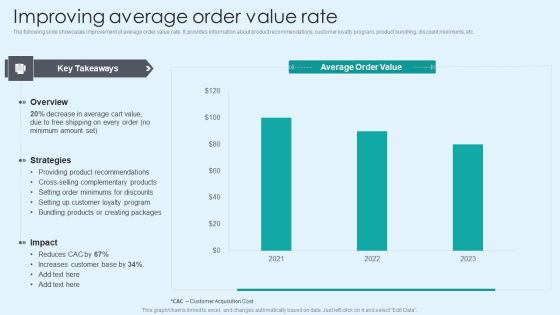
Improving Average Order Value Rate Slides PDF
The following slide showcases improvement of average order value rate. It provides information about product recommendations, customer loyalty program, product bundling, discount minimums, etc. Take your projects to the next level with our ultimate collection of Improving Average Order Value Rate Slides PDF. Slidegeeks has designed a range of layouts that are perfect for representing task or activity duration, keeping track of all your deadlines at a glance. Tailor these designs to your exact needs and give them a truly corporate look with your own brand colors they will make your projects stand out from the rest.
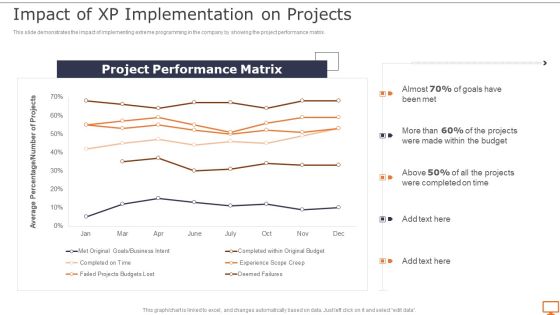
Deploying XP Practices To Enhance Operational Efficiency Impact Of XP Implementation On Projects Microsoft PDF
This slide demonstrates the impact of implementing extreme programming in the company by showing the project performance matrix.Slidegeeks has constructed Deploying XP Practices To Enhance Operational Efficiency Impact Of XP Implementation On Projects Microsoft PDF after conducting extensive research and examination. These presentation templates are constantly being generated and modified based on user preferences and critiques from editors. Here, you will find the most attractive templates for a range of purposes while taking into account ratings and remarks from users regarding the content. This is an excellent jumping-off point to explore our content and will give new users an insight into our top-notch PowerPoint Templates.

Online Platforms To Overcome Effect Of Pandemic On Educational Impacts Portrait PDF
The slide highlights a survey of educational institutions that adopted various online platforms to combat COVID-19 impacts . Various online platforms included are e-courses, e-learning programs, blended modes of learning, etc. Showcasing this set of slides titled Online Platforms To Overcome Effect Of Pandemic On Educational Impacts Portrait PDF. The topics addressed in these templates are Educational Institutions, Offered Online Courses, Mode Of Teaching. All the content presented in this PPT design is completely editable. Download it and make adjustments in color, background, font etc. as per your unique business setting.

Emerging Trends In Gym And Fitness Business Industry Diagrams PDF
This slide shows the statistics related to the emerging trends in the fitness industry. It includes trends related to fitness tech, wellness programs, studios within the club, changing generations etc. Showcasing this set of slides titled Emerging Trends In Gym And Fitness Business Industry Diagrams PDF. The topics addressed in these templates are Emerging Trends In Gym, Fitness Business Industry. All the content presented in this PPT design is completely editable. Download it and make adjustments in color, background, font etc. as per your unique business setting.

KPI Dashboard To Assess Impact Of Employee Training Brochure PDF
This slide covers KPI dashboard to assess training program effectiveness. It involves details such as overall responses on monthly basis, employee satisfaction rate, net promoter score and major training courses. Showcasing this set of slides titled KPI Dashboard To Assess Impact Of Employee Training Brochure PDF. The topics addressed in these templates are Major Training Course, Major Satisfactory Training Course, Major Recommended Training Course . All the content presented in this PPT design is completely editable. Download it and make adjustments in color, background, font etc. as per your unique business setting.

Deploying Online Marketing Impact And Performance Analysis Of Digital Marketing Background PDF
This slide represents marketing impact and performance analysis of digital marketing program. It covers an decline in cart abandonment rate and increase in qualified leads resulting in increase in revenue. The Deploying Online Marketing Impact And Performance Analysis Of Digital Marketing Background PDF is a compilation of the most recent design trends as a series of slides. It is suitable for any subject or industry presentation, containing attractive visuals and photo spots for businesses to clearly express their messages. This template contains a variety of slides for the user to input data, such as structures to contrast two elements, bullet points, and slides for written information. Slidegeeks is prepared to create an impression.

CSR Report On Strengthening Gender Diversity Introduction PDF
This slide illustrates corporate report on one of the CSR pillars to boost gender diversity. It includes percent of women employed region wise 2023, percentage of women in global workforce etc. Pitch your topic with ease and precision using this CSR Report On Strengthening Gender Diversity Introduction PDF. This layout presents information on Targeted Programs, Strengthening Gender Diversity. It is also available for immediate download and adjustment. So, changes can be made in the color, design, graphics or any other component to create a unique layout.

Organizational Communication Platform Survey Result Analysis Portrait PDF
This slide provides information about the survey result of mostly used communication platforms in the workplace. It includes platforms such as stack, zoom, google programs, email, skype and Microsoft teams. Showcasing this set of slides titled Organizational Communication Platform Survey Result Analysis Portrait PDF. The topics addressed in these templates are Organizations Stack Internal, Share Kind Flies, Free Accessibility. All the content presented in this PPT design is completely editable. Download it and make adjustments in color, background, font etc. as per your unique business setting.
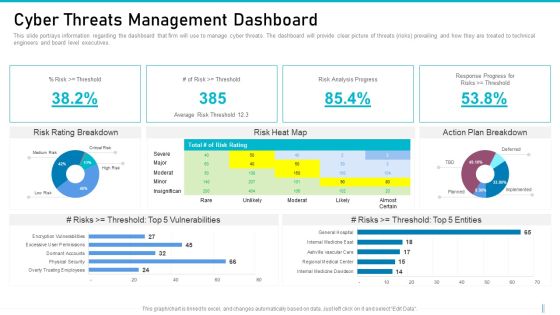
Risk Management For Organization Essential Assets Cyber Threats Management Dashboard Graphics PDF
This slide portrays information regarding the dashboard that firm will use to manage cyber threats. The dashboard will provide clear picture of threats risks prevailing and how they are treated to technical engineers and board level executives. Deliver and pitch your topic in the best possible manner with this risk management for organization essential assets cyber threats management dashboard graphics pdf. Use them to share invaluable insights on risk analysis, vulnerabilities, entities and impress your audience. This template can be altered and modified as per your expectations. So, grab it now.

Cyber Security Administration In Organization Cyber Threats Management Dashboard Formats PDF
This slide portrays information regarding the dashboard that firm will use to manage cyber threats. The dashboard will provide clear picture of threats risks prevailing and how they are treated to technical engineers and board level executives. Deliver an awe inspiring pitch with this creative cyber security administration in organization cyber threats management dashboard formats pdf bundle. Topics like cyber threats management dashboard can be discussed with this completely editable template. It is available for immediate download depending on the needs and requirements of the user.

Mitigating Cybersecurity Threats And Vulnerabilities Cyber Threats Management Slides PDF
This slide portrays information regarding the dashboard that firm will use to manage cyber threats. The dashboard will provide clear picture of threats risks prevailing and how they are treated to technical engineers and board level executives. Deliver and pitch your topic in the best possible manner with this mitigating cybersecurity threats and vulnerabilities cyber threats management slides pdf. Use them to share invaluable insights on cyber threats management dashboard and impress your audience. This template can be altered and modified as per your expectations. So, grab it now.

Corporate Security And Risk Management Cyber Threats Management Dashboard Ideas PDF
This slide portrays information regarding the dashboard that firm will use to manage cyber threats. The dashboard will provide clear picture of threats risks prevailing and how they are treated to technical engineers and board level executives. Deliver and pitch your topic in the best possible manner with this corporate security and risk management cyber threats management dashboard ideas pdf. Use them to share invaluable insights on cyber threats management dashboard and impress your audience. This template can be altered and modified as per your expectations. So, grab it now.
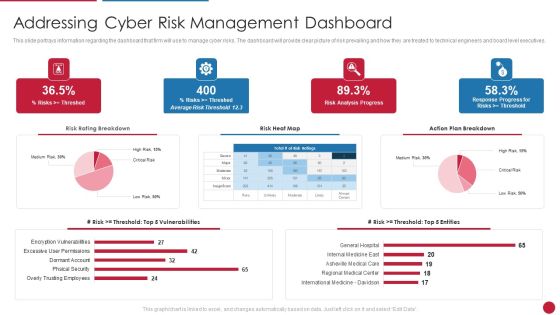
Facilitating IT Intelligence Architecture Addressing Cyber Risk Management Dashboard Professional PDF
This slide portrays information regarding the dashboard that firm will use to manage cyber risks. The dashboard will provide clear picture of risk prevailing and how they are treated to technical engineers and board level executives.Deliver and pitch your topic in the best possible manner with this Facilitating IT Intelligence Architecture Addressing Cyber Risk Management Dashboard Professional PDF Use them to share invaluable insights on International Medicine Davidson, Regional Medical Center, Asheville Medical Care and impress your audience. This template can be altered and modified as per your expectations. So, grab it now.
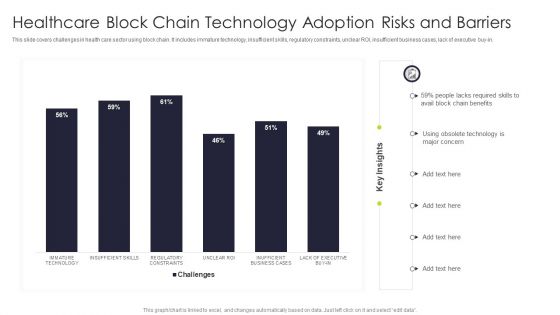
Healthcare Block Chain Technology Adoption Risks And Barriers Portrait PDF
This slide covers challenges in health care sector using block chain. It includes immature technology, insufficient skills, regulatory constraints, unclear ROI, insufficient business cases, lack of executive buy in. Pitch your topic with ease and precision using this Healthcare Block Chain Technology Adoption Risks And Barriers Portrait PDF This layout presents information on Immature Technology, Insufficient Skills, Regulatory Constraints It is also available for immediate download and adjustment. So, changes can be made in the color, design, graphics or any other component to create a unique layout.
Manpower Corporate Security Business Profile Sales Revenue By Region And Services Icons PDF
This slide highlights the security company sales revenue by region and services. It showcases retail mall security, social event security, university hospital security, executive protection and building security. Deliver and pitch your topic in the best possible manner with this Manpower Corporate Security Business Profile Sales Revenue By Region And Services Icons PDF. Use them to share invaluable insights on Sales Revenue, Region And Services and impress your audience. This template can be altered and modified as per your expectations. So, grab it now.
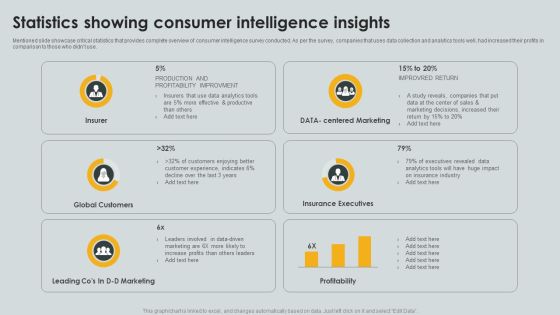
Statistics Showing Consumer Intelligence Insights Ppt PowerPoint Presentation Gallery Information PDF
Mentioned slide showcase critical statistics that provides complete overview of consumer intelligence survey conducted. As per the survey, companies that uses data collection and analytics tools well, had increased their profits in comparison to those who didnt use. Showcasing this set of slides titled Statistics Showing Consumer Intelligence Insights Ppt PowerPoint Presentation Gallery Information PDF. The topics addressed in these templates are Insurer, Global Customers, Insurance Executives. All the content presented in this PPT design is completely editable. Download it and make adjustments in color, background, font etc. as per your unique business setting.

Buy Side Advisory Services In M And A Top Deals Count Split By Sectors Summary PDF
The slide covers the name and designation of the team executivesCEO, CFO, Department head etc. of the company. It also provides the Major Transaction Experience work experience of the executives. If your project calls for a presentation, then Slidegeeks is your go-to partner because we have professionally designed, easy-to-edit templates that are perfect for any presentation. After downloading, you can easily edit Buy Side Advisory Services In M And A Top Deals Count Split By Sectors Summary PDF and make the changes accordingly. You can rearrange slides or fill them with different images. Check out all the handy templates.
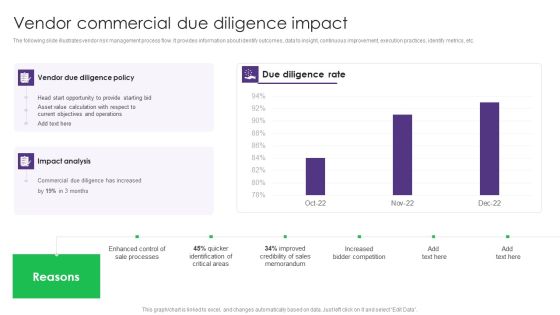
Vendor Commercial Due Diligence Impact Vendor Management System Deployment Infographics PDF
The following slide illustrates vendor risk management process flow. It provides information about identify outcomes, data to insight, continuous improvement, execution practices, identify metrics, etc. The Vendor Commercial Due Diligence Impact Vendor Management System Deployment Infographics PDF is a compilation of the most recent design trends as a series of slides. It is suitable for any subject or industry presentation, containing attractive visuals and photo spots for businesses to clearly express their messages. This template contains a variety of slides for the user to input data, such as structures to contrast two elements, bullet points, and slides for written information. Slidegeeks is prepared to create an impression.
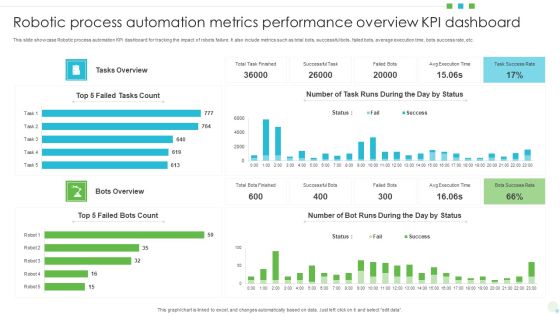
Robotic Process Automation Metrics Performance Overview KPI Dashboard Download PDF
This slide showcase Robotic process automation KPI dashboard for tracking the impact of robots failure. It also include metrics such as total bots, successful bots, failed bots, average execution time, bots success rate, etc. Showcasing this set of slides titled Robotic Process Automation Metrics Performance Overview KPI Dashboard Download PDF. The topics addressed in these templates are Robotic Process Automation, Metrics Performance Overview, Kpi Dashboard. All the content presented in this PPT design is completely editable. Download it and make adjustments in color, background, font etc. as per your unique business setting.

B2b Selling Tactics Dashboard To Maintain Productivity Introduction PDF
The following slide represents B2B selling tactics dashboard which allows executives and managers to effectively control sales and monitor them in one central place. It consists of total sales, payments, trends etc.Pitch your topic with ease and precision using this B2b Selling Tactics Dashboard To Maintain Productivity Introduction PDF. This layout presents information on Operational Effects, Stores Sales Trend, Conversion Rate. It is also available for immediate download and adjustment. So, changes can be made in the color, design, graphics or any other component to create a unique layout.
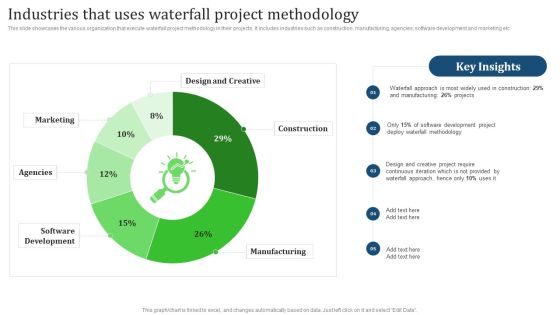
Industries That Uses Waterfall Project Methodology Pictures PDF
This slide showcases the various organization that execute waterfall project methodology in their projects. It includes industries such as construction, manufacturing, agencies, software development and marketing etc. From laying roadmaps to briefing everything in detail, our templates are perfect for you. You can set the stage with your presentation slides. All you have to do is download these easy-to-edit and customizable templates. Industries That Uses Waterfall Project Methodology Pictures PDF will help you deliver an outstanding performance that everyone would remember and praise you for. Do download this presentation today.

Business Vendor Performance Dashboard KPI With Top Supplier For Manufacturing Business Information PDF
Following slide contains executive dashboard which provide managers to track and monitor trends over a period of time. This include elements such as revenue, top products, top supplier, top customer, revenue trends annually, etc. Showcasing this set of slides titled Business Vendor Performance Dashboard KPI With Top Supplier For Manufacturing Business Information PDF. The topics addressed in these templates are Customers, Product, Sales. All the content presented in this PPT design is completely editable. Download it and make adjustments in color, background, font etc. as per your unique business setting.
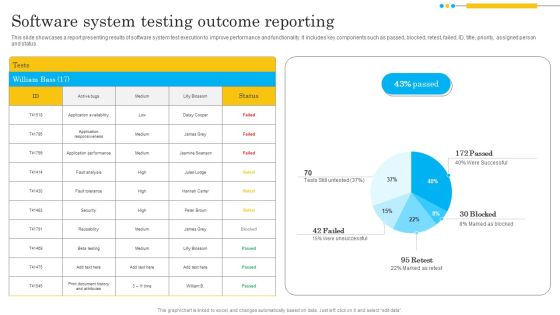
Software System Testing Outcome Reporting Infographics PDF
This slide showcases a report presenting results of software system test execution to improve performance and functionality. It includes key components such as passed, blocked, retest, failed, ID, title, priority, assigned person and status. Showcasing this set of slides titled Software System Testing Outcome Reporting Infographics PDF. The topics addressed in these templates are Application Responsiveness, Application Performance, Security. All the content presented in this PPT design is completely editable. Download it and make adjustments in color, background, font etc. as per your unique business setting.

Clustered Column Line Chart Ppt PowerPoint Presentation Professional Slides
This is a clustered column line chart ppt powerpoint presentation professional slides. This is a four stage process. The stages in this process are bar, finance, business, marketing, growth.

High Low Close Chart Ppt PowerPoint Presentation Layouts Guide
This is a high low close chart ppt powerpoint presentation layouts guide. This is a ten stage process. The stages in this process are high, volume, low, business, marketing, finance.
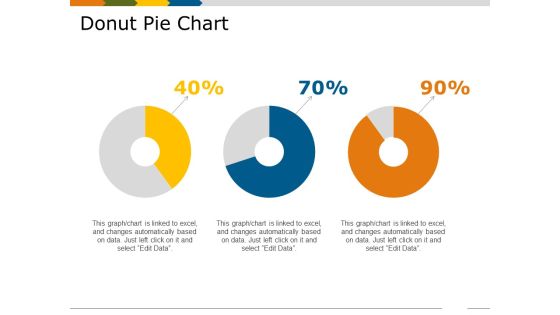
Donut Pie Chart Template 2 Ppt PowerPoint Presentation Show Skills
This is a donut pie chart template 2 ppt powerpoint presentation show skills. This is a three stage process. The stages in this process are percentage, business, marketing, process, finance.

High Low Close Chart Ppt PowerPoint Presentation Ideas Brochure
This is a high low close chart ppt powerpoint presentation ideas brochure. This is a three stage process. The stages in this process are in percentage, product, business, marketing, finance.

Scatter Bubble Chart Ppt PowerPoint Presentation Infographic Template Examples
This is a scatter bubble chart ppt powerpoint presentation infographic template examples. This is a two stage process. The stages in this process are highest sale, product, in price, finance, business.
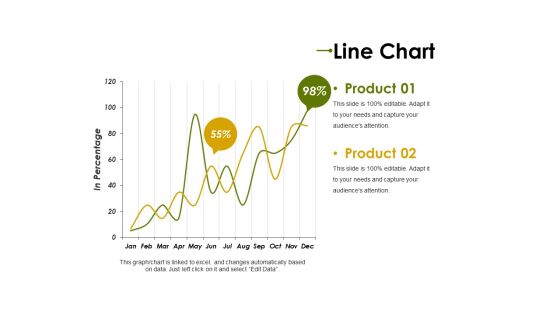
Line Chart Ppt PowerPoint Presentation Professional Clipart Images
This is a line chart ppt powerpoint presentation professional clipart images. This is a two stage process. The stages in this process are product, in percentage, graph, percentage, finance, business.
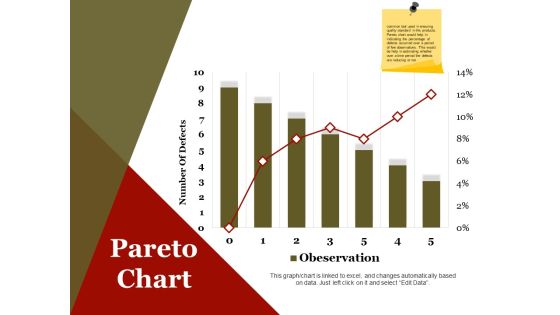
Pareto Chart Ppt PowerPoint Presentation Infographics Design Inspiration
This is a pareto chart ppt powerpoint presentation infographics design inspiration. This is a seven stage process. The stages in this process are number of defects, business, marketing, finance.
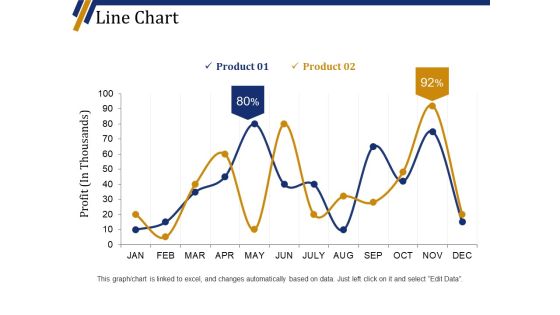
Line Chart Ppt PowerPoint Presentation Portfolio Background Designs
This is a line chart ppt powerpoint presentation portfolio background designs. This is a two stage process. The stages in this process are product, business, finance, marketing, profit in thousands.
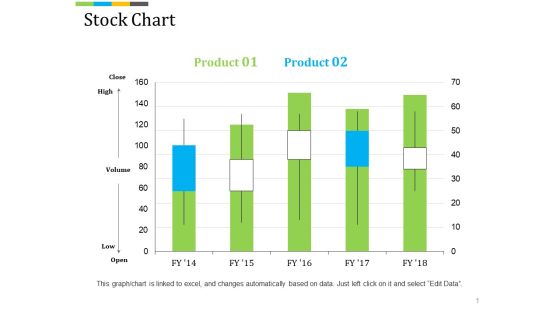
Stock Chart Ppt PowerPoint Presentation Professional Background Image
This is a stock chart ppt powerpoint presentation professional background image. This is a five stage process. The stages in this process are high, volume, low, finance, business, marketing.

Stock Chart Ppt PowerPoint Presentation Summary File Formats
This is a stock chart ppt powerpoint presentation summary file formats. This is a five stage process. The stages in this process are high, volume, low, business, graph, finance.

Column Chart Ppt PowerPoint Presentation Show Master Slide
This is a column chart ppt powerpoint presentation show master slide. This is a six stage process. The stages in this process are financial, years, business, marketing, finance, graph.

Scatter Bubble Chart Ppt PowerPoint Presentation Gallery Example Introduction
This is a scatter bubble chart ppt powerpoint presentation gallery example introduction. This is a eight stage process. The stages in this process are business, marketing, finance, bubble, scatter.
Scatter Chart Template 2 Ppt PowerPoint Presentation Slides Icons
This is a scatter chart template 2 ppt powerpoint presentation slides icons. This is a two stage process. The stages in this process are business, marketing, graph, in percentage, finance.
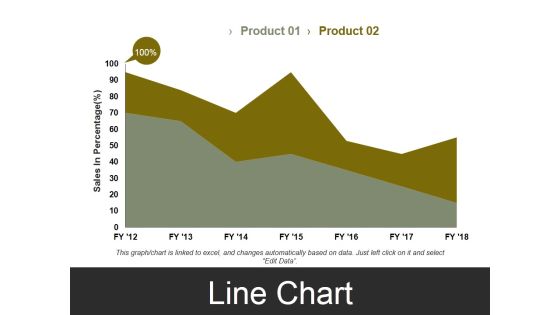
Line Chart Template 3 Ppt PowerPoint Presentation Styles Visual Aids
This is a line chart template 3 ppt powerpoint presentation styles visual aids. This is a two stage process. The stages in this process are sales in percentage, business, marketing, finance, graph.

Clustered Column Chart Ppt PowerPoint Presentation Show Slideshow
This is a clustered column chart ppt powerpoint presentation show slideshow. This is a six stage process. The stages in this process are financial year in, sales in percentage, business, marketing, finance.

Scatter Bubble Chart Ppt PowerPoint Presentation Gallery Show
This is a scatter bubble chart ppt powerpoint presentation gallery show. This is a two stage process. The stages in this process are profit, in percentage, finance, marketing, business.

Area Chart Ppt PowerPoint Presentation Portfolio Graphics Design
This is a area chart ppt powerpoint presentation portfolio graphics design. This is a two stage process. The stages in this process are business, marketing, in percentage, graph, finance.

Bar Chart Ppt PowerPoint Presentation Summary File Formats
This is a bar chart ppt powerpoint presentation summary file formats. This is a two stage process. The stages in this process are business, finance, financial years, sales in percentage, graph.

Column Chart Ppt PowerPoint Presentation Layouts Graphic Images
This is a column chart ppt powerpoint presentation layouts graphic images. This is a two stage process. The stages in this process are business, finance, years, graph, expenditure in, marketing.

Combo Chart Ppt PowerPoint Presentation Gallery Design Ideas
This is a combo chart ppt powerpoint presentation gallery design ideas. This is a three stage process. The stages in this process are business, financial years, sales in percentage, finance, graph.

Area Chart Ppt PowerPoint Presentation Layouts Graphic Images
This is a area chart ppt powerpoint presentation layouts graphic images. This is a three stage process. The stages in this process are business, in years, marketing, in percentage, finance, graph.

Commercial Property Evaluation Techniques Financial Infographics PDF
This is a commercial property evaluation techniques financial infographics pdf template with various stages. Focus and dispense information on three stages using this creative set, that comes with editable features. It contains large content boxes to add your information on topics like minimum, medium, maximum. You can also showcase facts, figures, and other relevant content using this PPT layout. Grab it now.
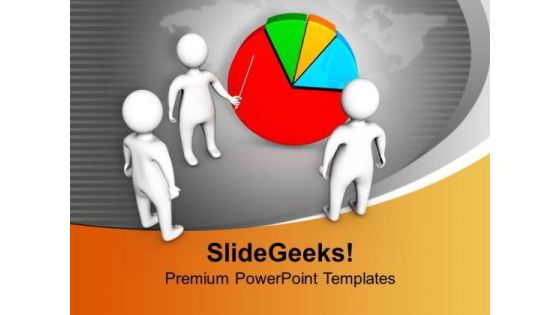
Businessman Presenting Statistical Chart PowerPoint Templates Ppt Backgrounds For Slides 0313
We present our Businessman Presenting Statistical Chart PowerPoint Templates PPT Backgrounds For Slides 0313.Use our Marketing PowerPoint Templates because Your ideas provide food for thought. Our PowerPoint Templates and Slides will help you create a dish to tickle the most discerning palate. Use our Finance PowerPoint Templates because It will Raise the bar of your Thoughts. They are programmed to take you to the next level. Download and present our People PowerPoint Templates because You can Rise to the occasion with our PowerPoint Templates and Slides. You will bring your audience on their feet in no time. Download and present our Pie charts PowerPoint Templates because Our PowerPoint Templates and Slides will let your ideas bloom. Create a bed of roses for your audience. Download and present our Business PowerPoint Templates because our PowerPoint Templates and Slides are the string of your bow. Fire of your ideas and conquer the podium.Use these PowerPoint slides for presentations relating to person pointing a pie chart, people, business, marketing, pie chart, finance. The prominent colors used in the PowerPoint template are Green, Red, White.
Pie Chart For Marketing And Business PowerPoint Templates Ppt Backgrounds For Slides 0413
We present our Pie Chart For Marketing And Business PowerPoint Templates PPT Backgrounds For Slides 0413.Present our Finance PowerPoint Templates because you should once Tap the ingenuity of our PowerPoint Templates and Slides. They are programmed to succeed. Download and present our Marketing PowerPoint Templates because You can Hit the nail on the head with our PowerPoint Templates and Slides. Embed your ideas in the minds of your audience. Download our Success PowerPoint Templates because Our PowerPoint Templates and Slides will let you Leave a lasting impression to your audiences. They possess an inherent longstanding recall factor. Download and present our Pie chart PowerPoint Templates because Our PowerPoint Templates and Slides will effectively help you save your valuable time. They are readymade to fit into any presentation structure. Use our Business PowerPoint Templates because you can Set pulses racing with our PowerPoint Templates and Slides. They will raise the expectations of your team.Use these PowerPoint slides for presentations relating to Pie chart, finance, marketing, business, success, pie chart. The prominent colors used in the PowerPoint template are Blue, Red, Green.

Chart With Percents Business Marketing PowerPoint Templates And PowerPoint Backgrounds 0611
Microsoft PowerPoint Template and Background with chart with percents
Chart With Percents Business Marketing PowerPoint Themes And PowerPoint Slides 0611
Microsoft PowerPoint Theme and Slide with chart with percents
Food Company Financial Performance Summary Historical Food Product Sales Chart Icons PDF
The following slide shows the comparative sales growth of agricultural products and processed foods. It shows the product sales from more than three decades to assess the change in demand of company products. This Food Company Financial Performance Summary Historical Food Product Sales Chart Icons PDF from Slidegeeks makes it easy to present information on your topic with precision. It provides customization options, so you can make changes to the colors, design, graphics, or any other component to create a unique layout. It is also available for immediate download, so you can begin using it right away. Slidegeeks has done good research to ensure that you have everything you need to make your presentation stand out. Make a name out there for a brilliant performance.

Comparison Of Social Media Platforms To Run Online Ads Ppt PowerPoint Presentation Diagram Graph Charts PDF
This slide showcases comparative assessment of social media channels which can help marketers to identify ideal platform for running ad campaigns. Its key components are platform, worldwide users, user demographics, B2B and B2C Slidegeeks is here to make your presentations a breeze with Comparison Of Social Media Platforms To Run Online Ads Ppt PowerPoint Presentation Diagram Graph Charts PDF With our easy to use and customizable templates, you can focus on delivering your ideas rather than worrying about formatting. With a variety of designs to choose from, you are sure to find one that suits your needs. And with animations and unique photos, illustrations, and fonts, you can make your presentation pop. So whether you are giving a sales pitch or presenting to the board, make sure to check out Slidegeeks first.

Goal Pie Chart Concept Business PowerPoint Templates And PowerPoint Themes 0612
Goal Pie Chart Concept Business PowerPoint Templates And PowerPoint Themes PPT Slides-Microsoft Powerpoint Templates and Background with pie chart concept

Cloud Platform Migration With Business Workload Forecast Introduction PDF Structure PDF
The following slide illustrates the forecasts of cloud platform migration usage in allocating multiple business workloads. It includes information about on premises, public, private and hybrid cloud platforms along with workload allocation projections. This can assist businesses in choosing most efficient system for doing operations.Showcasing this set of slides titled Cloud Platform Migration With Business Workload Forecast Introduction PDF Structure PDF. The topics addressed in these templates are Cloud Platform Migration With Business Workload Forecast. All the content presented in this PPT design is completely editable. Download it and make adjustments in color, background, font etc. as per your unique business setting.

Monthly Real Estate Sales Dashboard For Real Estate Business Ppt PowerPoint Presentation File Skills PDF
This slide showcases property sales dashboard to track progress and communicate key development to management. It further includes details such as US sales, target per employee, top selling segments, etc. Showcasing this set of slides titled Monthly Real Estate Sales Dashboard For Real Estate Business Ppt PowerPoint Presentation File Skills PDF. The topics addressed in these templates are Top 5 Sales Segments, Sold Units By State, Top 10 Projects, Sales Vs Target Per Agent. All the content presented in this PPT design is completely editable. Download it and make adjustments in color, background, font etc. as per your unique business setting.

Dashboard Depicting Client Portfolio Insights Template PDF
This slide focuses on the dashboard that depicts the insights about customer profiles which includes project manager name, gander, address, business phone, segments with timeline, brand affinities, interests, average online spend, churn risk, etc.Showcasing this set of slides titled Dashboard Depicting Client Portfolio Insights Template PDF The topics addressed in these templates are Brand Affinities, Interests Similar, Average Spend All the content presented in this PPT design is completely editable. Download it and make adjustments in color, background, font etc. as per your unique business setting.

Capacity Allotment Management Dashboard With Staff Demand Rules PDF
This slide shows Capacity Allocation Dashboard with Staff Demand which can be beneficial for project managers to effectively manage multiple tasks with optimum time allocation of workers. It includes information about capacity forecast, staff demand, allocation audit, users, etc. Showcasing this set of slides titled Capacity Allotment Management Dashboard With Staff Demand Rules PDF. The topics addressed in these templates are Capacity Forecast, Allocation Audit, Unstaffed Demand. All the content presented in this PPT design is completely editable. Download it and make adjustments in color, background, font etc. as per your unique business setting.

Financial Forecast And Essential Metrics Dashboard Showing Cash Management Designs PDF
This slide contains the projections of the company financials to predict the future position so that better decisions could be taken for the growth prospective. It also includes ratios, cash balance, inventory analysis , etc. Showcasing this set of slides titled Financial Forecast And Essential Metrics Dashboard Showing Cash Management Designs PDF. The topics addressed in these templates are Days Sales Outstanding, Cash Management Dashboard, Days Inventory Outstanding. All the content presented in this PPT design is completely editable. Download it and make adjustments in color, background, font etc. as per your unique business setting.

Cyber Security Threat Dashboard With KPI Metrics Icons PDF
This slide shows dashboard of cyber threats to organization and metrics and performance indicators for security officer. It covers operational health, audit and compliance, controls health and project status. Showcasing this set of slides titled Cyber Security Threat Dashboard With KPI Metrics Icons PDF. The topics addressed in these templates are Cyber Security Threat Dashboard, Kpi Metrics. All the content presented in this PPT design is completely editable. Download it and make adjustments in color, background, font etc. as per your unique business setting.
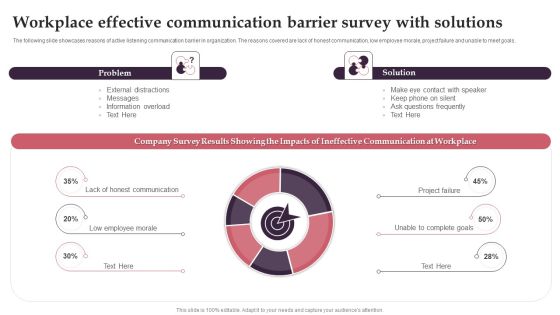
Workplace Effective Communication Barrier Survey With Solutions Elements PDF
The following slide showcases reasons of active listening communication barrier in organization. The reasons covered are lack of honest communication, low employee morale, project failure and unable to meet goals. Showcasing this set of slides titled Workplace Effective Communication Barrier Survey With Solutions Elements PDF. The topics addressed in these templates are Workplace Effective Communication, Barrier Survey With Solutions. All the content presented in this PPT design is completely editable. Download it and make adjustments in color, background, font etc. as per your unique business setting.

Enterprise Workforce Performance Dashboard With Sprint Review Themes PDF
This slide illustrates project extended team KPI dashboard with sprints evaluation. It provides information about average cycle time, velocity history, sprint variance, capacity variance, committed variance, etc. Showcasing this set of slides titled Enterprise Workforce Performance Dashboard With Sprint Review Themes PDF. The topics addressed in these templates are Velocity History, Sprint Variance, Average Cycle, Time Per State. All the content presented in this PPT design is completely editable. Download it and make adjustments in color, background, font etc. as per your unique business setting.

Post Consumer Recycled Plastic Waste Market Statistics With Growth Rate Elements PDF
This slide covers a report on plastic recycling based on future projections. It includes CAGR rate, incremental growth from 2019-2023, annual growth rate, etc. Showcasing this set of slides titled Post Consumer Recycled Plastic Waste Market Statistics With Growth Rate Elements PDF. The topics addressed in these templates are Market Acceleration, Growth CAGR, Incremental Growth, 2021 To 2023. All the content presented in this PPT design is completely editable. Download it and make adjustments in color, background, font etc. as per your unique business setting.

Building Material And Expenses Analytics For Construction Site Designs PDF
This slide shows statistics for cash outflow in first six months of project and material requirement with rate per unit for build up area of 1000 SQFT. It includes details about fittings, cement, finishers, sand, steel, etc. Showcasing this set of slides titled Building Material And Expenses Analytics For Construction Site Designs PDF. The topics addressed in these templates are Building Material, Material Quantity, Construction Site. All the content presented in this PPT design is completely editable. Download it and make adjustments in color, background, font etc. as per your unique business setting.
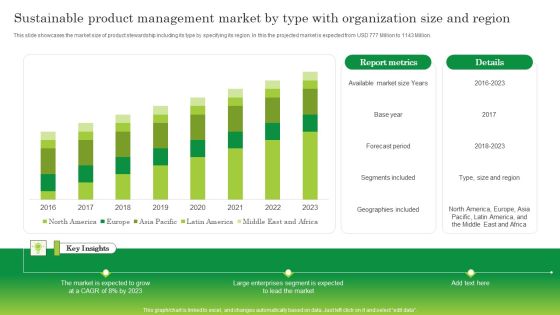
Sustainable Product Management Market By Type With Organization Size And Region Topics PDF
This slide showcases the market size of product stewardship including its type by specifying its region. In this the projected market is expected from USD 777 Million to 1143 Million. Showcasing this set of slides titled Sustainable Product Management Market By Type With Organization Size And Region Topics PDF. The topics addressed in these templates are Segments Included, Forecast Period, Available Market Size. All the content presented in this PPT design is completely editable. Download it and make adjustments in color, background, font etc. as per your unique business setting.

Negative Outcomes Resulting From Workplace Conflicts Clipart PDF
This slide shows according to the most recent workplace data, the coronavirus pandemic has had a significant impact on workplace patterns. It includes personal insults , resignations, project failure bullying, employees moving to different departments etc. Showcasing this set of slides titled Negative Outcomes Resulting From Workplace Conflicts Clipart PDF. The topics addressed in these templates are Percent Of Employees, Workplace Politics, Employee Satisfaction Ratings. All the content presented in this PPT design is completely editable. Download it and make adjustments in color, background, font etc. as per your unique business setting.
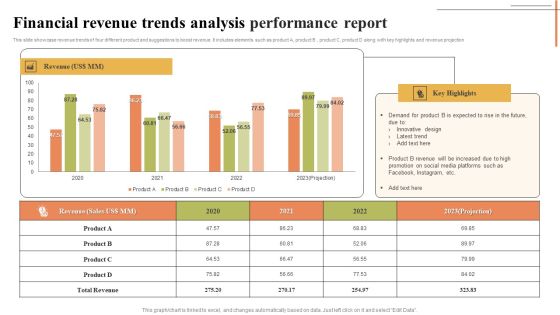
Financial Revenue Trends Analysis Performance Report Designs PDF
This slide showcase revenue trends of four different product and suggestions to boost revenue. It includes elements such as product A, product B , product C, product D along with key highlights and revenue projection. Showcasing this set of slides titled Financial Revenue Trends Analysis Performance Report Designs PDF. The topics addressed in these templates are Revenue, Innovative Design, Latest Trend. All the content presented in this PPT design is completely editable. Download it and make adjustments in color, background, font etc. as per your unique business setting.

KPI Dashboard To Track Best Market Opportunities For New Established Business Pictures PDF
Following slide showcases KPI dashboard to determine best market for launching new business. It includes key components such as growth rate by different industries, best states to launch startup, sales forecast, market growth forecast, projected sales by different states. Showcasing this set of slides titled KPI Dashboard To Track Best Market Opportunities For New Established Business Pictures PDF. The topics addressed in these templates are Forecasted Sales, Growth Rate, Startup Industries. All the content presented in this PPT design is completely editable. Download it and make adjustments in color, background, font etc. as per your unique business setting.
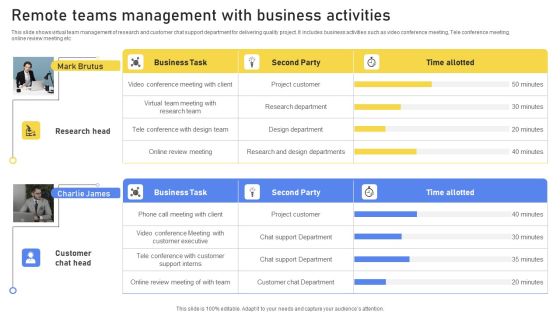
Remote Teams Management With Business Activities Graphics PDF
This slide shows virtual team management of research and customer chat support department for delivering quality project. It includes business activities such as video conference meeting, Tele conference meeting, online review meeting etc. Showcasing this set of slides titled Remote Teams Management With Business Activities Graphics PDF. The topics addressed in these templates are Research Head, Customer Chat Head, Business Task. All the content presented in this PPT design is completely editable. Download it and make adjustments in color, background, font etc. as per your unique business setting.

KPI Dashboard Highlighting Business Problems Microsoft PDF
This slide depicts a dashboard which highlights the problems faced by organizations to easily track the issues and offer solutions for the same. The various key performance indicators in this dashboard are pain points by status, unresolved pain points for march 2023 etc. Showcasing this set of slides titled KPI Dashboard Highlighting Business Problems Microsoft PDF. The topics addressed in these templates are Unresolved Pain Points, Resolved Pain Points, Project Components. All the content presented in this PPT design is completely editable. Download it and make adjustments in color, background, font etc. as per your unique business setting.
Tracking Performance Of Cloud Storage Deployment Dashboard Portrait PDF
The following slide highlights implementation of cloud storage performance tracking dashboard to improve innovation, to attain faster time to market. It includes components such as pinned folders, storage usage, recently used files, documents, images, videos, music, fonts, projects etc. Showcasing this set of slides titled Tracking Performance Of Cloud Storage Deployment Dashboard Portrait PDF. The topics addressed in these templates are Storage Usage, Dashboard, Tracking. All the content presented in this PPT design is completely editable. Download it and make adjustments in color, background, font etc. as per your unique business setting.

Key Areas Of Expenditure Guide To Enhance Organic Growth By Advancing Business Procedures Designs PDF
The following slide displays the cost breakdown or the areas of expenditure of the organization as is displays a tabular form of expenditure with the annual cost and its description. This is a Key Areas Of Expenditure Guide To Enhance Organic Growth By Advancing Business Procedures Designs PDF template with various stages. Focus and dispense information on one stage using this creative set, that comes with editable features. It contains large content boxes to add your information on topics like Cost Procurement, Audit Maintenance, Website Maintenance. You can also showcase facts, figures, and other relevant content using this PPT layout. Grab it now.
