AI PPT Maker
Templates
PPT Bundles
Design Services
Business PPTs
Business Plan
Management
Strategy
Introduction PPT
Roadmap
Self Introduction
Timelines
Process
Marketing
Agenda
Technology
Medical
Startup Business Plan
Cyber Security
Dashboards
SWOT
Proposals
Education
Pitch Deck
Digital Marketing
KPIs
Project Management
Product Management
Artificial Intelligence
Target Market
Communication
Supply Chain
Google Slides
Research Services
 One Pagers
All Categories
-
Home
- Customer Favorites
- Resource Plan
Resource Plan
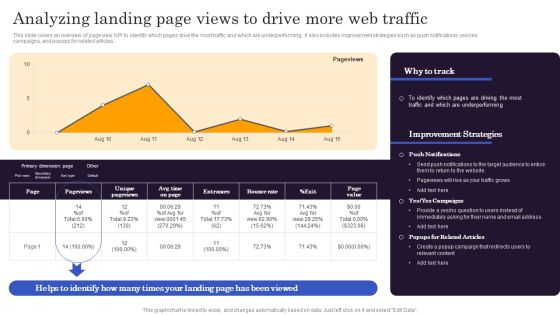
Marketers Guide To Data Analysis Optimization Analyzing Landing Page Views To Drive More Web Traffic Rules PDF
This slide covers an overview of page view KPI to identify which pages drive the most traffic and which are underperforming. It also includes improvement strategies such as push notifications, yes yes campaigns, and popups for related articles. Do you have an important presentation coming up Are you looking for something that will make your presentation stand out from the rest Look no further than Marketers Guide To Data Analysis Optimization Analyzing Landing Page Views To Drive More Web Traffic Rules PDF. With our professional designs, you can trust that your presentation will pop and make delivering it a smooth process. And with Slidegeeks, you can trust that your presentation will be unique and memorable. So why wait Grab Marketers Guide To Data Analysis Optimization Analyzing Landing Page Views To Drive More Web Traffic Rules PDF today and make your presentation stand out from the rest.
Marketers Guide To Data Analysis Optimization Tracking Social Media Engagement Rate For Improving Conversions Brochure PDF
This slide covers an overview of the social media engagement rate to identify if the content is reaching the target audience. It also includes improvement strategies such as having a consistent, authentic voice, knowing your algorithms, and creating shareable content. Do you have to make sure that everyone on your team knows about any specific topic I yes, then you should give Marketers Guide To Data Analysis Optimization Tracking Social Media Engagement Rate For Improving Conversions Brochure PDF a try. Our experts have put a lot of knowledge and effort into creating this impeccable Marketers Guide To Data Analysis Optimization Tracking Social Media Engagement Rate For Improving Conversions Brochure PDF. You can use this template for your upcoming presentations, as the slides are perfect to represent even the tiniest detail. You can download these templates from the Slidegeeks website and these are easy to edit. So grab these today.

Data Driven Marketing SMART Goals Of Enterprise Summary PDF
This slide represents the objectives to be achieved by the brand through the implementation of data driven marketing strategy. It includes details related to achievement of business goals such as customer acquisition rate and ROI. Do you have to make sure that everyone on your team knows about any specific topic I yes, then you should give Data Driven Marketing SMART Goals Of Enterprise Summary PDF a try. Our experts have put a lot of knowledge and effort into creating this impeccable Data Driven Marketing SMART Goals Of Enterprise Summary PDF. You can use this template for your upcoming presentations, as the slides are perfect to represent even the tiniest detail. You can download these templates from the Slidegeeks website and these are easy to edit. So grab these today

Ecommerce Data Driven Marketing Performance Analysis Dashboard Professional PDF
This slide represents the key metrics dashboard to track and analyze the performance of ecommerce business after implementing data driven marketing strategies. It includes details related to key metrics such as ecommerce revenue, new customers, repeat purchase rate etc. Get a simple yet stunning designed Ecommerce Data Driven Marketing Performance Analysis Dashboard Professional PDF. It is the best one to establish the tone in your meetings. It is an excellent way to make your presentations highly effective. So, download this PPT today from Slidegeeks and see the positive impacts. Our easy-to-edit Ecommerce Data Driven Marketing Performance Analysis Dashboard Professional PDF can be your go-to option for all upcoming conferences and meetings. So, what are you waiting for Grab this template today.

Impact Of Data Driven Marketing On Customer Engagement Rate Brochure PDF
This slide represents the impact of implemented data driven marketing strategies in enhancing customer engagement and building brand awareness. It includes details related to impact of data driven marketing on lead conversion rate and customer acquisition rate. Do you have an important presentation coming up Are you looking for something that will make your presentation stand out from the rest Look no further than Impact Of Data Driven Marketing On Customer Engagement Rate Brochure PDF. With our professional designs, you can trust that your presentation will pop and make delivering it a smooth process. And with Slidegeeks, you can trust that your presentation will be unique and memorable. So why wait Grab Impact Of Data Driven Marketing On Customer Engagement Rate Brochure PDF today and make your presentation stand out from the rest
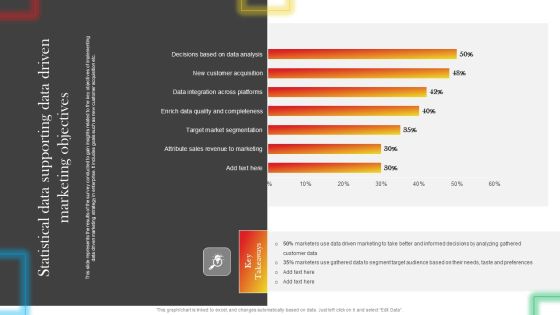
Statistical Data Supporting Data Driven Marketing Objectives Summary PDF
This slide represents the results of the survey conducted to gain insights related to the key objectives of implementing data driven marketing strategy in enterprise. It includes goals such as new customer acquisition etc. Are you in need of a template that can accommodate all of your creative concepts This one is crafted professionally and can be altered to fit any style. Use it with Google Slides or PowerPoint. Include striking photographs, symbols, depictions, and other visuals. Fill, move around, or remove text boxes as desired. Test out color palettes and font mixtures. Edit and save your work, or work with colleagues. Download Statistical Data Supporting Data Driven Marketing Objectives Summary PDF and observe how to make your presentation outstanding. Give an impeccable presentation to your group and make your presentation unforgettable.

IT Alignment For Strategic Introduction Of New Technologies And Services Elements PDF
This slide depicts the business strategy for introducing new technologies and services, including cloud, social, mobility, and big data. It also caters to the applications of these technologies in healthcare, high tech, public sector, retail, technology, software, hardware, and telecommunication. Slidegeeks has constructed IT Alignment For Strategic Introduction Of New Technologies And Services Elements PDF after conducting extensive research and examination. These presentation templates are constantly being generated and modified based on user preferences and critiques from editors. Here, you will find the most attractive templates for a range of purposes while taking into account ratings and remarks from users regarding the content. This is an excellent jumping-off point to explore our content and will give new users an insight into our top-notch PowerPoint Templates.
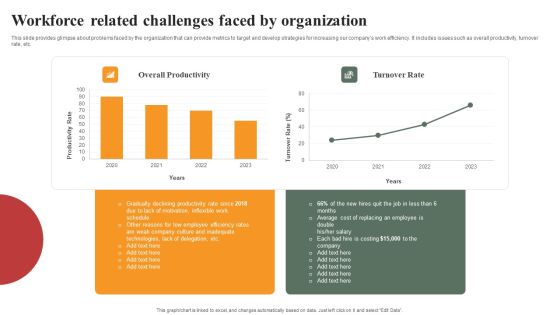
Optimizing Human Capital Alignment Workforce Related Challenges Faced By Organization Information PDF
This slide provides glimpse about problems faced by the organization that can provide metrics to target and develop strategies for increasing our companys work efficiency. It includes issues such as overall productivity, turnover rate, etc. Create an editable Optimizing Human Capital Alignment Workforce Related Challenges Faced By Organization Information PDF that communicates your idea and engages your audience. Whether you are presenting a business or an educational presentation, pre-designed presentation templates help save time. Optimizing Human Capital Alignment Workforce Related Challenges Faced By Organization Information PDF is highly customizable and very easy to edit, covering many different styles from creative to business presentations. Slidegeeks has creative team members who have crafted amazing templates. So, go and get them without any delay.

Comprehensive Guide To Build Marketing Traditional Marketing KPI Dashboard With Total Designs PDF
The following slide showcases the impact of offline marketing strategies on store performance. The key performance indicators KPIs mentioned in slide are sales, customers, average transaction price, average units per customer, top collections, sales by different segments, etc. Retrieve professionally designed Comprehensive Guide To Build Marketing Traditional Marketing KPI Dashboard With Total Designs PDF to effectively convey your message and captivate your listeners. Save time by selecting pre-made slideshows that are appropriate for various topics, from business to educational purposes. These themes come in many different styles, from creative to corporate, and all of them are easily adjustable and can be edited quickly. Access them as PowerPoint templates or as Google Slides themes. You do not have to go on a hunt for the perfect presentation because Slidegeeks got you covered from everywhere.

Key Production Challenges Faced By Organization Introduction PDF
This slide provides glimpse about problems faced by the organization that can provide metrics to target and develop strategies. It includes issues such as production wastage, production downtime with losses in hours and tons, etc. Crafting an eye catching presentation has never been more straightforward. Let your presentation shine with this tasteful yet straightforward Key Production Challenges Faced By Organization Introduction PDF template. It offers a minimalistic and classy look that is great for making a statement. The colors have been employed intelligently to add a bit of playfulness while still remaining professional. Construct the ideal Key Production Challenges Faced By Organization Introduction PDF that effortlessly grabs the attention of your audience Begin now and be certain to wow your customers.

Service Distinctiveness Customer Support Team Dashboard For Measuring Differentiation Mockup PDF
The following slide helps organization in understanding the effect of their differentiation strategy. It highlight essential metrics such as tickets raised by customer, support status and total unresolved tickets. Coming up with a presentation necessitates that the majority of the effort goes into the content and the message you intend to convey. The visuals of a PowerPoint presentation can only be effective if it supplements and supports the story that is being told. Keeping this in mind our experts created Service Distinctiveness Customer Support Team Dashboard For Measuring Differentiation Mockup PDF to reduce the time that goes into designing the presentation. This way, you can concentrate on the message while our designers take care of providing you with the right template for the situation.

Key Reasons To Adopt Influencer Marketing For Brand Promotion Topics PDF
This slide represents reasons why brands adopt influencer marketing as a strategy for brand advertising. It covers details regarding brand awareness, website traffic, SEO etc. Do you have to make sure that everyone on your team knows about any specific topic I yes, then you should give Key Reasons To Adopt Influencer Marketing For Brand Promotion Topics PDF a try. Our experts have put a lot of knowledge and effort into creating this impeccable Key Reasons To Adopt Influencer Marketing For Brand Promotion Topics PDF. You can use this template for your upcoming presentations, as the slides are perfect to represent even the tiniest detail. You can download these templates from the Slidegeeks website and these are easy to edit. So grab these today.
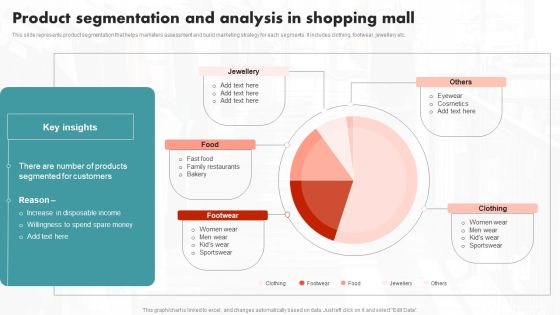
Product Segmentation And Analysis In Shopping Mall Ppt PowerPoint Presentation File Pictures PDF
This slide represents product segmentation that helps marketers assessment and build marketing strategy for each segments. It includes clothing, footwear, jewellery etc. Here you can discover an assortment of the finest PowerPoint and Google Slides templates. With these templates, you can create presentations for a variety of purposes while simultaneously providing your audience with an eye catching visual experience. Download Product Segmentation And Analysis In Shopping Mall Ppt PowerPoint Presentation File Pictures PDF to deliver an impeccable presentation. These templates will make your job of preparing presentations much quicker, yet still, maintain a high level of quality. Slidegeeks has experienced researchers who prepare these templates and write high quality content for you. Later on, you can personalize the content by editing the Product Segmentation And Analysis In Shopping Mall Ppt PowerPoint Presentation File Pictures PDF.
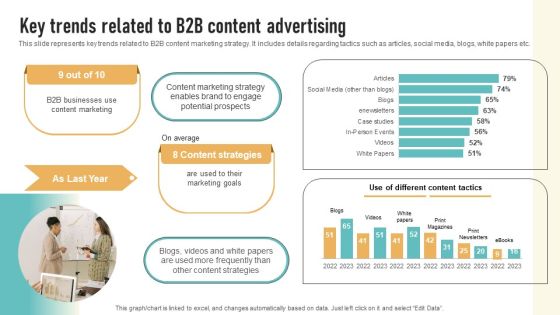
Key Trends Related To B2B Content Advertising Summary PDF
This slide represents key trends related to B2B content marketing strategy. It includes details regarding tactics such as articles, social media, blogs, white papers etc. Explore a selection of the finest Key Trends Related To B2B Content Advertising Summary PDF here. With a plethora of professionally designed and pre-made slide templates, you can quickly and easily find the right one for your upcoming presentation. You can use our Key Trends Related To B2B Content Advertising Summary PDF to effectively convey your message to a wider audience. Slidegeeks has done a lot of research before preparing these presentation templates. The content can be personalized and the slides are highly editable. Grab templates today from Slidegeeks.

Dashboard To Manage Marketing Campaigns Of Multiple Brands Ppt PowerPoint Presentation Diagram PDF
This slide showcases dashboard that can help organization to manage the marketing campaigns in multi brand strategy. Its key elements are lead breakdown, total leads, key conversion metrics etc. Coming up with a presentation necessitates that the majority of the effort goes into the content and the message you intend to convey. The visuals of a PowerPoint presentation can only be effective if it supplements and supports the story that is being told. Keeping this in mind our experts created Dashboard To Manage Marketing Campaigns Of Multiple Brands Ppt PowerPoint Presentation Diagram PDF to reduce the time that goes into designing the presentation. This way, you can concentrate on the message while our designers take care of providing you with the right template for the situation.

Extending Brand To Introduce New Commodities And Offerings Analyzing Major Performance Indicators Demonstration PDF
This slide showcases analyzing major performance indicators which can help branding managers to assess extension strategy KPIs. It provides details about market share, product line, launch, variants, color, size, net promotor score NPS, etc. Create an editable Extending Brand To Introduce New Commodities And Offerings Analyzing Major Performance Indicators Demonstration PDF that communicates your idea and engages your audience. Whether youre presenting a business or an educational presentation, pre designed presentation templates help save time. Extending Brand To Introduce New Commodities And Offerings Analyzing Major Performance Indicators Demonstration PDF is highly customizable and very easy to edit, covering many different styles from creative to business presentations. Slidegeeks has creative team members who have crafted amazing templates. So, go and get them without any delay.

Manufacturing Quality Assurance And Control Measures Key Production Challenges Faced By Organization Demonstration PDF
This slide provides glimpse about problems faced by the organization that can provide metrics to target and develop strategies. It includes issues such as production wastage, production downtime with losses in hours and tons, etc.The Manufacturing Quality Assurance And Control Measures Key Production Challenges Faced By Organization Demonstration PDF is a compilation of the most recent design trends as a series of slides. It is suitable for any subject or industry presentation, containing attractive visuals and photo spots for businesses to clearly express their messages. This template contains a variety of slides for the user to input data, such as structures to contrast two elements, bullet points, and slides for written information. Slidegeeks is prepared to create an impression.

Assessing Consumer Traffic Across Amazon Platform Ppt PowerPoint Presentation File Inspiration PDF
This slide provides information regarding user traffic analysis across amazon by tracking traffic trends, desktop and mobile traffic share and traffic generation strategy. Here you can discover an assortment of the finest PowerPoint and Google Slides templates. With these templates, you can create presentations for a variety of purposes while simultaneously providing your audience with an eye catching visual experience. Download Assessing Consumer Traffic Across Amazon Platform Ppt PowerPoint Presentation File Inspiration PDF to deliver an impeccable presentation. These templates will make your job of preparing presentations much quicker, yet still, maintain a high level of quality. Slidegeeks has experienced researchers who prepare these templates and write high quality content for you. Later on, you can personalize the content by editing the Assessing Consumer Traffic Across Amazon Platform Ppt PowerPoint Presentation File Inspiration PDF.
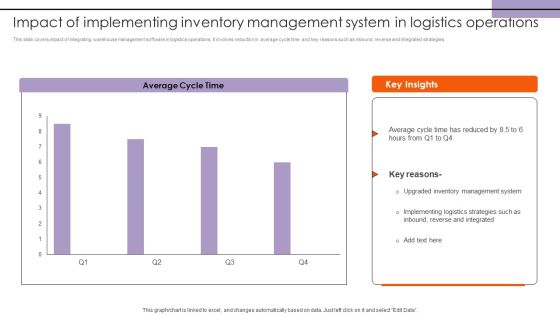
Impact Of Implementing Inventory Management System In Logistics Operations Download PDF
This slide covers impact of integrating warehouse management software in logistics operations. It involves reduction in average cycle time and key reasons such as inbound, reverse and integrated strategies. Presenting this PowerPoint presentation, titled Impact Of Implementing Inventory Management System In Logistics Operations Download PDF, with topics curated by our researchers after extensive research. This editable presentation is available for immediate download and provides attractive features when used. Download now and captivate your audience. Presenting this Impact Of Implementing Inventory Management System In Logistics Operations Download PDF. Our researchers have carefully researched and created these slides with all aspects taken into consideration. This is a completely customizable Impact Of Implementing Inventory Management System In Logistics Operations Download PDF that is available for immediate downloading. Download now and make an impact on your audience. Highlight the attractive features available with our PPTs.

Periodic Revenue Model Customer Churn Rate For Recurring Revenue Model Diagrams PDF
The purpose of the following slide is to show churn rate of the organization of the next 4 years and highlight the strategies that can be used to reduce the churn rate. Do you know about Slidesgeeks Periodic Revenue Model Customer Churn Rate For Recurring Revenue Model Diagrams PDF. These are perfect for delivering any kind od presentation. Using it, create PowerPoint presentations that communicate your ideas and engage audiences. Save time and effort by using our pre designed presentation templates that are perfect for a wide range of topic. Our vast selection of designs covers a range of styles, from creative to business, and are all highly customizable and easy to edit. Download as a PowerPoint template or use them as Google Slides themes.

Implementing Management System To Enhance Ecommerce Processes Five Years Forecasted Revenues And Profits Brochure PDF
This slide represents the graph showing forecasts revenues and profits to help ecommerce business to develop strategies for business growth and expansion. It represents forecasted revenue and profits for ABC ecommerce business for five years. Take your projects to the next level with our ultimate collection of Implementing Management System To Enhance Ecommerce Processes Five Years Forecasted Revenues And Profits Brochure PDF. Slidegeeks has designed a range of layouts that are perfect for representing task or activity duration, keeping track of all your deadlines at a glance. Tailor these designs to your exact needs and give them a truly corporate look with your own brand colors they will make your projects stand out from the rest.

Implementing Management System To Enhance Ecommerce Processes Key Metrics To Measure Current Performance Themes PDF
This slide represents the key performance indicators to track and monitor the performance of ecommerce website to draw effective strategies to tackle the problems. It includes key metrics for ecommerce website performance measurement such as average order value and shopping cart abandonment rate. Do you know about Slidesgeeks Implementing Management System To Enhance Ecommerce Processes Key Metrics To Measure Current Performance Themes PDF. These are perfect for delivering any kind od presentation. Using it, create PowerPoint presentations that communicate your ideas and engage audiences. Save time and effort by using our pre designed presentation templates that are perfect for a wide range of topic. Our vast selection of designs covers a range of styles, from creative to business, and are all highly customizable and easy to edit. Download as a PowerPoint template or use them as Google Slides themes.

Company Profile For Online Video Service Provider Disne User Demographics Us Slides PDF
The following slide highlights the segregation of Disney users based on the individual age and ethnicity for US population. It help streaming platform to develop future strategies based on demographics data analysis Do you have to make sure that everyone on your team knows about any specific topic I yes, then you should give Company Profile For Online Video Service Provider Disne User Demographics Us Slides PDF a try. Our experts have put a lot of knowledge and effort into creating this impeccable Company Profile For Online Video Service Provider Disne User Demographics Us Slides PDF. You can use this template for your upcoming presentations, as the slides are perfect to represent even the tiniest detail. You can download these templates from the Slidegeeks website and these are easy to edit. So grab these today.
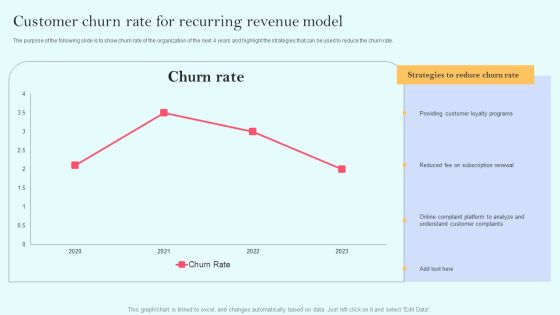
Recurring Income Generation Model Customer Churn Rate For Recurring Revenue Model Background PDF
The purpose of the following slide is to show churn rate of the organization of the next 4 years and highlight the strategies that can be used to reduce the churn rate. Formulating a presentation can take up a lot of effort and time, so the content and message should always be the primary focus. The visuals of the PowerPoint can enhance the presenters message, so our Recurring Income Generation Model Customer Churn Rate For Recurring Revenue Model Background PDF was created to help save time. Instead of worrying about the design, the presenter can concentrate on the message while our designers work on creating the ideal templates for whatever situation is needed. Slidegeeks has experts for everything from amazing designs to valuable content, we have put everything into Recurring Income Generation Model Customer Churn Rate For Recurring Revenue Model Background PDF

Digital Transformation Checklist To Accelerate Innovation In Business Dashboard For Digital Enablement Formats PDF
The purpose of this slide is to provide information regarding the dashboard that will determine digital enablement efforts of the firm in the areas of strategy, customer experience, organizational alignment, people and culture, etc. Coming up with a presentation necessitates that the majority of the effort goes into the content and the message you intend to convey. The visuals of a PowerPoint presentation can only be effective if it supplements and supports the story that is being told. Keeping this in mind our experts created Digital Transformation Checklist To Accelerate Innovation In Business Dashboard For Digital Enablement Formats PDF to reduce the time that goes into designing the presentation. This way, you can concentrate on the message while our designers take care of providing you with the right template for the situation.

Key Production Challenges Faced By Organization Microsoft PDF
This slide provides glimpse about problems faced by the organization that can provide metrics to target and develop strategies. It includes issues such as production wastage, production downtime with losses in hours and tons, etc. This Key Production Challenges Faced By Organization Microsoft PDF from Slidegeeks makes it easy to present information on your topic with precision. It provides customization options, so you can make changes to the colors, design, graphics, or any other component to create a unique layout. It is also available for immediate download, so you can begin using it right away. Slidegeeks has done good research to ensure that you have everything you need to make your presentation stand out. Make a name out there for a brilliant performance.

Dashboard To Evaluate Digital Transformation Process Graphics PDF
This slide showcases the KPIs that would help a business organization to evaluate improvements in the new digital transformation process. It includes strategy, data, digital vitality score, organizational alignment, etc. Here you can discover an assortment of the finest PowerPoint and Google Slides templates. With these templates, you can create presentations for a variety of purposes while simultaneously providing your audience with an eye catching visual experience. Download Dashboard To Evaluate Digital Transformation Process Graphics PDF to deliver an impeccable presentation. These templates will make your job of preparing presentations much quicker, yet still, maintain a high level of quality. Slidegeeks has experienced researchers who prepare these templates and write high quality content for you. Later on, you can personalize the content by editing the Dashboard To Evaluate Digital Transformation Process Graphics PDF.
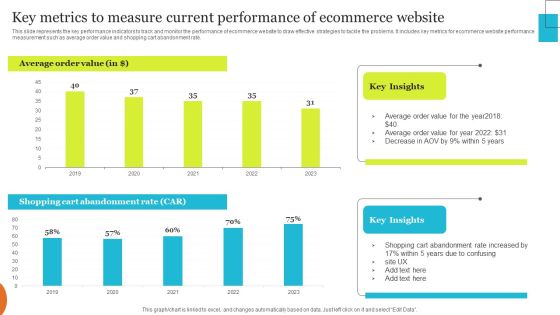
Implementing Effective Ecommerce Managemnet Platform Key Metrics To Measure Current Performance Clipart PDF
This slide represents the key performance indicators to track and monitor the performance of ecommerce website to draw effective strategies to tackle the problems. It includes key metrics for ecommerce website performance measurement such as average order value and shopping cart abandonment rate. Want to ace your presentation in front of a live audience Our Implementing Effective Ecommerce Managemnet Platform Key Metrics To Measure Current Performance Clipart PDF can help you do that by engaging all the users towards you. Slidegeeks experts have put their efforts and expertise into creating these impeccable powerpoint presentations so that you can communicate your ideas clearly. Moreover, all the templates are customizable, and easy to edit and downloadable. Use these for both personal and commercial use.

Email Newsletter Dashboard Showing Campaign Performance Ppt PowerPoint Presentation File Infographic Template PDF
The following slide showcases a key performance indicator KPI dashboard through which managers can measure the impact of email marketing strategy on business performance. The metrics covered in the slide are total conversions, new subscribers, etc. Coming up with a presentation necessitates that the majority of the effort goes into the content and the message you intend to convey. The visuals of a PowerPoint presentation can only be effective if it supplements and supports the story that is being told. Keeping this in mind our experts created Email Newsletter Dashboard Showing Campaign Performance Ppt PowerPoint Presentation File Infographic Template PDF to reduce the time that goes into designing the presentation. This way, you can concentrate on the message while our designers take care of providing you with the right template for the situation.

Categories Of Segmenting And Profiling Customers Demographic Based Customer Segmentation Analysis Background PDF
This slide showcases analysis and segmentation of customers based on demographics factors to develop user specific marketing strategies. It showcases segmentation of male and female population based on factors like education, income, lifespan and age group. Are you in need of a template that can accommodate all of your creative concepts This one is crafted professionally and can be altered to fit any style. Use it with Google Slides or PowerPoint. Include striking photographs, symbols, depictions, and other visuals. Fill, move around, or remove text boxes as desired. Test out color palettes and font mixtures. Edit and save your work, or work with colleagues. Download Categories Of Segmenting And Profiling Customers Demographic Based Customer Segmentation Analysis Background PDF and observe how to make your presentation outstanding. Give an impeccable presentation to your group and make your presentation unforgettable.

Categories Of Segmenting And Profiling Customers Demographic Segmentation Analysis To Develop Themes PDF
This slide showcases analysis and segmentation of customers based on demographics factors to develop user specific marketing strategies. It showcases segmentation of male and female population based on factors like height, weight and age. Crafting an eye catching presentation has never been more straightforward. Let your presentation shine with this tasteful yet straightforward Categories Of Segmenting And Profiling Customers Demographic Segmentation Analysis To Develop Themes PDF template. It offers a minimalistic and classy look that is great for making a statement. The colors have been employed intelligently to add a bit of playfulness while still remaining professional. Construct the ideal Categories Of Segmenting And Profiling Customers Demographic Segmentation Analysis To Develop Themes PDF that effortlessly grabs the attention of your audience. Begin now and be certain to wow your customers.

Most Successful Tactics And Content Types For Marketers Ppt Infographics Design Ideas PDF
Following slide addresses information statistics on tactics and content type used by B2C marketers to ensure digital strategy success. Major tactics opted by marketers are social media ads, email marketing, PPC ads and print ads. Retrieve professionally designed Most Successful Tactics And Content Types For Marketers Ppt Infographics Design Ideas PDF to effectively convey your message and captivate your listeners. Save time by selecting pre made slideshows that are appropriate for various topics, from business to educational purposes. These themes come in many different styles, from creative to corporate, and all of them are easily adjustable and can be edited quickly. Access them as PowerPoint templates or as Google Slides themes. You do not have to go on a hunt for the perfect presentation because Slidegeeks got you covered from everywhere.
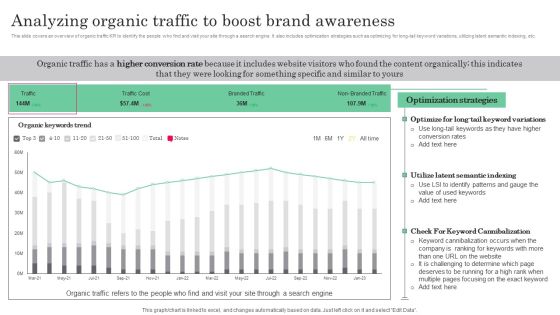
Online Marketing Analytics To Enhance Business Growth Analyzing Organic Traffic To Boost Brand Awareness Structure PDF
This slide covers an overview of organic traffic KPI to identify the people who find and visit your site through a search engine. It also includes optimization strategies such as optimizing for long-tail keyword variations, utilizing latent semantic indexing, etc. Create an editable Online Marketing Analytics To Enhance Business Growth Analyzing Organic Traffic To Boost Brand Awareness Structure PDF that communicates your idea and engages your audience. Whether youre presenting a business or an educational presentation, pre designed presentation templates help save time. Online Marketing Analytics To Enhance Business Growth Analyzing Organic Traffic To Boost Brand Awareness Structure PDF is highly customizable and very easy to edit, covering many different styles from creative to business presentations. Slidegeeks has creative team members who have crafted amazing templates. So, go and get them without any delay.
Online Marketing Analytics To Enhance Business Growth Tracking Social Media Engagement Rate For Improving Professional PDF
This slide covers an overview of the social media engagement rate to identify if the content is reaching the target audience. It also includes improvement strategies such as having a consistent, authentic voice, knowing your algorithms, and creating shareable content. Find highly impressive Online Marketing Analytics To Enhance Business Growth Tracking Social Media Engagement Rate For Improving Professional PDF on Slidegeeks to deliver a meaningful presentation. You can save an ample amount of time using these presentation templates. No need to worry to prepare everything from scratch because Slidegeeks experts have already done a huge research and work for you. You need to download Online Marketing Analytics To Enhance Business Growth Tracking Social Media Engagement Rate For Improving Professional PDF for your upcoming presentation. All the presentation templates are 100 percent editable and you can change the color and personalize the content accordingly. Download now.
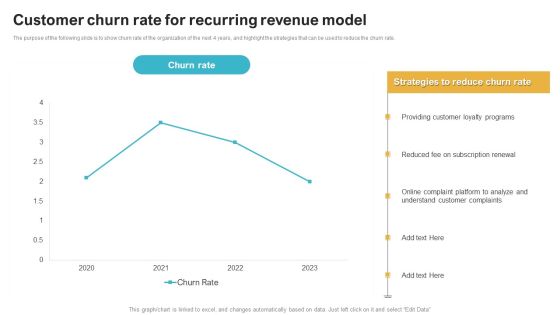
Saas Continuous Income Generation Model For Software Startup Customer Churn Rate For Recurring Revenue Model Summary PDF
The purpose of the following slide is to show churn rate of the organization of the next 4 years, and highlight the strategies that can be used to reduce the churn rate. Formulating a presentation can take up a lot of effort and time, so the content and message should always be the primary focus. The visuals of the PowerPoint can enhance the presenters message, so our Saas Continuous Income Generation Model For Software Startup Customer Churn Rate For Recurring Revenue Model Summary PDF was created to help save time. Instead of worrying about the design, the presenter can concentrate on the message while our designers work on creating the ideal templates for whatever situation is needed. Slidegeeks has experts for everything from amazing designs to valuable content, we have put everything into Saas Continuous Income Generation Model For Software Startup Customer Churn Rate For Recurring Revenue Model Summary PDF

Digitalized Business Checklist Dashboard For Digital Enablement Themes PDF
The purpose of this slide is to provide information regarding the dashboard that will determine digital enablement efforts of the firm in the areas of strategy, customer experience, organizational alignment, people and culture, etc. Formulating a presentation can take up a lot of effort and time, so the content and message should always be the primary focus. The visuals of the PowerPoint can enhance the presenters message, so our Digitalized Business Checklist Dashboard For Digital Enablement Themes PDF was created to help save time. Instead of worrying about the design, the presenter can concentrate on the message while our designers work on creating the ideal templates for whatever situation is needed. Slidegeeks has experts for everything from amazing designs to valuable content, we have put everything into Digitalized Business Checklist Dashboard For Digital Enablement Themes PDF.

Dashboard To Manage Marketing Campaigns Of Multiple Brands Summary PDF
This slide showcases dashboard that can help organization to manage the marketing campaigns in multi brand strategy. Its key elements are lead breakdown, total leads, key conversion metrics etc. Presenting this PowerPoint presentation, titled Dashboard To Manage Marketing Campaigns Of Multiple Brands Summary PDF, with topics curated by our researchers after extensive research. This editable presentation is available for immediate download and provides attractive features when used. Download now and captivate your audience. Presenting this Dashboard To Manage Marketing Campaigns Of Multiple Brands Summary PDF. Our researchers have carefully researched and created these slides with all aspects taken into consideration. This is a completely customizable Dashboard To Manage Marketing Campaigns Of Multiple Brands Summary PDF that is available for immediate downloading. Download now and make an impact on your audience. Highlight the attractive features available with our PPTs.
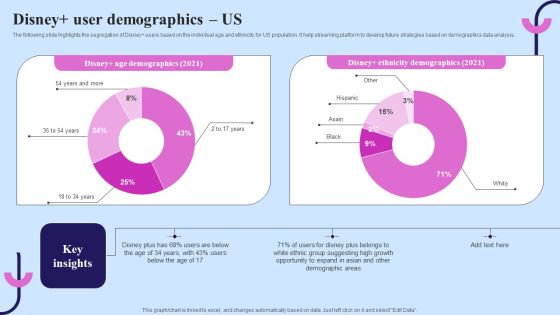
Video Streaming Technology Company Introduction Disney Plus User Demographics US Ideas PDF
The following slide highlights the segregation of Disney plus users based on the individual age and ethnicity for US population. It help streaming platform to develop future strategies based on demographics data analysis. This modern and well arranged Video Streaming Technology Company Introduction Disney Plus User Demographics US Ideas PDF provides lots of creative possibilities. It is very simple to customize and edit with the Powerpoint Software. Just drag and drop your pictures into the shapes. All facets of this template can be edited with Powerpoint no extra software is necessary. Add your own material, put your images in the places assigned for them, adjust the colors, and then you can show your slides to the world, with an animated slide included.

Major Reasons Of Employee Poor Performance Elements PDF
The following slide depicts the main causes of staff poor performance to formulate improvement strategies and assist decision making. It constitutes elements such as lack of skills, stressful work environment, inadequate training and development opportunities etc. Get a simple yet stunning designed Major Reasons Of Employee Poor Performance Elements PDF. It is the best one to establish the tone in your meetings. It is an excellent way to make your presentations highly effective. So, download this PPT today from Slidegeeks and see the positive impacts. Our easy to edit Major Reasons Of Employee Poor Performance Elements PDF can be your go to option for all upcoming conferences and meetings. So, what are you waiting for Grab this template today.

Dashboard To Manage Marketing Campaigns Of Multiple Brands Diagrams PDF
This slide showcases dashboard that can help organization to manage the marketing campaigns in multi brand strategy. Its key elements are lead breakdown, total leads, key conversion metrics etc. Here you can discover an assortment of the finest PowerPoint and Google Slides templates. With these templates, you can create presentations for a variety of purposes while simultaneously providing your audience with an eye catching visual experience. Download Dashboard To Manage Marketing Campaigns Of Multiple Brands Diagrams PDF to deliver an impeccable presentation. These templates will make your job of preparing presentations much quicker, yet still, maintain a high level of quality. Slidegeeks has experienced researchers who prepare these templates and write high quality content for you. Later on, you can personalize the content by editing the Dashboard To Manage Marketing Campaigns Of Multiple Brands Diagrams PDF.
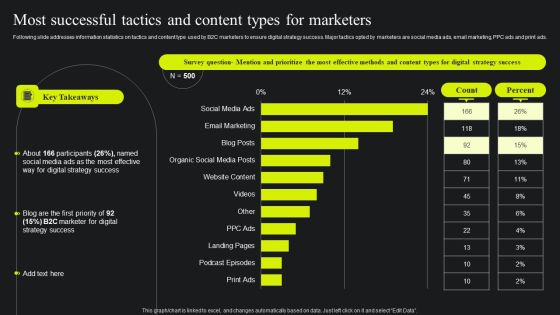
Most Successful Tactics And Content Types For Marketers Ppt Show Master Slide PDF
Following slide addresses information statistics on tactics and content type used by B2C marketers to ensure digital strategy success. Major tactics opted by marketers are social media ads, email marketing, PPC ads and print ads. Do you know about Slidesgeeks Most Successful Tactics And Content Types For Marketers Ppt Show Master Slide PDF These are perfect for delivering any kind od presentation. Using it, create PowerPoint presentations that communicate your ideas and engage audiences. Save time and effort by using our pre designed presentation templates that are perfect for a wide range of topic. Our vast selection of designs covers a range of styles, from creative to business, and are all highly customizable and easy to edit. Download as a PowerPoint template or use them as Google Slides themes.

Impact Of International Marketing On Business Growth Template PDF
This slide represents impact of global marketing strategies on organization growth. It includes increase in sales revenue and lead generation rate leading to revenue growth, market expansion etc. Formulating a presentation can take up a lot of effort and time, so the content and message should always be the primary focus. The visuals of the PowerPoint can enhance the presenters message, so our Impact Of International Marketing On Business Growth Template PDF was created to help save time. Instead of worrying about the design, the presenter can concentrate on the message while our designers work on creating the ideal templates for whatever situation is needed. Slidegeeks has experts for everything from amazing designs to valuable content, we have put everything into Impact Of International Marketing On Business Growth Template PDF.
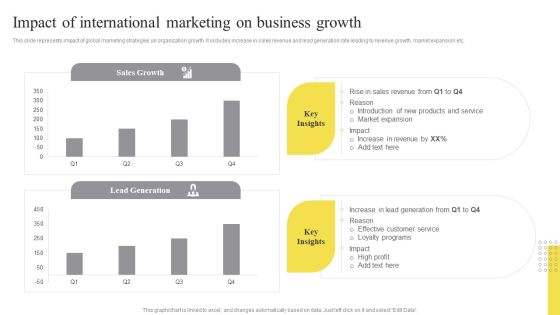
Impact Of International Marketing On Business Growth Ppt Layouts Master Slide PDF
This slide represents impact of global marketing strategies on organization growth. It includes increase in sales revenue and lead generation rate leading to revenue growth, market expansion etc. Find highly impressive Impact Of International Marketing On Business Growth Ppt Layouts Master Slide PDF on Slidegeeks to deliver a meaningful presentation. You can save an ample amount of time using these presentation templates. No need to worry to prepare everything from scratch because Slidegeeks experts have already done a huge research and work for you. You need to download Impact Of International Marketing On Business Growth Ppt Layouts Master Slide PDF for your upcoming presentation. All the presentation templates are 100 percent editable and you can change the color and personalize the content accordingly. Download now

Improving Buyer Journey Through Strategic Customer Engagement Dashboard Illustrating Customer Engagement Background PDF
This slide represents a dashboard highlighting organizations current KPI performance following the adoption of a successful customer engagement strategy. It includes Net promoter score, customer effort score, NPS and CES monthly growth and satisfaction score. Are you in need of a template that can accommodate all of your creative concepts This one is crafted professionally and can be altered to fit any style. Use it with Google Slides or PowerPoint. Include striking photographs, symbols, depictions, and other visuals. Fill, move around, or remove text boxes as desired. Test out color palettes and font mixtures. Edit and save your work, or work with colleagues. Download Improving Buyer Journey Through Strategic Customer Engagement Dashboard Illustrating Customer Engagement Background PDF and observe how to make your presentation outstanding. Give an impeccable presentation to your group and make your presentation unforgettable.

Data Driven Marketing Smart Goals Of Enterprise Ppt Show Ideas PDF
This slide represents the objectives to be achieved by the brand through the implementation of data driven marketing strategy. It includes details related to achievement of business goals such as customer acquisition rate and ROI. The Data Driven Marketing Smart Goals Of Enterprise Ppt Show Ideas PDF is a compilation of the most recent design trends as a series of slides. It is suitable for any subject or industry presentation, containing attractive visuals and photo spots for businesses to clearly express their messages. This template contains a variety of slides for the user to input data, such as structures to contrast two elements, bullet points, and slides for written information. Slidegeeks is prepared to create an impression.
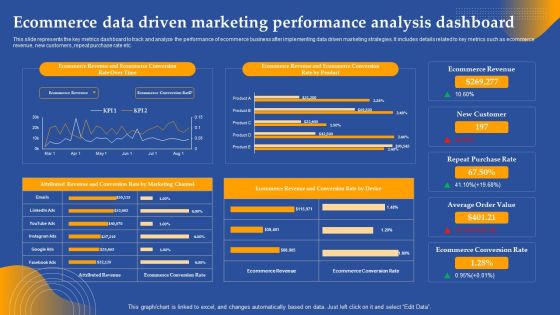
Ecommerce Data Driven Marketing Performance Analysis Dashboard Ppt Visual Aids Styles PDF
This slide represents the key metrics dashboard to track and analyze the performance of ecommerce business after implementing data driven marketing strategies. It includes details related to key metrics such as ecommerce revenue, new customers, repeat purchase rate etc. Slidegeeks has constructed Ecommerce Data Driven Marketing Performance Analysis Dashboard Ppt Visual Aids Styles PDF after conducting extensive research and examination. These presentation templates are constantly being generated and modified based on user preferences and critiques from editors. Here, you will find the most attractive templates for a range of purposes while taking into account ratings and remarks from users regarding the content. This is an excellent jumping off point to explore our content and will give new users an insight into our top notch PowerPoint Templates.

Data Driven Marketing Smart Goals Of Enterprise Ppt Summary Picture PDF
This slide represents the objectives to be achieved by the brand through the implementation of data driven marketing strategy. It includes details related to achievement of business goals such as customer acquisition rate and ROI. The Data Driven Marketing Smart Goals Of Enterprise Ppt Summary Picture PDF is a compilation of the most recent design trends as a series of slides. It is suitable for any subject or industry presentation, containing attractive visuals and photo spots for businesses to clearly express their messages. This template contains a variety of slides for the user to input data, such as structures to contrast two elements, bullet points, and slides for written information. Slidegeeks is prepared to create an impression.

Ecommerce Data Driven Marketing Performance Analysis Dashboard Ppt Pictures Demonstration PDF
This slide represents the key metrics dashboard to track and analyze the performance of ecommerce business after implementing data driven marketing strategies. It includes details related to key metrics such as ecommerce revenue, new customers, repeat purchase rate etc. Slidegeeks has constructed Ecommerce Data Driven Marketing Performance Analysis Dashboard Ppt Pictures Demonstration PDF after conducting extensive research and examination. These presentation templates are constantly being generated and modified based on user preferences and critiques from editors. Here, you will find the most attractive templates for a range of purposes while taking into account ratings and remarks from users regarding the content. This is an excellent jumping off point to explore our content and will give new users an insight into our top notch PowerPoint Templates.

Define Staff Roles And Responsibilities Clearly Employee Performance Management Template PDF
The following slide depicts the employee roles and responsibility chart to clarify roles and promote accountability. It mainly includes elements such as tasks, project manager, IT, finance team, scope statement, budget, quality services, work breakdown structure etc.There are so many reasons you need a Define Staff Roles And Responsibilities Clearly Employee Performance Management Template PDF. The first reason is you can notspend time making everything from scratch, Thus, Slidegeeks has made presentation templates for you too. You can easily download these templates from our website easily.

Donut Pie Chart Ppt PowerPoint Presentation Portfolio Vector
This is a donut pie chart ppt powerpoint presentation portfolio vector. This is a four stage process. The stages in this process are percentage, finance, donut, business.

Pie Chart Ppt PowerPoint Presentation Professional Graphic Images
This is a pie chart ppt powerpoint presentation professional graphic images. This is a four stage process. The stages in this process are product, percentage, pie, finance, business.
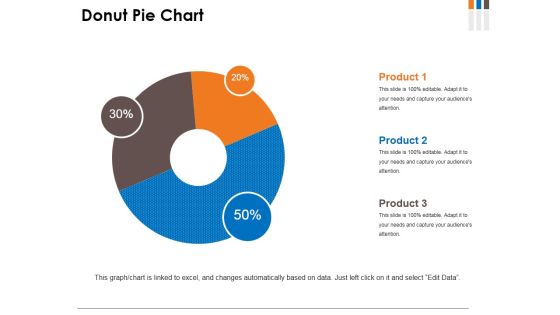
Donut Pie Chart Ppt PowerPoint Presentation Infographics Model
This is a donut pie chart ppt powerpoint presentation infographics model. This is a three stage process. The stages in this process are donut, business, marketing, percentage, finance.

Donut Pie Chart Ppt PowerPoint Presentation Professional Influencers
This is a donut pie chart ppt powerpoint presentation professional influencers. This is a five stage process. The stages in this process are product, percentage, finance, donut, business.
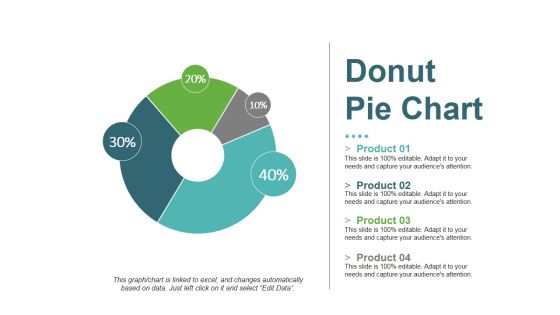
Donut Pie Chart Ppt PowerPoint Presentation Portfolio Sample
This is a donut pie chart ppt powerpoint presentation portfolio sample. This is a four stage process. The stages in this process are product, donut, percentage, finance, process.

Donut Pie Chart Ppt PowerPoint Presentation Layouts Visuals
This is a donut pie chart ppt powerpoint presentation layouts visuals. This is a five stage process. The stages in this process are product, donut, percentage, finance, business.

Donut Pie Chart Ppt PowerPoint Presentation Ideas Guide
This is a donut pie chart ppt powerpoint presentation ideas guide. This is a four stage process. The stages in this process are percentage, finance, donut, business, shapes.

Donut Pie Chart Ppt PowerPoint Presentation Show Introduction
This is a donut pie chart ppt powerpoint presentation show introduction. This is a five stage process. The stages in this process are percentage, finance, donut, business, product.

Donut Pie Chart Ppt PowerPoint Presentation Styles Example
This is a donut pie chart ppt powerpoint presentation styles example. This is a four stage process. The stages in this process are percentage, finance, donut, business, product.
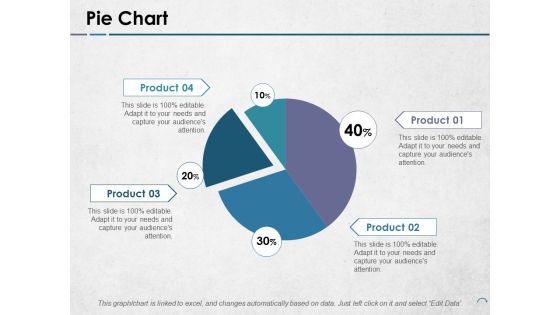
Pie Chart Ppt PowerPoint Presentation Infographics Example Topics
This is a pie chart ppt powerpoint presentation infographics example topics. This is a four stage process. The stages in this process are product, pie, process, percentage, finance.

Ecommerce Marketing Department And Operational Department Organizational Chart Structure PDF
This slide covers organization chart for ecommerce marketing, operations and merchandising teams. It includes key stakeholders such as director of e commerce, customer service. customer acquisition manager, retention manager, brand manager, social media manager, etc. Persuade your audience using this Ecommerce Marketing Department And Operational Department Organizational Chart Structure PDF. This PPT design covers nine stages, thus making it a great tool to use. It also caters to a variety of topics including System Administrator, Stock Planners, Customer Acquisition Manager. Download this PPT design now to present a convincing pitch that not only emphasizes the topic but also showcases your presentation skills.

Procedure To Develop Effective Product What Is Product Positioning In Marketing Ppt Ideas Graphics Tutorials PDF
This slide covers the meaning of product positioning for better product perception. It also includes communication elements for product positioning such as how the product can solve customer problems and better solutions for competitors products. Boost your pitch with our creative Procedure To Develop Effective Product What Is Product Positioning In Marketing Ppt Ideas Graphics Tutorials PDF. Deliver an awe-inspiring pitch that will mesmerize everyone. Using these presentation templates you will surely catch everyones attention. You can browse the ppts collection on our website. We have researchers who are experts at creating the right content for the templates. So you do not have to invest time in any additional work. Just grab the template now and use them.

Deployment Procedure Of Hyper Automation Artificial Intelligence Implementation In Business Process Infographics PDF
The following slide provides an overview of the implementation process of the AI into the business operations, the provided highlights the key steps such as Data gathering, Model Development , model testing and implementation. Boost your pitch with our creative Deployment Procedure Of Hyper Automation Artificial Intelligence Implementation In Business Process Infographics PDF. Deliver an awe inspiring pitch that will mesmerize everyone. Using these presentation templates you will surely catch everyones attention. You can browse the ppts collection on our website. We have researchers who are experts at creating the right content for the templates. So you do not have to invest time in any additional work. Just grab the template now and use them.
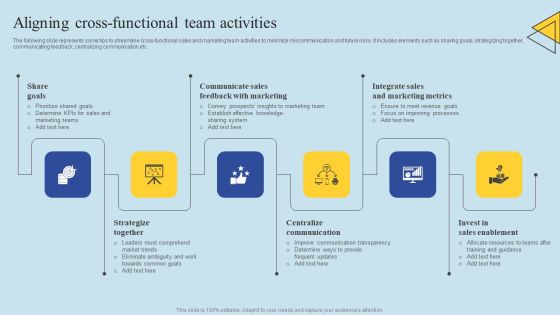
Determining Risks In Sales Administration Procedure Aligning Cross Functional Team Activities Structure PDF
The following slide represents some tips to streamline cross functional sales and marketing team activities to minimize miscommunication and future risks. It includes elements such as sharing goals, strategizing together, communicating feedback, centralizing communication etc. Boost your pitch with our creative Determining Risks In Sales Administration Procedure Aligning Cross Functional Team Activities Structure PDF. Deliver an awe-inspiring pitch that will mesmerize everyone. Using these presentation templates you will surely catch everyones attention. You can browse the ppts collection on our website. We have researchers who are experts at creating the right content for the templates. So you do not have to invest time in any additional work. Just grab the template now and use them.

Agile Technique For Request For Proposal RFP Response Agile Vs Traditional Approach Rpf Slides PDF
This slide provides the glimpse about the difference between agile and traditional approach which focuses on project objective, scope, changes, time, quality, trust and cost. Deliver an awe inspiring pitch with this creative agile technique for request for proposal rfp response agile vs traditional approach rpf slides pdf bundle. Topics like quality, trust, time, scope changes, objective of project can be discussed with this completely editable template. It is available for immediate download depending on the needs and requirements of the user.

Area Chart Ppt PowerPoint Presentation Model Influencers
This is a area chart ppt powerpoint presentation model influencers. This is a two stage process. The stages in this process are sales in percentage, chart, business, marketing, finance.
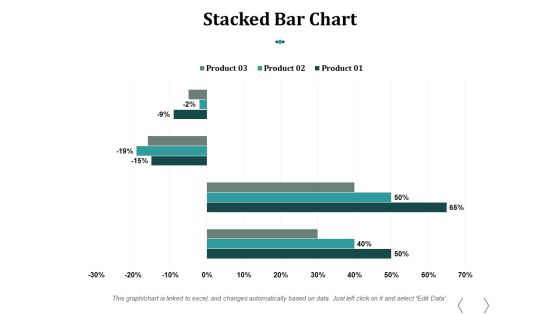
Stacked Bar Chart Ppt PowerPoint Presentation Influencers
This is a stacked bar chart ppt powerpoint presentation influencers. This is a three stage process. The stages in this process are stacked bar chart, product, percentage, finance, business.

Commodity Up Selling Key Statistics Ppt Model Background Image PDF
Presenting this set of slides with name commodity up selling key statistics ppt model background image pdf. This is a six stage process. The stages in this process are globally thirty percent of banks have opted cross selling technique in fy 2018, by opting cross selling technique, the customer retention rate of banks get increased by fourty three percent in usa. This is a completely editable PowerPoint presentation and is available for immediate download. Download now and impress your audience.

Pie Chart Business PowerPoint Templates And PowerPoint Backgrounds 0711
Microsoft PowerPoint Template and Background with a flat map of the world over top of a transparent three-segment bar chart

Pie Chart Business PowerPoint Themes And PowerPoint Slides 0711
Microsoft PowerPoint Theme and Slide with a flat map of the world over top of a transparent three-segment bar chart

Bar Chart Growth Business PowerPoint Templates And PowerPoint Themes 0612
Bar Chart Growth Business PowerPoint Templates And PowerPoint Themes PPT Slides-Microsoft Powerpoint Templates and Background with business success with arrow

Profits Bar Chart Sales PowerPoint Templates And PowerPoint Themes 0612
Profits Bar Chart Sales PowerPoint Templates And PowerPoint Themes PPT Slides-Microsoft Powerpoint Templates and Background with graph with arrow

Profits Bar Chart Success PowerPoint Templates And PowerPoint Themes 0612
Profits Bar Chart Success PowerPoint Templates And PowerPoint Themes PPT Slides-Microsoft Powerpoint Templates and Background with graph with arrow

Aviation Company Shareholder Structure And Organization Chart Brochure PDF
The slide carries a organizational chart and shareholding structure for aviation company to define voting rights. various elements included are shareholding structure, voting rights and organizational chart. Showcasing this set of slides titled Aviation Company Shareholder Structure And Organization Chart Brochure PDF. The topics addressed in these templates are Aviation Company Shareholder Structure, Organization Chart. All the content presented in this PPT design is completely editable. Download it and make adjustments in color, background, font etc. as per your unique business setting.

Addressing Estimated Revenues Breakdown Across Different Countries Professional PDF
This slide caters details about estimated revenues breakdown for agriculture firm across different countries. If you are looking for a format to display your unique thoughts, then the professionally designed Addressing Estimated Revenues Breakdown Across Different Countries Professional PDF is the one for you. You can use it as a Google Slides template or a PowerPoint template. Incorporate impressive visuals, symbols, images, and other charts. Modify or reorganize the text boxes as you desire. Experiment with shade schemes and font pairings. Alter, share or cooperate with other people on your work. Download Addressing Estimated Revenues Breakdown Across Different Countries Professional PDF and find out how to give a successful presentation. Present a perfect display to your team and make your presentation unforgettable.
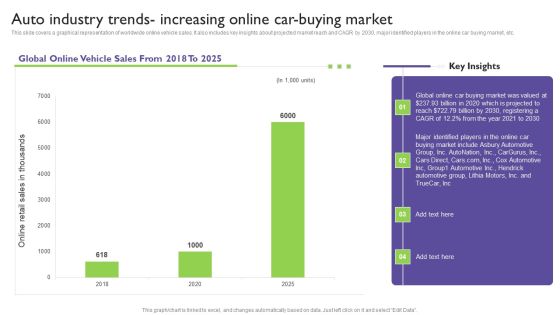
Global Automotive Industry Analysis Auto Industry Trends Increasing Online Car Buying Market Template PDF
This slide covers a graphical representation of worldwide online vehicle sales. It also includes key insights about projected market reach and CAGR by 2030, major identified players in the online car buying market, etc. If you are looking for a format to display your unique thoughts, then the professionally designed Global Automotive Industry Analysis Auto Industry Trends Increasing Online Car Buying Market Template PDF is the one for you. You can use it as a Google Slides template or a PowerPoint template. Incorporate impressive visuals, symbols, images, and other charts. Modify or reorganize the text boxes as you desire. Experiment with shade schemes and font pairings. Alter, share or cooperate with other people on your work. Download Global Automotive Industry Analysis Auto Industry Trends Increasing Online Car Buying Market Template PDF and find out how to give a successful presentation. Present a perfect display to your team and make your presentation unforgettable.

Dashboard Depicting Sales And Customer Analytics Infographics PDF
This slide focuses on dashboard that depicts sales and customer analytics which covers sales revenue, average transaction rate, out of stock items, sales by division, monthly visitors, etc. If you are looking for a format to display your unique thoughts, then the professionally designed Dashboard Depicting Sales And Customer Analytics Infographics PDF is the one for you. You can use it as a Google Slides template or a PowerPoint template. Incorporate impressive visuals, symbols, images, and other charts. Modify or reorganize the text boxes as you desire. Experiment with shade schemes and font pairings. Alter, share or cooperate with other people on your work. Download Dashboard Depicting Sales And Customer Analytics Infographics PDF and find out how to give a successful presentation. Present a perfect display to your team and make your presentation unforgettable.

IT System Risk Management Guide IT Risk Management Dashboard Highlighting Network Devices Server Status Elements PDF
The following slide highlights the information technology dashboard for risk management which includes devices, workstations status, unmonitored devices, last reboot time and problem servers. If you are looking for a format to display your unique thoughts, then the professionally designed IT System Risk Management Guide IT Risk Management Dashboard Highlighting Network Devices Server Status Elements PDF is the one for you. You can use it as a Google Slides template or a PowerPoint template. Incorporate impressive visuals, symbols, images, and other charts. Modify or reorganize the text boxes as you desire. Experiment with shade schemes and font pairings. Alter, share or cooperate with other people on your work. Download IT System Risk Management Guide IT Risk Management Dashboard Highlighting Network Devices Server Status Elements PDF and find out how to give a successful presentation. Present a perfect display to your team and make your presentation unforgettable.
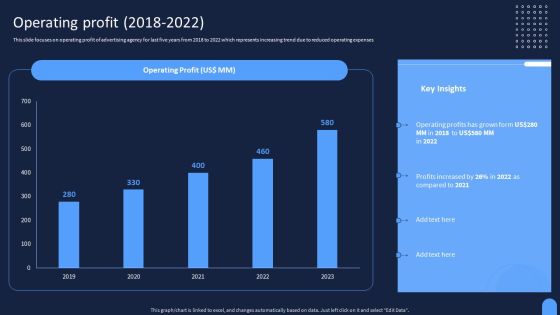
Ad And Media Agency Company Profile Operating Profit 2018 To 2022 Information PDF
This slide focuses on operating profit of advertising agency for last five years from 2018 to 2022 which represents increasing trend due to reduced operating expenses. If you are looking for a format to display your unique thoughts, then the professionally designed Ad And Media Agency Company Profile Operating Profit 2018 To 2022 Information PDF is the one for you. You can use it as a Google Slides template or a PowerPoint template. Incorporate impressive visuals, symbols, images, and other charts. Modify or reorganize the text boxes as you desire. Experiment with shade schemes and font pairings. Alter, share or cooperate with other people on your work. Download Ad And Media Agency Company Profile Operating Profit 2018 To 2022 Information PDF and find out how to give a successful presentation. Present a perfect display to your team and make your presentation unforgettable.

Analyze Customer Behavior To Reach Maximum People Topics PDF
Also go deeper into customer research to know the channels used most by them, channels used to find your brand and their general online behavior. If you are looking for a format to display your unique thoughts, then the professionally designed Analyze Customer Behavior To Reach Maximum People Topics PDF is the one for you. You can use it as a Google Slides template or a PowerPoint template. Incorporate impressive visuals, symbols, images, and other charts. Modify or reorganize the text boxes as you desire. Experiment with shade schemes and font pairings. Alter, share or cooperate with other people on your work. Download Analyze Customer Behavior To Reach Maximum People Topics PDF and find out how to give a successful presentation. Present a perfect display to your team and make your presentation unforgettable.
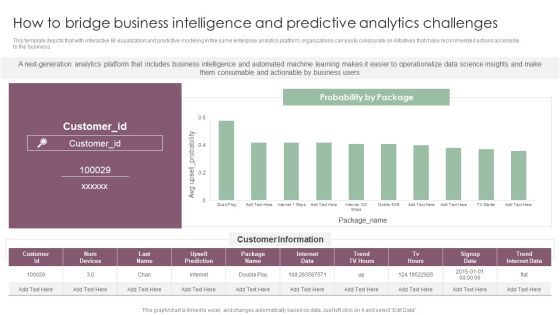
How To Bridge Business Intelligence And Predictive Analytics Challenges Mockup PDF
This template depicts that with interactive BI visualization and predictive modeling in the same enterprise analytics platform, organizations can easily collaborate on initiatives that make recommended actions accessible to the business. If you are looking for a format to display your unique thoughts, then the professionally designed How To Bridge Business Intelligence And Predictive Analytics Challenges Mockup PDF is the one for you. You can use it as a Google Slides template or a PowerPoint template. Incorporate impressive visuals, symbols, images, and other charts. Modify or reorganize the text boxes as you desire. Experiment with shade schemes and font pairings. Alter, share or cooperate with other people on your work. Download How To Bridge Business Intelligence And Predictive Analytics Challenges Mockup PDF and find out how to give a successful presentation. Present a perfect display to your team and make your presentation unforgettable.
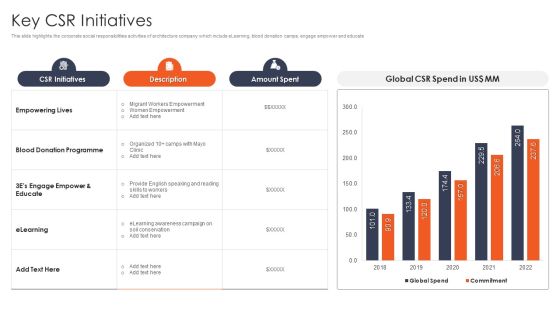
International Design And Architecture Firm Key CSR Initiatives Ppt Background Images PDF
This slide highlights the corporate social responsibilities activities of architecture company which include eLearning, blood donation camps, engage empower and educate If you are looking for a format to display your unique thoughts, then the professionally designed International Design And Architecture Firm Key CSR Initiatives Ppt Background Images PDF is the one for you. You can use it as a Google Slides template or a PowerPoint template. Incorporate impressive visuals, symbols, images, and other charts. Modify or reorganize the text boxes as you desire. Experiment with shade schemes and font pairings. Alter, share or cooperate with other people on your work. Download International Design And Architecture Firm Key CSR Initiatives Ppt Background Images PDF and find out how to give a successful presentation. Present a perfect display to your team and make your presentation unforgettable.
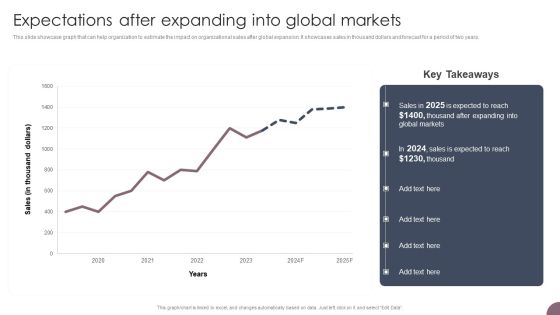
International Business Extension Expectations After Expanding Into Global Markets Diagrams PDF
This slide showcase graph that can help organization to estimate the impact on organizational sales after global expansion. It showcases sales in thousand dollars and forecast for a period of two years. If you are looking for a format to display your unique thoughts, then the professionally designed International Business Extension Expectations After Expanding Into Global Markets Diagrams PDF is the one for you. You can use it as a Google Slides template or a PowerPoint template. Incorporate impressive visuals, symbols, images, and other charts. Modify or reorganize the text boxes as you desire. Experiment with shade schemes and font pairings. Alter, share or cooperate with other people on your work. Download International Business Extension Expectations After Expanding Into Global Markets Diagrams PDF and find out how to give a successful presentation. Present a perfect display to your team and make your presentation unforgettable.

CRM Pipeline Administration Tracking Customer Sales Funnel Dashboard Brochure PDF
This slide covers information regarding the customer sales funnel tracking with sales volume and total market. If you are looking for a format to display your unique thoughts, then the professionally designed CRM Pipeline Administration Tracking Customer Sales Funnel Dashboard Brochure PDF is the one for you. You can use it as a Google Slides template or a PowerPoint template. Incorporate impressive visuals, symbols, images, and other charts. Modify or reorganize the text boxes as you desire. Experiment with shade schemes and font pairings. Alter, share or cooperate with other people on your work. Download CRM Pipeline Administration Tracking Customer Sales Funnel Dashboard Brochure PDF and find out how to give a successful presentation. Present a perfect display to your team and make your presentation unforgettable.

Business To Business Digital Implement Tracking And Reporting To Measure Summary PDF
This template covers dashboard to measure and analyze campaign performance. It also helps in tracking and reporting account based marketing channel and tactics. If you are looking for a format to display your unique thoughts, then the professionally designed Business To Business Digital Implement Tracking And Reporting To Measure Summary PDF is the one for you. You can use it as a Google Slides template or a PowerPoint template. Incorporate impressive visuals, symbols, images, and other charts. Modify or reorganize the text boxes as you desire. Experiment with shade schemes and font pairings. Alter, share or cooperate with other people on your work. Download Business To Business Digital Implement Tracking And Reporting To Measure Summary PDF and find out how to give a successful presentation. Present a perfect display to your team and make your presentation unforgettable.
Efficient Administration Of Product Business And Umbrella Branding Activity Tracking Dashboard For Umbrella Brand Icons PDF
This slide provides information regarding activities tracking dashboard for umbrella brand in terms of customer retention, market share, etc. If you are looking for a format to display your unique thoughts, then the professionally designed Efficient Administration Of Product Business And Umbrella Branding Activity Tracking Dashboard For Umbrella Brand Icons PDF is the one for you. You can use it as a Google Slides template or a PowerPoint template. Incorporate impressive visuals, symbols, images, and other charts. Modify or reorganize the text boxes as you desire. Experiment with shade schemes and font pairings. Alter, share or cooperate with other people on your work. Download Efficient Administration Of Product Business And Umbrella Branding Activity Tracking Dashboard For Umbrella Brand Icons PDF and find out how to give a successful presentation. Present a perfect display to your team and make your presentation unforgettable.
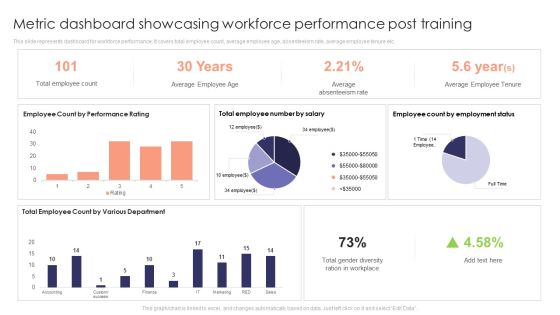
Metric Dashboard Showcasing Workforce Performance Post Training Ideas PDF
This slide represents dashboard for workforce performance. It covers total employee count, average employee age, absenteeism rate, average employee tenure etc. If you are looking for a format to display your unique thoughts, then the professionally designed Metric Dashboard Showcasing Workforce Performance Post Training Ideas PDF is the one for you. You can use it as a Google Slides template or a PowerPoint template. Incorporate impressive visuals, symbols, images, and other charts. Modify or reorganize the text boxes as you desire. Experiment with shade schemes and font pairings. Alter, share or cooperate with other people on your work. Download Metric Dashboard Showcasing Workforce Performance Post Training Ideas PDF and find out how to give a successful presentation. Present a perfect display to your team and make your presentation unforgettable.

Effective BPM Tool For Business Process Management Determining Total Number Of Risks Encountered And Resolved Inspiration PDF
This slide portrays status of risk encountered and resolved by the organization till date. It includes information about the issues by status, by priority and their resolved status. If you are looking for a format to display your unique thoughts, then the professionally designed Effective BPM Tool For Business Process Management Determining Total Number Of Risks Encountered And Resolved Inspiration PDF is the one for you. You can use it as a Google Slides template or a PowerPoint template. Incorporate impressive visuals, symbols, images, and other charts. Modify or reorganize the text boxes as you desire. Experiment with shade schemes and font pairings. Alter, share or cooperate with other people on your work. Download Effective BPM Tool For Business Process Management Determining Total Number Of Risks Encountered And Resolved Inspiration PDF and find out how to give a successful presentation. Present a perfect display to your team and make your presentation unforgettable.

Business Services Revenue Generated By Categories Engineering Company Financial Analysis Report Graphics PDF
The following slide highlights the business revenue generated by the engineering company in a given year. It shows revenue share from cities, players and geography, Cities include Tier I, Tier II, and Tier III, Players include government and private builders, geography includes north America, Europe and Asia pacific.If you are looking for a format to display your unique thoughts, then the professionally designed Business Services Revenue Generated By Categories Engineering Company Financial Analysis Report Graphics PDF is the one for you. You can use it as a Google Slides template or a PowerPoint template. Incorporate impressive visuals, symbols, images, and other charts. Modify or reorganize the text boxes as you desire. Experiment with shade schemes and font pairings. Alter, share or cooperate with other people on your work. Download Business Services Revenue Generated By Categories Engineering Company Financial Analysis Report Graphics PDF and find out how to give a successful presentation. Present a perfect display to your team and make your presentation unforgettable.
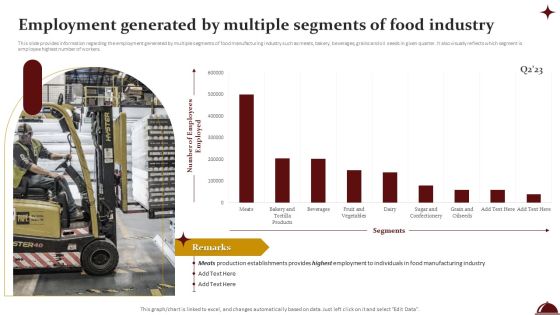
Employment Generated By Multiple Segments Of Food Industry Download PDF
This slide provides information regarding the employment generated by multiple segments of food manufacturing industry such as meats, bakery, beverages, grains and oil seeds in given quarter. It also visually reflects which segment is employee highest number of workers. If you are looking for a format to display your unique thoughts, then the professionally designed Employment Generated By Multiple Segments Of Food Industry Download PDF is the one for you. You can use it as a Google Slides template or a PowerPoint template. Incorporate impressive visuals, symbols, images, and other charts. Modify or reorganize the text boxes as you desire. Experiment with shade schemes and font pairings. Alter, share or cooperate with other people on your work. Download Employment Generated By Multiple Segments Of Food Industry Download PDF and find out how to give a successful presentation. Present a perfect display to your team and make your presentation unforgettable.

Collaborative Robots IT Dashboard To Track Cobot Performance Ppt Slides Guidelines PDF
This slide represents the cobots performance dashboard by covering details of battery level, performance, total hours, average time, time to return, energy consumption, and so on. If you are looking for a format to display your unique thoughts, then the professionally designed Collaborative Robots IT Dashboard To Track Cobot Performance Ppt Slides Guidelines PDF is the one for you. You can use it as a Google Slides template or a PowerPoint template. Incorporate impressive visuals, symbols, images, and other charts. Modify or reorganize the text boxes as you desire. Experiment with shade schemes and font pairings. Alter, share or cooperate with other people on your work. Download Collaborative Robots IT Dashboard To Track Cobot Performance Ppt Slides Guidelines PDF and find out how to give a successful presentation. Present a perfect display to your team and make your presentation unforgettable.
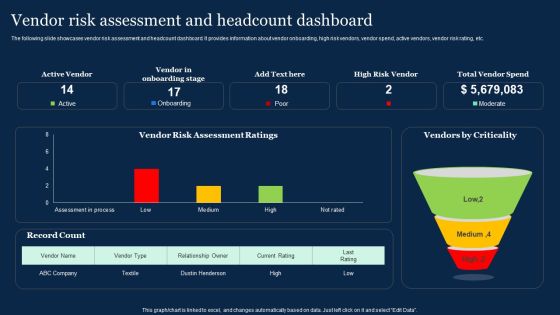
Vendor Risk Assessment And Headcount Dashboard Effective Vendor Management For Enhancing Elements PDF
The following slide showcases vendor risk assessment and headcount dashboard. It provides information about vendor onboarding, high risk vendors, vendor spend, active vendors, vendor risk rating, etc. If you are looking for a format to display your unique thoughts, then the professionally designed Vendor Risk Assessment And Headcount Dashboard Effective Vendor Management For Enhancing Elements PDF is the one for you. You can use it as a Google Slides template or a PowerPoint template. Incorporate impressive visuals, symbols, images, and other charts. Modify or reorganize the text boxes as you desire. Experiment with shade schemes and font pairings. Alter, share or cooperate with other people on your work. Download Vendor Risk Assessment And Headcount Dashboard Effective Vendor Management For Enhancing Elements PDF and find out how to give a successful presentation. Present a perfect display to your team and make your presentation unforgettable.

Sell Side M And A Pitchbook With Deal Overview Business Overview Of The Target Company AMM Company Graphics PDF
The slide provides the business overview of the target company the purchasing company.Business overview includes business introduction, mission and vision statement, financials highlights and non performing assets for five years. If you are looking for a format to display your unique thoughts, then the professionally designed Sell Side M And A Pitchbook With Deal Overview Business Overview Of The Target Company AMM Company Graphics PDF is the one for you. You can use it as a Google Slides template or a PowerPoint template. Incorporate impressive visuals, symbols, images, and other charts. Modify or reorganize the text boxes as you desire. Experiment with shade schemes and font pairings. Alter, share or cooperate with other people on your work. Download Sell Side M And A Pitchbook With Deal Overview Business Overview Of The Target Company AMM Company Graphics PDF and find out how to give a successful presentation. Present a perfect display to your team and make your presentation unforgettable.
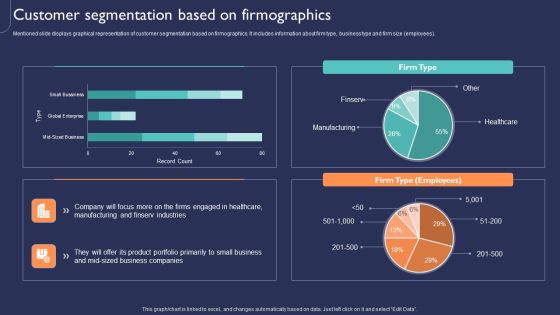
Introduction To New Product Portfolio Customer Segmentation Based On Firmographics Ppt Model Ideas PDF
Mentioned slide displays graphical representation of customer segmentation based on firmographics. It includes information about firm type, business type and firm size employees. If you are looking for a format to display your unique thoughts, then the professionally designed Introduction To New Product Portfolio Customer Segmentation Based On Firmographics Ppt Model Ideas PDF is the one for you. You can use it as a Google Slides template or a PowerPoint template. Incorporate impressive visuals, symbols, images, and other charts. Modify or reorganize the text boxes as you desire. Experiment with shade schemes and font pairings. Alter, share or cooperate with other people on your work. Download Introduction To New Product Portfolio Customer Segmentation Based On Firmographics Ppt Model Ideas PDF and find out how to give a successful presentation. Present a perfect display to your team and make your presentation unforgettable.

Auto Industry Trends Increasing Connected Cars Market Global Automotive Manufacturing Market Analysis Clipart PDF
This slide covers a graphical representation of the global connected car market size. It includes key insights about the growth of 5G and IOT, implementation of severe safety rules, high end and luxury vehicles, etc. If you are looking for a format to display your unique thoughts, then the professionally designed Auto Industry Trends Increasing Connected Cars Market Global Automotive Manufacturing Market Analysis Clipart PDF is the one for you. You can use it as a Google Slides template or a PowerPoint template. Incorporate impressive visuals, symbols, images, and other charts. Modify or reorganize the text boxes as you desire. Experiment with shade schemes and font pairings. Alter, share or cooperate with other people on your work. Download Auto Industry Trends Increasing Connected Cars Market Global Automotive Manufacturing Market Analysis Clipart PDF and find out how to give a successful presentation. Present a perfect display to your team and make your presentation unforgettable.
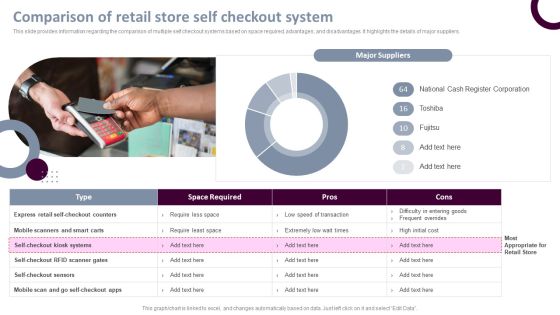
Retail Store Operations Comparison Of Retail Store Self Checkout System Template PDF
This slide provides information regarding the comparison of multiple self checkout systems based on space required, advantages, and disadvantages. It highlights the details of major suppliers. If you are looking for a format to display your unique thoughts, then the professionally designed Retail Store Operations Comparison Of Retail Store Self Checkout System Template PDF is the one for you. You can use it as a Google Slides template or a PowerPoint template. Incorporate impressive visuals, symbols, images, and other charts. Modify or reorganize the text boxes as you desire. Experiment with shade schemes and font pairings. Alter, share or cooperate with other people on your work. Download Retail Store Operations Comparison Of Retail Store Self Checkout System Template PDF and find out how to give a successful presentation. Present a perfect display to your team and make your presentation unforgettable.

Retail Store Operations Retail Store Inventory Safety Stock Assessment Background PDF
This slide shows the current performance of inventory operations providing information regarding customer and predicted demand, excess and deficit values, desired and actual safety stocks in days along with the forecast accuracy. If you are looking for a format to display your unique thoughts, then the professionally designed Retail Store Operations Retail Store Inventory Safety Stock Assessment Background PDF is the one for you. You can use it as a Google Slides template or a PowerPoint template. Incorporate impressive visuals, symbols, images, and other charts. Modify or reorganize the text boxes as you desire. Experiment with shade schemes and font pairings. Alter, share or cooperate with other people on your work. Download Retail Store Operations Retail Store Inventory Safety Stock Assessment Background PDF and find out how to give a successful presentation. Present a perfect display to your team and make your presentation unforgettable.
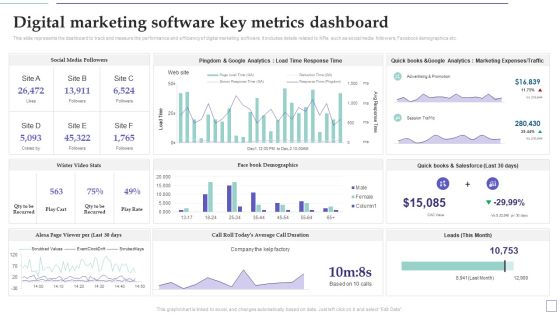
System Deployment Project Digital Marketing Software Key Metrics Dashboard Graphics PDF
This slide represents the dashboard to track and measure the performance and efficiency of digital marketing software. It includes details related to KPIs such as social media followers, Facebook demographics etc. If you are looking for a format to display your unique thoughts, then the professionally designed System Deployment Project Digital Marketing Software Key Metrics Dashboard Graphics PDF is the one for you. You can use it as a Google Slides template or a PowerPoint template. Incorporate impressive visuals, symbols, images, and other charts. Modify or reorganize the text boxes as you desire. Experiment with shade schemes and font pairings. Alter, share or cooperate with other people on your work. Download System Deployment Project Digital Marketing Software Key Metrics Dashboard Graphics PDF and find out how to give a successful presentation. Present a perfect display to your team and make your presentation unforgettable.
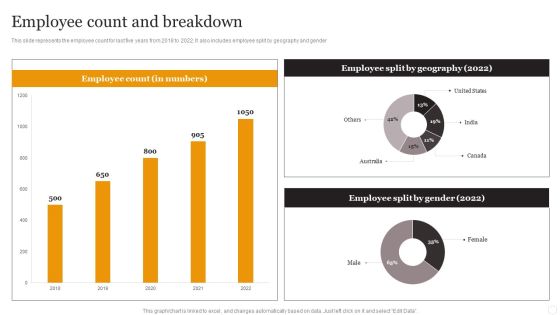
Website Designing Solutions Company Profile Employee Count And Breakdown Rules PDF
This slide represents the employee count for last five years from 2018 to 2022. It also includes employee split by geography and gender. If you are looking for a format to display your unique thoughts, then the professionally designed Website Designing Solutions Company Profile Employee Count And Breakdown Rules PDF is the one for you. You can use it as a Google Slides template or a PowerPoint template. Incorporate impressive visuals, symbols, images, and other charts. Modify or reorganize the text boxes as you desire. Experiment with shade schemes and font pairings. Alter, share or cooperate with other people on your work. Download Website Designing Solutions Company Profile Employee Count And Breakdown Rules PDF and find out how to give a successful presentation. Present a perfect display to your team and make your presentation unforgettable.

Using Social Media Platforms To Enhance Dashboard For Monitoring Social Media Traffic Structure PDF
This slide shows dashboard for tracking social media traffic. It provides details about sessions, bounce rate, average time on platform, pages per visit, clicks, goals, goal conversion rate, Facebook, Instagram, YouTube, Snapchat, etc. If you are looking for a format to display your unique thoughts, then the professionally designed Using Social Media Platforms To Enhance Dashboard For Monitoring Social Media Traffic Structure PDF is the one for you. You can use it as a Google Slides template or a PowerPoint template. Incorporate impressive visuals, symbols, images, and other charts. Modify or reorganize the text boxes as you desire. Experiment with shade schemes and font pairings. Alter, share or cooperate with other people on your work. Download Using Social Media Platforms To Enhance Dashboard For Monitoring Social Media Traffic Structure PDF and find out how to give a successful presentation. Present a perfect display to your team and make your presentation unforgettable.

Determining The Ransom Payment Paid By Organizations Over Time Information PDF
Following graphical slide shows the amount of ransom paid by organizations over the last two years. Graph indicates that ransom payments appear to have stabilized as a result of effective incident response approaches.If you are looking for a format to display your unique thoughts, then the professionally designed Determining The Ransom Payment Paid By Organizations Over Time Information PDF is the one for you. You can use it as a Google Slides template or a PowerPoint template. Incorporate impressive visuals, symbols, images, and other charts. Modify or reorganize the text boxes as you desire. Experiment with shade schemes and font pairings. Alter, share or cooperate with other people on your work. Download Determining The Ransom Payment Paid By Organizations Over Time Information PDF and find out how to give a successful presentation. Present a perfect display to your team and make your presentation unforgettable.

Competitive Assessment Based On Market Share Residential And Commercial Building Slides PDF
This slide represents the company comparison with competitors based on market share which shows our leading company with greatest share in market due to rise in construction projects such as commercial offices, pipeline infrastructure, etc.If you are looking for a format to display your unique thoughts, then the professionally designed Competitive Assessment Based On Market Share Residential And Commercial Building Slides PDF is the one for you. You can use it as a Google Slides template or a PowerPoint template. Incorporate impressive visuals, symbols, images, and other charts. Modify or reorganize the text boxes as you desire. Experiment with shade schemes and font pairings. Alter, share or cooperate with other people on your work. Download Competitive Assessment Based On Market Share Residential And Commercial Building Slides PDF and find out how to give a successful presentation. Present a perfect display to your team and make your presentation unforgettable.

Deploying And Managing Recurring Our Financial Performance Over The Year Infographics PDF
The purpose of the following slide is to analyze the financial performance of the organization. The provided graph highlight the revenues, Gross profit and net profit margin of the organization for the year 2016,17,18 and 19. If you are looking for a format to display your unique thoughts, then the professionally designed Deploying And Managing Recurring Our Financial Performance Over The Year Infographics PDF is the one for you. You can use it as a Google Slides template or a PowerPoint template. Incorporate impressive visuals, symbols, images, and other charts. Modify or reorganize the text boxes as you desire. Experiment with shade schemes and font pairings. Alter, share or cooperate with other people on your work. Download Deploying And Managing Recurring Our Financial Performance Over The Year Infographics PDF and find out how to give a successful presentation. Present a perfect display to your team and make your presentation unforgettable.
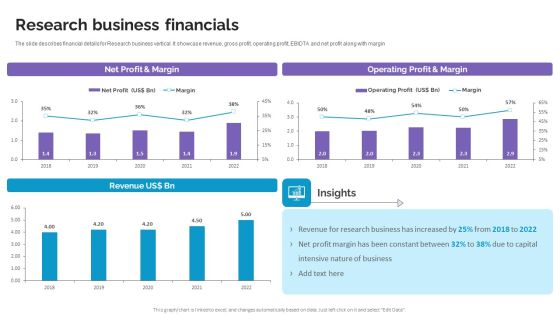
Research Business Financials Life Science And Healthcare Solutions Company Profile Information PDF
The slide describes financial details for Research business vertical. It showcase revenue, gross profit, operating profit, EBIDTA and net profit along with margin. If you are looking for a format to display your unique thoughts, then the professionally designed Research Business Financials Life Science And Healthcare Solutions Company Profile Information PDF is the one for you. You can use it as a Google Slides template or a PowerPoint template. Incorporate impressive visuals, symbols, images, and other charts. Modify or reorganize the text boxes as you desire. Experiment with shade schemes and font pairings. Alter, share or cooperate with other people on your work. Download Research Business Financials Life Science And Healthcare Solutions Company Profile Information PDF and find out how to give a successful presentation. Present a perfect display to your team and make your presentation unforgettable.

Dashboard For Cloud Storage Tracking Ppt PowerPoint Presentation File Layouts PDF
This slide represents the dashboard for cloud storage tracking by covering details of users, available workspaces, shared files, downloads, uploads, and moves. If you are looking for a format to display your unique thoughts, then the professionally designed Dashboard For Cloud Storage Tracking Ppt PowerPoint Presentation File Layouts PDF is the one for you. You can use it as a Google Slides template or a PowerPoint template. Incorporate impressive visuals, symbols, images, and other charts. Modify or reorganize the text boxes as you desire. Experiment with shade schemes and font pairings. Alter, share or cooperate with other people on your work. Download Dashboard For Cloud Storage Tracking Ppt PowerPoint Presentation File Layouts PDF and find out how to give a successful presentation. Present a perfect display to your team and make your presentation unforgettable.
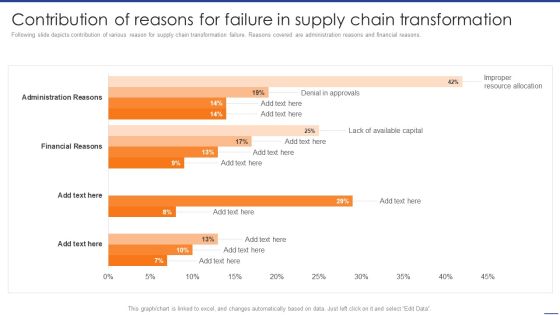
Digital Transformation Of Supply Contribution Of Reasons For Failure In Supply Chain Guidelines PDF
Following slide depicts contribution of various reason for supply chain transformation failure. Reasons covered are administration reasons and financial reasons. If you are looking for a format to display your unique thoughts, then the professionally designed Digital Transformation Of Supply Contribution Of Reasons For Failure In Supply Chain Guidelines PDF is the one for you. You can use it as a Google Slides template or a PowerPoint template. Incorporate impressive visuals, symbols, images, and other charts. Modify or reorganize the text boxes as you desire. Experiment with shade schemes and font pairings. Alter, share or cooperate with other people on your work. Download Digital Transformation Of Supply Contribution Of Reasons For Failure In Supply Chain Guidelines PDF and find out how to give a successful presentation. Present a perfect display to your team and make your presentation unforgettable.
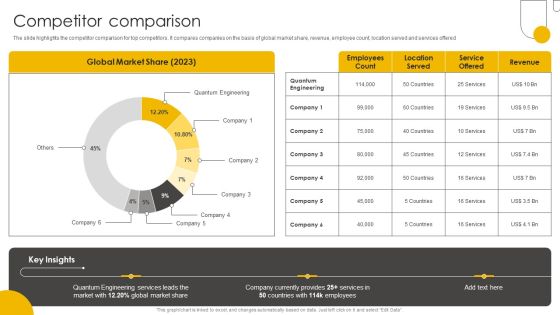
Engineering Enterprise Competitive Competitor Comparison Topics PDF
The slide highlights the competitor comparison for top competitors. It compares companies on the basis of global market share, revenue, employee count, location served and services offered. If you are looking for a format to display your unique thoughts, then the professionally designed Engineering Enterprise Competitive Competitor Comparison Topics PDF is the one for you. You can use it as a Google Slides template or a PowerPoint template. Incorporate impressive visuals, symbols, images, and other charts. Modify or reorganize the text boxes as you desire. Experiment with shade schemes and font pairings. Alter, share or cooperate with other people on your work. Download Engineering Enterprise Competitive Competitor Comparison Topics PDF and find out how to give a successful presentation. Present a perfect display to your team and make your presentation unforgettable.

Key CIO Initiatives CIO Dashboard To Track Essential Activities Associated With IT Portrait PDF
This slide provides information regarding dashboard to track various activities related to IT in terms of incident management, continuous improvement management, etc. If you are looking for a format to display your unique thoughts, then the professionally designed Key CIO Initiatives CIO Dashboard To Track Essential Activities Associated With IT Portrait PDF is the one for you. You can use it as a Google Slides template or a PowerPoint template. Incorporate impressive visuals, symbols, images, and other charts. Modify or reorganize the text boxes as you desire. Experiment with shade schemes and font pairings. Alter, share or cooperate with other people on your work. Download Key CIO Initiatives CIO Dashboard To Track Essential Activities Associated With IT Portrait PDF and find out how to give a successful presentation. Present a perfect display to your team and make your presentation unforgettable.

Insurance Business Financial Analysis Business Expense Ppt Show Rules PDF
The slide showcases the combined expense, claim expense and operational expense of insurance company for last five financial years along with the key insights. If you are looking for a format to display your unique thoughts, then the professionally designed Insurance Business Financial Analysis Business Expense Ppt Show Rules PDF is the one for you. You can use it as a Google Slides template or a PowerPoint template. Incorporate impressive visuals, symbols, images, and other charts. Modify or reorganize the text boxes as you desire. Experiment with shade schemes and font pairings. Alter, share or cooperate with other people on your work. Download Insurance Business Financial Analysis Business Expense Ppt Show Rules PDF and find out how to give a successful presentation. Present a perfect display to your team and make your presentation unforgettable.
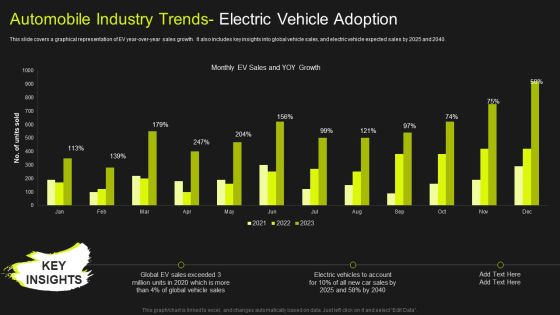
Global Automobile Market Analysis Automobile Industry Trends Electric Vehicle Adoption Mockup PDF
This slide covers a graphical representation of EV year-over-year sales growth. It also includes key insights into global vehicle sales, and electric vehicle expected sales by 2025 and 2040. If you are looking for a format to display your unique thoughts, then the professionally designed Global Automobile Market Analysis Automobile Industry Trends Electric Vehicle Adoption Mockup PDF is the one for you. You can use it as a Google Slides template or a PowerPoint template. Incorporate impressive visuals, symbols, images, and other charts. Modify or reorganize the text boxes as you desire. Experiment with shade schemes and font pairings. Alter, share or cooperate with other people on your work. Download Global Automobile Market Analysis Automobile Industry Trends Electric Vehicle Adoption Mockup PDF and find out how to give a successful presentation. Present a perfect display to your team and make your presentation unforgettable.
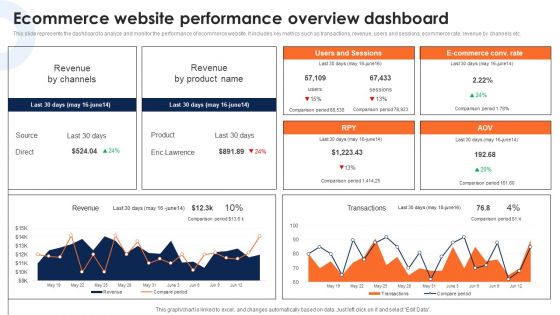
Ecommerce Website Performance Overview Dashboard Deploying Ecommerce Order Management Infographics PDF
This slide represents the dashboard to analyze and monitor the performance of ecommerce website. It includes key metrics such as transactions, revenue, users and sessions, ecommerce rate, revenue by channels etc.If you are looking for a format to display your unique thoughts, then the professionally designed Ecommerce Website Performance Overview Dashboard Deploying Ecommerce Order Management Infographics PDF is the one for you. You can use it as a Google Slides template or a PowerPoint template. Incorporate impressive visuals, symbols, images, and other charts. Modify or reorganize the text boxes as you desire. Experiment with shade schemes and font pairings. Alter, share or cooperate with other people on your work. Download Ecommerce Website Performance Overview Dashboard Deploying Ecommerce Order Management Infographics PDF and find out how to give a successful presentation. Present a perfect display to your team and make your presentation unforgettable.

Corporate Financial Performance Tracking Dashboard Diagrams PDF
This slide provides information regarding dashboard utilized by firm to monitor financial performance. The performance is tracked through revenues generated, vendors associated, profit generated, etc. If you are looking for a format to display your unique thoughts, then the professionally designed Corporate Financial Performance Tracking Dashboard Diagrams PDF is the one for you. You can use it as a Google Slides template or a PowerPoint template. Incorporate impressive visuals, symbols, images, and other charts. Modify or reorganize the text boxes as you desire. Experiment with shade schemes and font pairings. Alter, share or cooperate with other people on your work. Download Corporate Financial Performance Tracking Dashboard Diagrams PDF and find out how to give a successful presentation. Present a perfect display to your team and make your presentation unforgettable.
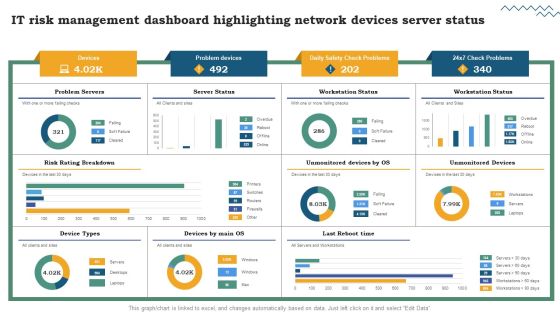
Risk Evaluation Of Information Technology Systems IT Risk Management Dashboard Highlighting Network Devices Server Status Professional PDF
If you are looking for a format to display your unique thoughts, then the professionally designed Risk Evaluation Of Information Technology Systems IT Risk Management Dashboard Highlighting Network Devices Server Status Professional PDF is the one for you. You can use it as a Google Slides template or a PowerPoint template. Incorporate impressive visuals, symbols, images, and other charts. Modify or reorganize the text boxes as you desire. Experiment with shade schemes and font pairings. Alter, share or cooperate with other people on your work. Download Risk Evaluation Of Information Technology Systems IT Risk Management Dashboard Highlighting Network Devices Server Status Professional PDF and find out how to give a successful presentation. Present a perfect display to your team and make your presentation unforgettable.

Cloud Dashboard For Tracking Project Sprints Ppt PowerPoint Presentation File Layouts PDF
The following slide depicts cloud dashboard for monitoring project sprints. It provides information about sprint blockers, resolved issues, under performers, sprint health, releases, sprint burndown, etc. If you are looking for a format to display your unique thoughts, then the professionally designed Cloud Dashboard For Tracking Project Sprints Ppt PowerPoint Presentation File Layouts PDF is the one for you. You can use it as a Google Slides template or a PowerPoint template. Incorporate impressive visuals, symbols, images, and other charts. Modify or reorganize the text boxes as you desire. Experiment with shade schemes and font pairings. Alter, share or cooperate with other people on your work. Download Cloud Dashboard For Tracking Project Sprints Ppt PowerPoint Presentation File Layouts PDF and find out how to give a successful presentation. Present a perfect display to your team and make your presentation unforgettable.
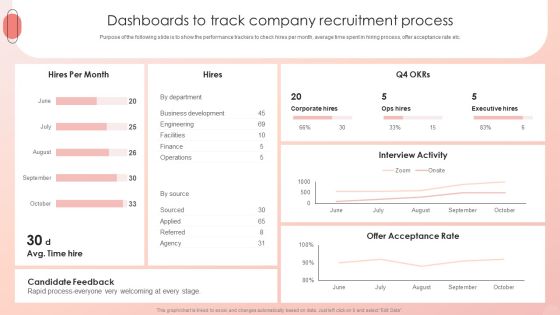
Improving HRM Process Dashboards To Track Company Recruitment Process Infographics PDF
Purpose of the following slide is to show the performance trackers to check hires per month, average time spent in hiring process, offer acceptance rate etc. If you are looking for a format to display your unique thoughts, then the professionally designed Improving HRM Process Dashboards To Track Company Recruitment Process Infographics PDF is the one for you. You can use it as a Google Slides template or a PowerPoint template. Incorporate impressive visuals, symbols, images, and other charts. Modify or reorganize the text boxes as you desire. Experiment with shade schemes and font pairings. Alter, share or cooperate with other people on your work. Download Improving HRM Process Dashboards To Track Company Recruitment Process Infographics PDF and find out how to give a successful presentation. Present a perfect display to your team and make your presentation unforgettable.
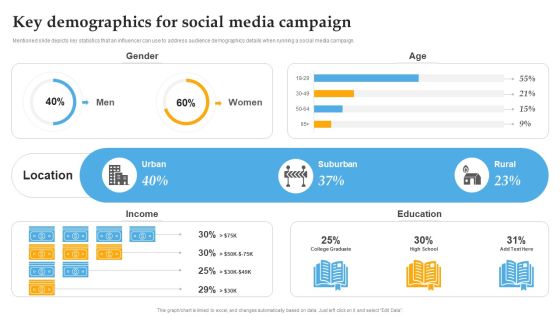
Key Demographics For Social Media Campaign Comprehensive Personal Brand Building Guide For Social Media Information PDF
Mentioned slide depicts key statistics that an influencer can use to address audience demographics details when running a social media campaign. If you are looking for a format to display your unique thoughts, then the professionally designed Key Demographics For Social Media Campaign Comprehensive Personal Brand Building Guide For Social Media Information PDF is the one for you. You can use it as a Google Slides template or a PowerPoint template. Incorporate impressive visuals, symbols, images, and other charts. Modify or reorganize the text boxes as you desire. Experiment with shade schemes and font pairings. Alter, share or cooperate with other people on your work. Download Key Demographics For Social Media Campaign Comprehensive Personal Brand Building Guide For Social Media Information PDF and find out how to give a successful presentation. Present a perfect display to your team and make your presentation unforgettable.

Customer Goods Production Company Revenue By Segment And Geographical Brochure PDF
This slide showcases the revenue of the company by geographical region and business segments which includes home care, grooming, home care and beauty products with different markets. If you are looking for a format to display your unique thoughts, then the professionally designed Customer Goods Production Company Revenue By Segment And Geographical Brochure PDF is the one for you. You can use it as a Google Slides template or a PowerPoint template. Incorporate impressive visuals, symbols, images, and other charts. Modify or reorganize the text boxes as you desire. Experiment with shade schemes and font pairings. Alter, share or cooperate with other people on your work. Download Customer Goods Production Company Revenue By Segment And Geographical Brochure PDF and find out how to give a successful presentation. Present a perfect display to your team and make your presentation unforgettable.
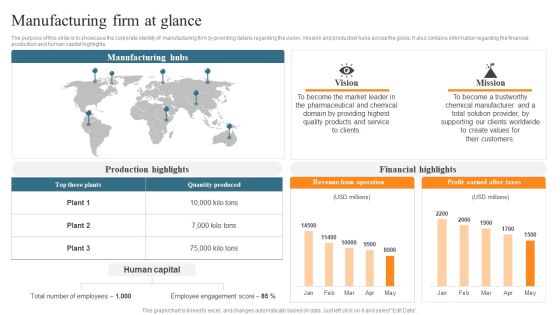
Leveraging Predictive Maintenance To Enhance Production Process Manufacturing Firm At Glance Elements PDF
The purpose of this slide is to showcase the corporate identity of manufacturing firm by providing details regarding the vision, mission and production hubs across the globe. It also contains information regarding the financial, production and human capital highlights. If you are looking for a format to display your unique thoughts, then the professionally designed Leveraging Predictive Maintenance To Enhance Production Process Manufacturing Firm At Glance Elements PDF is the one for you. You can use it as a Google Slides template or a PowerPoint template. Incorporate impressive visuals, symbols, images, and other charts. Modify or reorganize the text boxes as you desire. Experiment with shade schemes and font pairings. Alter, share or cooperate with other people on your work. Download Leveraging Predictive Maintenance To Enhance Production Process Manufacturing Firm At Glance Elements PDF and find out how to give a successful presentation. Present a perfect display to your team and make your presentation unforgettable.

Guide To Create Advertising Campaign For Client Engagement Step 2 Create Customer Persona Background PDF
This slide showcases the overview of customer persona created by marketers to understand and determine target audience. It includes customer details such as age, work, qualification, location, goals, interests, challenges, preferred channels and motivation. If you are looking for a format to display your unique thoughts, then the professionally designed Guide To Create Advertising Campaign For Client Engagement Step 2 Create Customer Persona Background PDF is the one for you. You can use it as a Google Slides template or a PowerPoint template. Incorporate impressive visuals, symbols, images, and other charts. Modify or reorganize the text boxes as you desire. Experiment with shade schemes and font pairings. Alter, share or cooperate with other people on your work. Download Guide To Create Advertising Campaign For Client Engagement Step 2 Create Customer Persona Background PDF and find out how to give a successful presentation. Present a perfect display to your team and make your presentation unforgettable.

Aiops Dashboard To Monitor IT Operations Aiops Integration Summary Report Clipart PDF
The following slide highlights the various key performance indicators of the AIOp, these can be problem quick review, cloud and infrastructure and applications health. If you are looking for a format to display your unique thoughts, then the professionally designed Aiops Dashboard To Monitor IT Operations Aiops Integration Summary Report Clipart PDF is the one for you. You can use it as a Google Slides template or a PowerPoint template. Incorporate impressive visuals, symbols, images, and other charts. Modify or reorganize the text boxes as you desire. Experiment with shade schemes and font pairings. Alter, share or cooperate with other people on your work. Download Aiops Dashboard To Monitor IT Operations Aiops Integration Summary Report Clipart PDF and find out how to give a successful presentation. Present a perfect display to your team and make your presentation unforgettable.
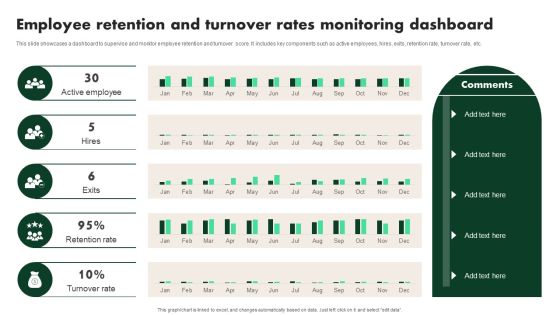
Creating Employee Value Proposition Employee Retention And Turnover Rates Monitoring Brochure PDF
This slide showcases a dashboard to supervise and monitor employee retention and turnover score. It includes key components such as active employees, hires, exits, retention rate, turnover rate, etc. If you are looking for a format to display your unique thoughts, then the professionally designed Creating Employee Value Proposition Employee Retention And Turnover Rates Monitoring Brochure PDF is the one for you. You can use it as a Google Slides template or a PowerPoint template. Incorporate impressive visuals, symbols, images, and other charts. Modify or reorganize the text boxes as you desire. Experiment with shade schemes and font pairings. Alter, share or cooperate with other people on your work. Download Creating Employee Value Proposition Employee Retention And Turnover Rates Monitoring Brochure PDF and find out how to give a successful presentation. Present a perfect display to your team and make your presentation unforgettable.

Branches For Visualization Research And Development Lack Of Data Understanding Faced Introduction PDF
This slide depicts the different issues faced by the company in a project, but the lack of data understanding is the primary concern among all. If you are looking for a format to display your unique thoughts, then the professionally designed Branches For Visualization Research And Development Lack Of Data Understanding Faced Introduction PDF is the one for you. You can use it as a Google Slides template or a PowerPoint template. Incorporate impressive visuals, symbols, images, and other charts. Modify or reorganize the text boxes as you desire. Experiment with shade schemes and font pairings. Alter, share or cooperate with other people on your work. Download Branches For Visualization Research And Development Lack Of Data Understanding Faced Introduction PDF and find out how to give a successful presentation. Present a perfect display to your team and make your presentation unforgettable.

Credibility Assessment Summary For Construction Project Real Estate Market Growth Projections Ideas PDF
Following slide displays the growth projections of global real estate market. It shows that real estate market is estimated to rise to 5 percent mark in 2023. If you are looking for a format to display your unique thoughts, then the professionally designed Credibility Assessment Summary For Construction Project Real Estate Market Growth Projections Ideas PDF is the one for you. You can use it as a Google Slides template or a PowerPoint template. Incorporate impressive visuals, symbols, images, and other charts. Modify or reorganize the text boxes as you desire. Experiment with shade schemes and font pairings. Alter, share or cooperate with other people on your work. Download Credibility Assessment Summary For Construction Project Real Estate Market Growth Projections Ideas PDF and find out how to give a successful presentation. Present a perfect display to your team and make your presentation unforgettable.

Optimizing Production Process Smart Manufacturing Dashboard To Track Production Diagrams PDF
This slide represents smart manufacturing dashboard. It covers production volume, downtime causes, top product sold item, sales revenue, active machinery etc. If you are looking for a format to display your unique thoughts, then the professionally designed Optimizing Production Process Smart Manufacturing Dashboard To Track Production Diagrams PDF is the one for you. You can use it as a Google Slides template or a PowerPoint template. Incorporate impressive visuals, symbols, images, and other charts. Modify or reorganize the text boxes as you desire. Experiment with shade schemes and font pairings. Alter, share or cooperate with other people on your work. Download Optimizing Production Process Smart Manufacturing Dashboard To Track Production Diagrams PDF and find out how to give a successful presentation. Present a perfect display to your team and make your presentation unforgettable.
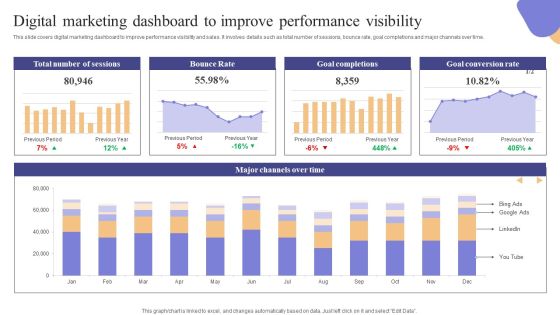
Digital Marketing Dashboard To Improve Performance Visibility Brochure PDF
This slide covers digital marketing dashboard to improve performance visibility and sales. It involves details such as total number of sessions, bounce rate, goal completions and major channels over time. If you are looking for a format to display your unique thoughts, then the professionally designed Digital Marketing Dashboard To Improve Performance Visibility Brochure PDF is the one for you. You can use it as a Google Slides template or a PowerPoint template. Incorporate impressive visuals, symbols, images, and other charts. Modify or reorganize the text boxes as you desire. Experiment with shade schemes and font pairings. Alter, share or cooperate with other people on your work. Download Digital Marketing Dashboard To Improve Performance Visibility Brochure PDF and find out how to give a successful presentation. Present a perfect display to your team and make your presentation unforgettable.
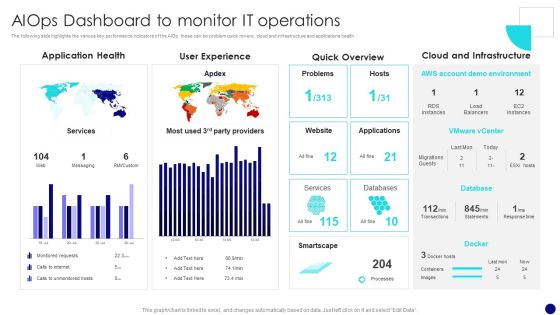
Information Technology Operations Administration With ML Aiops Dashboard To Monitor Diagrams PDF
The following slide highlights the various key performance indicators of the AIOp, these can be problem quick review, cloud and infrastructure and applications health. If you are looking for a format to display your unique thoughts, then the professionally designed Information Technology Operations Administration With ML Aiops Dashboard To Monitor Diagrams PDF is the one for you. You can use it as a Google Slides template or a PowerPoint template. Incorporate impressive visuals, symbols, images, and other charts. Modify or reorganize the text boxes as you desire. Experiment with shade schemes and font pairings. Alter, share or cooperate with other people on your work. Download Information Technology Operations Administration With ML Aiops Dashboard To Monitor Diagrams PDF and find out how to give a successful presentation. Present a perfect display to your team and make your presentation unforgettable.
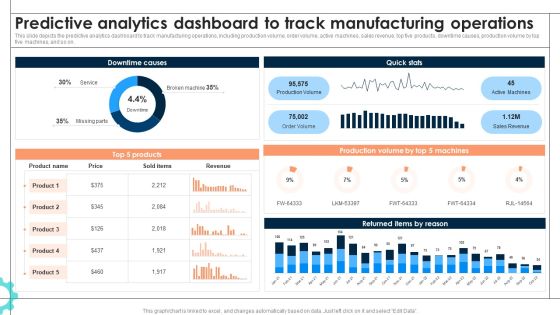
Intelligent Manufacturing Predictive Analytics Dashboard To Track Manufacturing Operations Information PDF
This slide depicts the predictive analytics dashboard to track manufacturing operations, including production volume, order volume, active machines, sales revenue, top five products, downtime causes, production volume by top five machines, and so on. If you are looking for a format to display your unique thoughts, then the professionally designed Intelligent Manufacturing Predictive Analytics Dashboard To Track Manufacturing Operations Information PDF is the one for you. You can use it as a Google Slides template or a PowerPoint template. Incorporate impressive visuals, symbols, images, and other charts. Modify or reorganize the text boxes as you desire. Experiment with shade schemes and font pairings. Alter, share or cooperate with other people on your work. Download Intelligent Manufacturing Predictive Analytics Dashboard To Track Manufacturing Operations Information PDF and find out how to give a successful presentation. Present a perfect display to your team and make your presentation unforgettable.
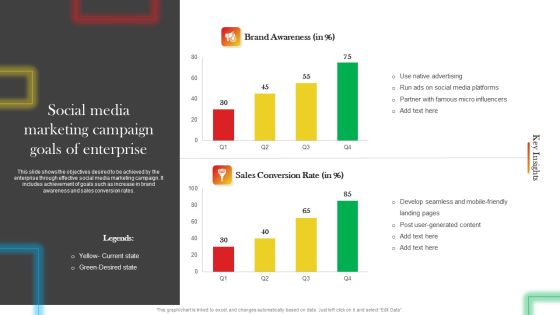
Social Media Marketing Campaign Goals Of Enterprise Mockup PDF
This slide shows the objectives desired to be achieved by the enterprise through effective social media marketing campaign. It includes achievement of goals such as increase in brand awareness and sales conversion rates. If you are looking for a format to display your unique thoughts, then the professionally designed Social Media Marketing Campaign Goals Of Enterprise Mockup PDF is the one for you. You can use it as a Google Slides template or a PowerPoint template. Incorporate impressive visuals, symbols, images, and other charts. Modify or reorganize the text boxes as you desire. Experiment with shade schemes and font pairings. Alter, share or cooperate with other people on your work. Download Social Media Marketing Campaign Goals Of Enterprise Mockup PDF and find out how to give a successful presentation. Present a perfect display to your team and make your presentation unforgettable.

Lead Generation By Source In Traditional Marketing Summary PDF
This slide showcases current and estimated lead generation from traditional marketing. Major sources covered are print, outdoor, broadcasting, one-on-one and referral marketing. If you are looking for a format to display your unique thoughts, then the professionally designed Lead Generation By Source In Traditional Marketing Summary PDF is the one for you. You can use it as a Google Slides template or a PowerPoint template. Incorporate impressive visuals, symbols, images, and other charts. Modify or reorganize the text boxes as you desire. Experiment with shade schemes and font pairings. Alter, share or cooperate with other people on your work. Download Lead Generation By Source In Traditional Marketing Summary PDF and find out how to give a successful presentation. Present a perfect display to your team and make your presentation unforgettable.
Product Branding To Enhance Product Branding Performance Tracking Dashboard Graphics PDF
This slide provides information regarding product branding performance tracking dashboard in terms of revenues, new customers, customer satisfaction rate. If you are looking for a format to display your unique thoughts, then the professionally designed Product Branding To Enhance Product Branding Performance Tracking Dashboard Graphics PDF is the one for you. You can use it as a Google Slides template or a PowerPoint template. Incorporate impressive visuals, symbols, images, and other charts. Modify or reorganize the text boxes as you desire. Experiment with shade schemes and font pairings. Alter, share or cooperate with other people on your work. Download Product Branding To Enhance Product Branding Performance Tracking Dashboard Graphics PDF and find out how to give a successful presentation. Present a perfect display to your team and make your presentation unforgettable.

Analyzing Competitive Financial Benefits For Employees Infographics PDF
The following slide identifies various monetary benefits offered by relative participants in industry to reduce employee turnover. It includes benefits such as pay and allowances, bonus, productivity linked wage incentives, profit sharing, retirement benefits, stock options or co-partnerships, commission and perquisites. If you are looking for a format to display your unique thoughts, then the professionally designed Analyzing Competitive Financial Benefits For Employees Infographics PDF is the one for you. You can use it as a Google Slides template or a PowerPoint template. Incorporate impressive visuals, symbols, images, and other charts. Modify or reorganize the text boxes as you desire. Experiment with shade schemes and font pairings. Alter, share or cooperate with other people on your work. Download Analyzing Competitive Financial Benefits For Employees Infographics PDF and find out how to give a successful presentation. Present a perfect display to your team and make your presentation unforgettable.

Retail Iot Service Regional Market Share Of Device Management Formats PDF
The following slide highlights the market share of device management on the basis of region. It shows regional market size, market distribution by industry, top countries and major uses of IoT service. If you are looking for a format to display your unique thoughts, then the professionally designed Retail Iot Service Regional Market Share Of Device Management Formats PDF is the one for you. You can use it as a Google Slides template or a PowerPoint template. Incorporate impressive visuals, symbols, images, and other charts. Modify or reorganize the text boxes as you desire. Experiment with shade schemes and font pairings. Alter, share or cooperate with other people on your work. Download Retail Iot Service Regional Market Share Of Device Management Formats PDF and find out how to give a successful presentation. Present a perfect display to your team and make your presentation unforgettable.

Retail Iot Service Managed Services Market Size And Growth Factors Introduction PDF
The following slide highlights the global market size and forecasted growth along with revenue CAGR for managed services as IoT service. It also shows key highlights and growth drivers in IoT retail. If you are looking for a format to display your unique thoughts, then the professionally designed Retail Iot Service Managed Services Market Size And Growth Factors Introduction PDF is the one for you. You can use it as a Google Slides template or a PowerPoint template. Incorporate impressive visuals, symbols, images, and other charts. Modify or reorganize the text boxes as you desire. Experiment with shade schemes and font pairings. Alter, share or cooperate with other people on your work. Download Retail Iot Service Managed Services Market Size And Growth Factors Introduction PDF and find out how to give a successful presentation. Present a perfect display to your team and make your presentation unforgettable.
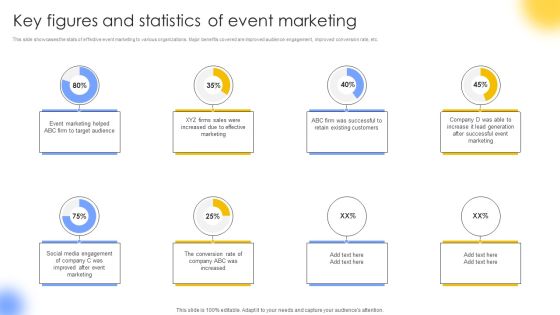
Key Figures And Statistics Of Event Marketing Portrait PDF
This slide showcases the stats of effective event marketing to various organizations. Major benefits covered are improved audience engagement, improved conversion rate, etc. If you are looking for a format to display your unique thoughts, then the professionally designed Key Figures And Statistics Of Event Marketing Portrait PDF is the one for you. You can use it as a Google Slides template or a PowerPoint template. Incorporate impressive visuals, symbols, images, and other charts. Modify or reorganize the text boxes as you desire. Experiment with shade schemes and font pairings. Alter, share or cooperate with other people on your work. Download Key Figures And Statistics Of Event Marketing Portrait PDF and find out how to give a successful presentation. Present a perfect display to your team and make your presentation unforgettable.
Determining Customer Lifetime Value And Churn Rate Ppt Icon Guidelines PDF
This slide shows informational statistics about customer lifetime value and churn rate in FY23. It also shows that average customer lifetime for 2023 was 21 months. If you are looking for a format to display your unique thoughts, then the professionally designed Determining Customer Lifetime Value And Churn Rate Ppt Icon Guidelines PDF is the one for you. You can use it as a Google Slides template or a PowerPoint template. Incorporate impressive visuals, symbols, images, and other charts. Modify or reorganize the text boxes as you desire. Experiment with shade schemes and font pairings. Alter, share or cooperate with other people on your work. Download Determining Customer Lifetime Value And Churn Rate Ppt Icon Guidelines PDF and find out how to give a successful presentation. Present a perfect display to your team and make your presentation unforgettable.

Performance Summary Market Share And Brand Status Diagrams PDF
Purpose of this slide is to address information about business performance. Information covered in the slide are of competitors, product market share and brand status. If you are looking for a format to display your unique thoughts, then the professionally designed Performance Summary Market Share And Brand Status Diagrams PDF is the one for you. You can use it as a Google Slides template or a PowerPoint template. Incorporate impressive visuals, symbols, images, and other charts. Modify or reorganize the text boxes as you desire. Experiment with shade schemes and font pairings. Alter, share or cooperate with other people on your work. Download Performance Summary Market Share And Brand Status Diagrams PDF and find out how to give a successful presentation. Present a perfect display to your team and make your presentation unforgettable.

AI Deployment In IT Process Aiops Dashboard To Monitor IT Operations Infographics PDF
The following slide highlights the various key performance indicators of the AIOp, these can be problem quick review, cloud and infrastructure and applications health. If you are looking for a format to display your unique thoughts, then the professionally designed AI Deployment In IT Process Aiops Dashboard To Monitor IT Operations Infographics PDF is the one for you. You can use it as a Google Slides template or a PowerPoint template. Incorporate impressive visuals, symbols, images, and other charts. Modify or reorganize the text boxes as you desire. Experiment with shade schemes and font pairings. Alter, share or cooperate with other people on your work. Download AI Deployment In IT Process Aiops Dashboard To Monitor IT Operations Infographics PDF and find out how to give a successful presentation. Present a perfect display to your team and make your presentation unforgettable.

Digital Marketing Toolkit Business To Business Marketing Transformation Success Metrics Sample PDF
This slide covers the B2B marketing transformation success metrics such as influenced pipelines, overall numbers of engaged accounts, marketing qualified accounts, individual campaign and channel metrics etc. If you are looking for a format to display your unique thoughts, then the professionally designed Digital Marketing Toolkit Business To Business Marketing Transformation Success Metrics Sample PDF is the one for you. You can use it as a Google Slides template or a PowerPoint template. Incorporate impressive visuals, symbols, images, and other charts. Modify or reorganize the text boxes as you desire. Experiment with shade schemes and font pairings. Alter, share or cooperate with other people on your work. Download Digital Marketing Toolkit Business To Business Marketing Transformation Success Metrics Sample PDF and find out how to give a successful presentation. Present a perfect display to your team and make your presentation unforgettable.

Global Market Insights By Component Ppt Infographic Template Background Designs PDF
This slide showcases the global precision farming market insights by component which represents hardware, software and services segment. If you are looking for a format to display your unique thoughts, then the professionally designed Global Market Insights By Component Ppt Infographic Template Background Designs PDF is the one for you. You can use it as a Google Slides template or a PowerPoint template. Incorporate impressive visuals, symbols, images, and other charts. Modify or reorganize the text boxes as you desire. Experiment with shade schemes and font pairings. Alter, share or cooperate with other people on your work. Download Global Market Insights By Component Ppt Infographic Template Background Designs PDF and find out how to give a successful presentation. Present a perfect display to your team and make your presentation unforgettable.

Addressing Market Assessment For Insurance Business Mockup PDF
This slide covers information regarding market assessment of insurance business with high competition existing. It covers details about key players and market share associated to top players. If you are looking for a format to display your unique thoughts, then the professionally designed Addressing Market Assessment For Insurance Business Mockup PDF is the one for you. You can use it as a Google Slides template or a PowerPoint template. Incorporate impressive visuals, symbols, images, and other charts. Modify or reorganize the text boxes as you desire. Experiment with shade schemes and font pairings. Alter, share or cooperate with other people on your work. Download Addressing Market Assessment For Insurance Business Mockup PDF and find out how to give a successful presentation. Present a perfect display to your team and make your presentation unforgettable.

Website Analytics Dashboard For Consumer Data Insights Ppt PowerPoint Presentation File Slides PDF
This slide showcases dashboard for website analytics that can help organization to gather data about visitors and formulate targeted marketing campaigns. It can also help to make individual and group buyer personas. If you are looking for a format to display your unique thoughts, then the professionally designed Website Analytics Dashboard For Consumer Data Insights Ppt PowerPoint Presentation File Slides PDF is the one for you. You can use it as a Google Slides template or a PowerPoint template. Incorporate impressive visuals, symbols, images, and other charts. Modify or reorganize the text boxes as you desire. Experiment with shade schemes and font pairings. Alter, share or cooperate with other people on your work. Download Website Analytics Dashboard For Consumer Data Insights Ppt PowerPoint Presentation File Slides PDF and find out how to give a successful presentation. Present a perfect display to your team and make your presentation unforgettable.

Claims Tracking Dashboard Utilized By Insurance Agency Diagrams PDF
This slide provides glimpse about claim activities tracking by insurance agency in terms of claim amount collected, number of claims, claims by product line, claim status assessment, claim expense by product line, etc. If you are looking for a format to display your unique thoughts, then the professionally designed Claims Tracking Dashboard Utilized By Insurance Agency Diagrams PDF is the one for you. You can use it as a Google Slides template or a PowerPoint template. Incorporate impressive visuals, symbols, images, and other charts. Modify or reorganize the text boxes as you desire. Experiment with shade schemes and font pairings. Alter, share or cooperate with other people on your work. Download Claims Tracking Dashboard Utilized By Insurance Agency Diagrams PDF and find out how to give a successful presentation. Present a perfect display to your team and make your presentation unforgettable.

Addressing B2B Account Based Marketing Management Dashboard Elements PDF
This slide provides information regarding B2B account-based marketing management dashboard catering KPIs related to opportunities, sales activities, average engagement score. If you are looking for a format to display your unique thoughts, then the professionally designed Addressing B2B Account Based Marketing Management Dashboard Elements PDF is the one for you. You can use it as a Google Slides template or a PowerPoint template. Incorporate impressive visuals, symbols, images, and other charts. Modify or reorganize the text boxes as you desire. Experiment with shade schemes and font pairings. Alter, share or cooperate with other people on your work. Download Addressing B2B Account Based Marketing Management Dashboard Elements PDF and find out how to give a successful presentation. Present a perfect display to your team and make your presentation unforgettable.

Instagram Advertising Users And Growth Rate Inspiration PDF
This slide represents the total advertising active users and growth rate from last two years which showcases increasing trend from 2022 to 2023. If you are looking for a format to display your unique thoughts, then the professionally designed Instagram Advertising Users And Growth Rate Inspiration PDF is the one for you. You can use it as a Google Slides template or a PowerPoint template. Incorporate impressive visuals, symbols, images, and other charts. Modify or reorganize the text boxes as you desire. Experiment with shade schemes and font pairings. Alter, share or cooperate with other people on your work. Download Instagram Advertising Users And Growth Rate Inspiration PDF and find out how to give a successful presentation. Present a perfect display to your team and make your presentation unforgettable.

Consumption Based Pricing Model Account Expansion And Contraction Prediction Inspiration PDF
The purpose of the following slide is to show the account expansion and contraction forecast for the financial year of 2023. If you are looking for a format to display your unique thoughts, then the professionally designed Consumption Based Pricing Model Account Expansion And Contraction Prediction Inspiration PDF is the one for you. You can use it as a Google Slides template or a PowerPoint template. Incorporate impressive visuals, symbols, images, and other charts. Modify or reorganize the text boxes as you desire. Experiment with shade schemes and font pairings. Alter, share or cooperate with other people on your work. Download Consumption Based Pricing Model Account Expansion And Contraction Prediction Inspiration PDF and find out how to give a successful presentation. Present a perfect display to your team and make your presentation unforgettable.

Recurring Income Generation Model Account Expansion And Contraction Prediction Demonstration PDF
The purpose of the following slide is to show the account expansion and contraction forecast for the financial year of 2023. If you are looking for a format to display your unique thoughts, then the professionally designed Recurring Income Generation Model Account Expansion And Contraction Prediction Demonstration PDF is the one for you. You can use it as a Google Slides template or a PowerPoint template. Incorporate impressive visuals, symbols, images, and other charts. Modify or reorganize the text boxes as you desire. Experiment with shade schemes and font pairings. Alter, share or cooperate with other people on your work. Download Recurring Income Generation Model Account Expansion And Contraction Prediction Demonstration PDF and find out how to give a successful presentation. Present a perfect display to your team and make your presentation unforgettable.
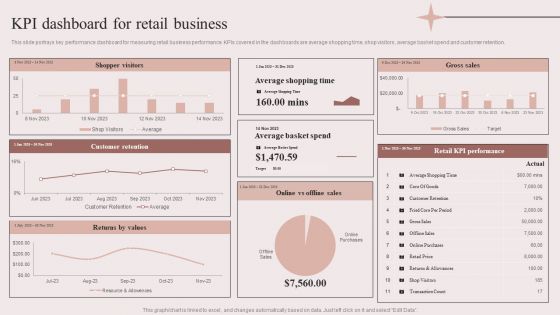
Enhancing Retail Process By Effective Inventory Management KPI Dashboard For Retail Business Inspiration PDF
This slide portrays key performance dashboard for measuring retail business performance. KPIs covered in the dashboards are average shopping time, shop visitors, average basket spend and customer retention. If you are looking for a format to display your unique thoughts, then the professionally designed Enhancing Retail Process By Effective Inventory Management KPI Dashboard For Retail Business Inspiration PDF is the one for you. You can use it as a Google Slides template or a PowerPoint template. Incorporate impressive visuals, symbols, images, and other charts. Modify or reorganize the text boxes as you desire. Experiment with shade schemes and font pairings. Alter, share or cooperate with other people on your work. Download Enhancing Retail Process By Effective Inventory Management KPI Dashboard For Retail Business Inspiration PDF and find out how to give a successful presentation. Present a perfect display to your team and make your presentation unforgettable.

Marketing Initiatives To Promote Fast Food Cafe Dashboard To Track Sales And Expenses Of Restaurant Portrait PDF
This slide showcases dashboard that can help restaurant to keep track of sales and expenses. Its key elements are total sales, average transactions, non labor margin, expenses by category etc If you are looking for a format to display your unique thoughts, then the professionally designed Marketing Initiatives To Promote Fast Food Cafe Dashboard To Track Sales And Expenses Of Restaurant Portrait PDF is the one for you. You can use it as a Google Slides template or a PowerPoint template. Incorporate impressive visuals, symbols, images, and other charts. Modify or reorganize the text boxes as you desire. Experiment with shade schemes and font pairings. Alter, share or cooperate with other people on your work. Download Marketing Initiatives To Promote Fast Food Cafe Dashboard To Track Sales And Expenses Of Restaurant Portrait PDF and find out how to give a successful presentation. Present a perfect display to your team and make your presentation unforgettable.
Maximizing Brand Growth With Umbrella Branding Activities Corporate Branding Performance Tracking Dashboard Summary PDF
This slide provides information regarding corporate branding performance tracking dashboard in terms of leads, conversion metrics, web traffic, etc. If you are looking for a format to display your unique thoughts, then the professionally designed Maximizing Brand Growth With Umbrella Branding Activities Corporate Branding Performance Tracking Dashboard Summary PDF is the one for you. You can use it as a Google Slides template or a PowerPoint template. Incorporate impressive visuals, symbols, images, and other charts. Modify or reorganize the text boxes as you desire. Experiment with shade schemes and font pairings. Alter, share or cooperate with other people on your work. Download Maximizing Brand Growth With Umbrella Branding Activities Corporate Branding Performance Tracking Dashboard Summary PDF and find out how to give a successful presentation. Present a perfect display to your team and make your presentation unforgettable.

Coffee Cafe Company Profile Comparative Assessment Of Coffee Business Market Share Mockup PDF
Following slide demonstrates comparative analysis of global coffee shops market share to determine highest revenue-earning business. It includes market share if Starbucks, Dunkin Donuts, Costa coffee, McCafe, Tim Horton, etc. If you are looking for a format to display your unique thoughts, then the professionally designed Coffee Cafe Company Profile Comparative Assessment Of Coffee Business Market Share Mockup PDF is the one for you. You can use it as a Google Slides template or a PowerPoint template. Incorporate impressive visuals, symbols, images, and other charts. Modify or reorganize the text boxes as you desire. Experiment with shade schemes and font pairings. Alter, share or cooperate with other people on your work. Download Coffee Cafe Company Profile Comparative Assessment Of Coffee Business Market Share Mockup PDF and find out how to give a successful presentation. Present a perfect display to your team and make your presentation unforgettable.

Integrating CRM Solution To Acquire Potential Customers CRM Email Nurturing Campaign Dashboard Template PDF
This slide represents key metrics dashboard to analyze, manage and track the performance of email nurturing campaign organized by the enterprise. It incudes details related to KPIs such as conversion rate, average order value etc. If you are looking for a format to display your unique thoughts, then the professionally designed Integrating CRM Solution To Acquire Potential Customers CRM Email Nurturing Campaign Dashboard Template PDF is the one for you. You can use it as a Google Slides template or a PowerPoint template. Incorporate impressive visuals, symbols, images, and other charts. Modify or reorganize the text boxes as you desire. Experiment with shade schemes and font pairings. Alter, share or cooperate with other people on your work. Download Integrating CRM Solution To Acquire Potential Customers CRM Email Nurturing Campaign Dashboard Template PDF and find out how to give a successful presentation. Present a perfect display to your team and make your presentation unforgettable.

Global Tiktok Users Statistical Data Portrait PDF
This slide shows the statistical data representing the analysis of global TikTok users on TikTok to help marketers to analyze and identify target audience. It shows data related to users of TikTok are youths and millennials. If you are looking for a format to display your unique thoughts, then the professionally designed Global Tiktok Users Statistical Data Portrait PDF is the one for you. You can use it as a Google Slides template or a PowerPoint template. Incorporate impressive visuals, symbols, images, and other charts. Modify or reorganize the text boxes as you desire. Experiment with shade schemes and font pairings. Alter, share or cooperate with other people on your work. Download Global Tiktok Users Statistical Data Portrait PDF and find out how to give a successful presentation. Present a perfect display to your team and make your presentation unforgettable.
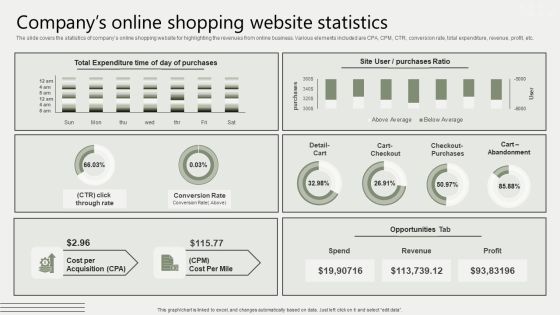
Global Business Market Development Guide Companys Online Shopping Website Statistics Background PDF
The slide covers the statistics of companys online shopping website for highlighting the revenues from online business. Various elements included are CPA, CPM, CTR, conversion rate, total expenditure, revenue, profit, etc. If you are looking for a format to display your unique thoughts, then the professionally designed Global Business Market Development Guide Companys Online Shopping Website Statistics Background PDF is the one for you. You can use it as a Google Slides template or a PowerPoint template. Incorporate impressive visuals, symbols, images, and other charts. Modify or reorganize the text boxes as you desire. Experiment with shade schemes and font pairings. Alter, share or cooperate with other people on your work. Download Global Business Market Development Guide Companys Online Shopping Website Statistics Background PDF and find out how to give a successful presentation. Present a perfect display to your team and make your presentation unforgettable.
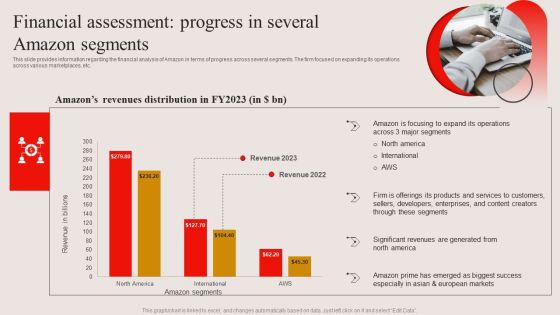
Financial Assessment Progress In Several Amazon Segments Ppt PowerPoint Presentation File Gallery PDF
This slide provides information regarding the financial analysis of Amazon in terms of progress across several segments. The firm focused on expanding its operations across various marketplaces, etc. If you are looking for a format to display your unique thoughts, then the professionally designed Financial Assessment Progress In Several Amazon Segments Ppt PowerPoint Presentation File Gallery PDF is the one for you. You can use it as a Google Slides template or a PowerPoint template. Incorporate impressive visuals, symbols, images, and other charts. Modify or reorganize the text boxes as you desire. Experiment with shade schemes and font pairings. Alter, share or cooperate with other people on your work. Download Financial Assessment Progress In Several Amazon Segments Ppt PowerPoint Presentation File Gallery PDF and find out how to give a successful presentation. Present a perfect display to your team and make your presentation unforgettable.

Categories Of Segmenting And Profiling Customers Customer Demographics Segmentation Dashboard Guidelines PDF
This slide showcases a dashboard for segmenting customers based on demographics factors. It includes key components such as make population by age, female population by age, number of male customers and number of female customers. If you are looking for a format to display your unique thoughts, then the professionally designed Categories Of Segmenting And Profiling Customers Customer Demographics Segmentation Dashboard Guidelines PDF is the one for you. You can use it as a Google Slides template or a PowerPoint template. Incorporate impressive visuals, symbols, images, and other charts. Modify or reorganize the text boxes as you desire. Experiment with shade schemes and font pairings. Alter, share or cooperate with other people on your work. Download Categories Of Segmenting And Profiling Customers Customer Demographics Segmentation Dashboard Guidelines PDF and find out how to give a successful presentation. Present a perfect display to your team and make your presentation unforgettable.

Vendor Performance Analysis And Administration Supplier Performance And Order Cycle Time Monitoring Dashboard Themes PDF
The following slide showcases a dashboard to supervise and manage procurement order cycle time an supplier performance. It includes key elements such as defect rate, on time supplies, supplier availability, lead time, supplier defect rate, defect type and delivery time. If you are looking for a format to display your unique thoughts, then the professionally designed Vendor Performance Analysis And Administration Supplier Performance And Order Cycle Time Monitoring Dashboard Themes PDF is the one for you. You can use it as a Google Slides template or a PowerPoint template. Incorporate impressive visuals, symbols, images, and other charts. Modify or reorganize the text boxes as you desire. Experiment with shade schemes and font pairings. Alter, share or cooperate with other people on your work. Download Vendor Performance Analysis And Administration Supplier Performance And Order Cycle Time Monitoring Dashboard Themes PDF and find out how to give a successful presentation. Present a perfect display to your team and make your presentation unforgettable.
Product And Customer Performance Tracking Dashboard Summary PDF
This slide provides information regarding dashboard utilized by firm to monitor performance of products offered and customer associated. The performance is tracked through revenues generated, new customer acquired, customer satisfaction, sales comparison, etc. If you are looking for a format to display your unique thoughts, then the professionally designed Product And Customer Performance Tracking Dashboard Summary PDF is the one for you. You can use it as a Google Slides template or a PowerPoint template. Incorporate impressive visuals, symbols, images, and other charts. Modify or reorganize the text boxes as you desire. Experiment with shade schemes and font pairings. Alter, share or cooperate with other people on your work. Download Product And Customer Performance Tracking Dashboard Summary PDF and find out how to give a successful presentation. Present a perfect display to your team and make your presentation unforgettable.
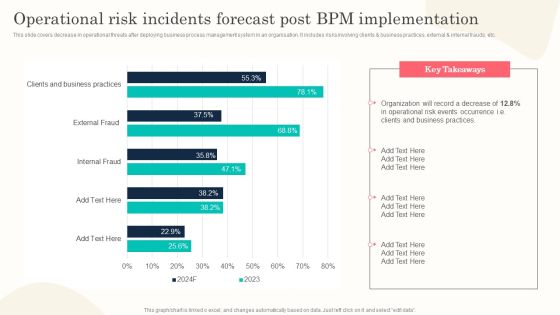
Operational Risk Incidents Forecast Post BPM Implementation Mockup PDF
This slide covers decrease in operational threats after deploying business process management system in an organisation. It includes risks involving clients and business practices, external and internal frauds, etc. If you are looking for a format to display your unique thoughts, then the professionally designed Operational Risk Incidents Forecast Post BPM Implementation Mockup PDF is the one for you. You can use it as a Google Slides template or a PowerPoint template. Incorporate impressive visuals, symbols, images, and other charts. Modify or reorganize the text boxes as you desire. Experiment with shade schemes and font pairings. Alter, share or cooperate with other people on your work. Download Operational Risk Incidents Forecast Post BPM Implementation Mockup PDF and find out how to give a successful presentation. Present a perfect display to your team and make your presentation unforgettable.

Analyze Online And Offline Marketing Campaigns Data Graphics PDF
This template covers dashboard to measure and analyze target marketing campaign performance. It also helps in tracking and reporting online and offline marketing campaigns through KPIs such as traffic sources, lead generation metrics, offline product sales, store visitations, customer acquisition, and offline retention and advocacy. If you are looking for a format to display your unique thoughts, then the professionally designed Analyze Online And Offline Marketing Campaigns Data Graphics PDF is the one for you. You can use it as a Google Slides template or a PowerPoint template. Incorporate impressive visuals, symbols, images, and other charts. Modify or reorganize the text boxes as you desire. Experiment with shade schemes and font pairings. Alter, share or cooperate with other people on your work. Download Analyze Online And Offline Marketing Campaigns Data Graphics PDF and find out how to give a successful presentation. Present a perfect display to your team and make your presentation unforgettable.

Experiential Shopping Outlet Overview Addressing In Store Purchase Drivers At Present Topics PDF
This slide provides information regarding in store purchase drivers such as live product demonstration, exclusive discounts and reasons why millennials visit stores such as availability of buying online and pick up at store. If you are looking for a format to display your unique thoughts, then the professionally designed Experiential Shopping Outlet Overview Addressing In Store Purchase Drivers At Present Topics PDF is the one for you. You can use it as a Google Slides template or a PowerPoint template. Incorporate impressive visuals, symbols, images, and other charts. Modify or reorganize the text boxes as you desire. Experiment with shade schemes and font pairings. Alter, share or cooperate with other people on your work. Download Experiential Shopping Outlet Overview Addressing In Store Purchase Drivers At Present Topics PDF and find out how to give a successful presentation. Present a perfect display to your team and make your presentation unforgettable.

Cobots Global Statistics Dashboard To Track Cobot Performance Mockup PDF
This slide represents the cobots performance dashboard by covering details of battery level, performance, total hours, average time, time to return, energy consumption, and so on. If you are looking for a format to display your unique thoughts, then the professionally designed Cobots Global Statistics Dashboard To Track Cobot Performance Mockup PDF is the one for you. You can use it as a Google Slides template or a PowerPoint template. Incorporate impressive visuals, symbols, images, and other charts. Modify or reorganize the text boxes as you desire. Experiment with shade schemes and font pairings. Alter, share or cooperate with other people on your work. Download Cobots Global Statistics Dashboard To Track Cobot Performance Mockup PDF and find out how to give a successful presentation. Present a perfect display to your team and make your presentation unforgettable.

Over The Top Platform Company Profile Historical Revenue Topics PDF
The following slide highlights the revenue generated from Disney plus streaming services from its inception along with quarterly growth and key insights. If you are looking for a format to display your unique thoughts, then the professionally designed Over The Top Platform Company Profile Historical Revenue Topics PDF is the one for you. You can use it as a Google Slides template or a PowerPoint template. Incorporate impressive visuals, symbols, images, and other charts. Modify or reorganize the text boxes as you desire. Experiment with shade schemes and font pairings. Alter, share or cooperate with other people on your work. Download Over The Top Platform Company Profile Historical Revenue Topics PDF and find out how to give a successful presentation. Present a perfect display to your team and make your presentation unforgettable.
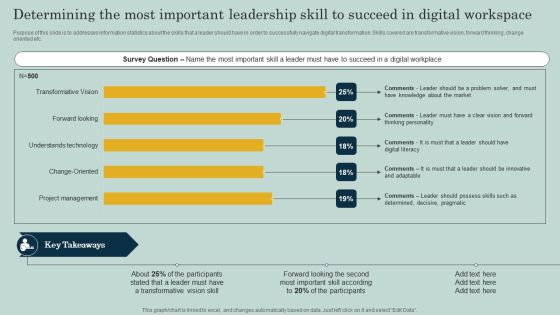
Determining The Most Important Leadership Skill To Succeed In Digital Workspace Ppt Infographic Template Example Topics PDF
Purpose of this slide is to addresses information statistics about the skills that a leader should have in order to successfully navigate digital transformation. Skills covered are transformative vision, forward thinking, change oriented etc. If you are looking for a format to display your unique thoughts, then the professionally designed Determining The Most Important Leadership Skill To Succeed In Digital Workspace Ppt Infographic Template Example Topics PDF is the one for you. You can use it as a Google Slides template or a PowerPoint template. Incorporate impressive visuals, symbols, images, and other charts. Modify or reorganize the text boxes as you desire. Experiment with shade schemes and font pairings. Alter, share or cooperate with other people on your work. Download Determining The Most Important Leadership Skill To Succeed In Digital Workspace Ppt Infographic Template Example Topics PDF and find out how to give a successful presentation. Present a perfect display to your team and make your presentation unforgettable.

Ml And Big Data In Information Technology Processes Aiops Dashboard To Monitor IT Operations Sample PDF
The following slide highlights the various key performance indicators of the AIOp, these can be problem quick review, cloud and infrastructure and applications health If you are looking for a format to display your unique thoughts, then the professionally designed Ml And Big Data In Information Technology Processes Aiops Dashboard To Monitor IT Operations Sample PDF is the one for you. You can use it as a Google Slides template or a PowerPoint template. Incorporate impressive visuals, symbols, images, and other charts. Modify or reorganize the text boxes as you desire. Experiment with shade schemes and font pairings. Alter, share or cooperate with other people on your work. Download Ml And Big Data In Information Technology Processes Aiops Dashboard To Monitor IT Operations Sample PDF and find out how to give a successful presentation. Present a perfect display to your team and make your presentation unforgettable.
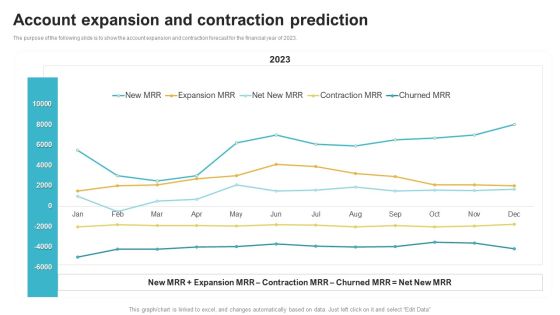
Saas Continuous Income Generation Model For Software Startup Account Expansion And Contraction Prediction Mockup PDF
The purpose of the following slide is to show the account expansion and contraction forecast for the financial year of 2023. If you are looking for a format to display your unique thoughts, then the professionally designed Saas Continuous Income Generation Model For Software Startup Account Expansion And Contraction Prediction Mockup PDF is the one for you. You can use it as a Google Slides template or a PowerPoint template. Incorporate impressive visuals, symbols, images, and other charts. Modify or reorganize the text boxes as you desire. Experiment with shade schemes and font pairings. Alter, share or cooperate with other people on your work. Download Saas Continuous Income Generation Model For Software Startup Account Expansion And Contraction Prediction Mockup PDF and find out how to give a successful presentation. Present a perfect display to your team and make your presentation unforgettable.

Video Streaming Technology Company Introduction Annual Downloads And Subscription Diagrams PDF
The following slide highlights the comparative analysis of annual downloads and annual subscribers for Disney plus streaming services. It shows the relative change in subscription growth against the annual download. If you are looking for a format to display your unique thoughts, then the professionally designed Video Streaming Technology Company Introduction Annual Downloads And Subscription Diagrams PDF is the one for you. You can use it as a Google Slides template or a PowerPoint template. Incorporate impressive visuals, symbols, images, and other charts. Modify or reorganize the text boxes as you desire. Experiment with shade schemes and font pairings. Alter, share or cooperate with other people on your work. Download Video Streaming Technology Company Introduction Annual Downloads And Subscription Diagrams PDF and find out how to give a successful presentation. Present a perfect display to your team and make your presentation unforgettable.

Challenges In Managing And Resolving Client Objections Infographics PDF
This slide showcases various issues faced by business in customer issue managing and resolving. It includes problems such as high objection handling and resolution time and lack of trained sales representatives. If you are looking for a format to display your unique thoughts, then the professionally designed Challenges In Managing And Resolving Client Objections Infographics PDF is the one for you. You can use it as a Google Slides template or a PowerPoint template. Incorporate impressive visuals, symbols, images, and other charts. Modify or reorganize the text boxes as you desire. Experiment with shade schemes and font pairings. Alter, share or cooperate with other people on your work. Download Challenges In Managing And Resolving Client Objections Infographics PDF and find out how to give a successful presentation. Present a perfect display to your team and make your presentation unforgettable.

Consulting Firm Business Profile Gender Diversity At Kantar Structure PDF
The following slide highlights the gender diversity present at Kantar company. It shows total employees and gender distribution for employees board of managers, key management personal, and employees If you are looking for a format to display your unique thoughts, then the professionally designed Consulting Firm Business Profile Gender Diversity At Kantar Structure PDF is the one for you. You can use it as a Google Slides template or a PowerPoint template. Incorporate impressive visuals, symbols, images, and other charts. Modify or reorganize the text boxes as you desire. Experiment with shade schemes and font pairings. Alter, share or cooperate with other people on your work. Download Consulting Firm Business Profile Gender Diversity At Kantar Structure PDF and find out how to give a successful presentation. Present a perfect display to your team and make your presentation unforgettable.

Challenges In Managing And Resolving Client Objections Clipart PDF
This slide showcases various issues faced by business in customer issue managing and resolving. It includes problems such as high objection handling and resolution time and lack of trained sales representatives. If you are looking for a format to display your unique thoughts, then the professionally designed Challenges In Managing And Resolving Client Objections Clipart PDF is the one for you. You can use it as a Google Slides template or a PowerPoint template. Incorporate impressive visuals, symbols, images, and other charts. Modify or reorganize the text boxes as you desire. Experiment with shade schemes and font pairings. Alter, share or cooperate with other people on your work. Download Challenges In Managing And Resolving Client Objections Clipart PDF and find out how to give a successful presentation. Present a perfect display to your team and make your presentation unforgettable.
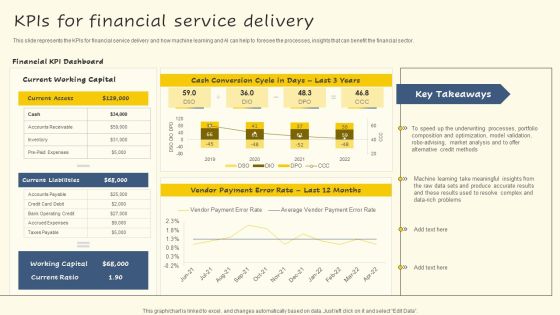
Kpis For Financial Service Delivery Background PDF
This slide represents the KPIs for financial service delivery and how machine learning and AI can help to foresee the processes, insights that can benefit the financial sector. If you are looking for a format to display your unique thoughts, then the professionally designed Kpis For Financial Service Delivery Background PDF is the one for you. You can use it as a Google Slides template or a PowerPoint template. Incorporate impressive visuals, symbols, images, and other charts. Modify or reorganize the text boxes as you desire. Experiment with shade schemes and font pairings. Alter, share or cooperate with other people on your work. Download Kpis For Financial Service Delivery Background PDF and find out how to give a successful presentation. Present a perfect display to your team and make your presentation unforgettable.

Customer Experience Optimization Why To Prioritize Customer Service Formats PDF
This slide shows the key insights that signifies the importance of customer service in achieving business growth. If you are looking for a format to display your unique thoughts, then the professionally designed Customer Experience Optimization Why To Prioritize Customer Service Formats PDF is the one for you. You can use it as a Google Slides template or a PowerPoint template. Incorporate impressive visuals, symbols, images, and other charts. Modify or reorganize the text boxes as you desire. Experiment with shade schemes and font pairings. Alter, share or cooperate with other people on your work. Download Customer Experience Optimization Why To Prioritize Customer Service Formats PDF and find out how to give a successful presentation. Present a perfect display to your team and make your presentation unforgettable.

B2B Buyers Being Skeptical Prior Making Buying Decisions Information PDF
This slide provides information regarding characteristic of B2B buyer as being skeptical before making buying decision and seek validation for the same. If you are looking for a format to display your unique thoughts, then the professionally designed B2B Buyers Being Skeptical Prior Making Buying Decisions Information PDF is the one for you. You can use it as a Google Slides template or a PowerPoint template. Incorporate impressive visuals, symbols, images, and other charts. Modify or reorganize the text boxes as you desire. Experiment with shade schemes and font pairings. Alter, share or cooperate with other people on your work. Download B2B Buyers Being Skeptical Prior Making Buying Decisions Information PDF and find out how to give a successful presentation. Present a perfect display to your team and make your presentation unforgettable.

Dashboard To Identify Brand At Declining Stage With Low Sales Demonstration PDF
This slide covers dashboard to track brand with lowest sales. The purpose of this template is to provide information based on revenue generated annually along with total units sold. It includes tracking based on monthly revenue, unit sales, etc. If you are looking for a format to display your unique thoughts, then the professionally designed Dashboard To Identify Brand At Declining Stage With Low Sales Demonstration PDF is the one for you. You can use it as a Google Slides template or a PowerPoint template. Incorporate impressive visuals, symbols, images, and other charts. Modify or reorganize the text boxes as you desire. Experiment with shade schemes and font pairings. Alter, share or cooperate with other people on your work. Download Dashboard To Identify Brand At Declining Stage With Low Sales Demonstration PDF and find out how to give a successful presentation. Present a perfect display to your team and make your presentation unforgettable.

Generative AI Potential Productivity Growth In Different Countries Brochure PDF
slide showcases potential impact of generative AI technology on productivity in different countries. It highlights impact on different countries such as Japan, Germany, France, United States, China, Mexico, India and South Africa. If you are looking for a format to display your unique thoughts, then the professionally designed Generative AI Potential Productivity Growth In Different Countries Brochure PDF is the one for you. You can use it as a Google Slides template or a PowerPoint template. Incorporate impressive visuals, symbols, images, and other charts. Modify or reorganize the text boxes as you desire. Experiment with shade schemes and font pairings. Alter, share or cooperate with other people on your work. Download Generative AI Potential Productivity Growth In Different Countries Brochure PDF and find out how to give a successful presentation. Present a perfect display to your team and make your presentation unforgettable.

Competitive Landscaping For Managed Services Market Pictures PDF
The following slide provides a detailed analysis of the market share of our company in comparison to the competition. If you are looking for a format to display your unique thoughts, then the professionally designed Competitive Landscaping For Managed Services Market Pictures PDF is the one for you. You can use it as a Google Slides template or a PowerPoint template. Incorporate impressive visuals, symbols, images, and other charts. Modify or reorganize the text boxes as you desire. Experiment with shade schemes and font pairings. Alter, share or cooperate with other people on your work. Download Competitive Landscaping For Managed Services Market Pictures PDF and find out how to give a successful presentation. Present a perfect display to your team and make your presentation unforgettable.

Iot Integration In Manufacturing Predictive Analytics Dashboard To Track Manufacturing Operations Background PDF
This slide depicts the predictive analytics dashboard to track manufacturing operations, including production volume, order volume, active machines, sales revenue, top five products, downtime causes, production volume by top five machines, and so on. If you are looking for a format to display your unique thoughts, then the professionally designed Iot Integration In Manufacturing Predictive Analytics Dashboard To Track Manufacturing Operations Background PDF is the one for you. You can use it as a Google Slides template or a PowerPoint template. Incorporate impressive visuals, symbols, images, and other charts. Modify or reorganize the text boxes as you desire. Experiment with shade schemes and font pairings. Alter, share or cooperate with other people on your work. Download Iot Integration In Manufacturing Predictive Analytics Dashboard To Track Manufacturing Operations Background PDF and find out how to give a successful presentation. Present a perfect display to your team and make your presentation unforgettable.

Targeted Marketing Campaigns To Improve Buyers Experience Dashboard For Personalized Digital Marketing Kpis Diagrams PDF
This slide showcases dashboard that can help organization to measure the KPIs after implementing personalized marketing campaigns. Its key elements are lead breakdown, web user to lead, lead to trial, leads by region and google analtics web traffic If you are looking for a format to display your unique thoughts, then the professionally designed Targeted Marketing Campaigns To Improve Buyers Experience Dashboard For Personalized Digital Marketing Kpis Diagrams PDF is the one for you. You can use it as a Google Slides template or a PowerPoint template. Incorporate impressive visuals, symbols, images, and other charts. Modify or reorganize the text boxes as you desire. Experiment with shade schemes and font pairings. Alter, share or cooperate with other people on your work. Download Targeted Marketing Campaigns To Improve Buyers Experience Dashboard For Personalized Digital Marketing Kpis Diagrams PDF and find out how to give a successful presentation. Present a perfect display to your team and make your presentation unforgettable.

Strategic Approaches To Efficient Candidate Selection Impact Of Transparency In Recruitment On Employee Themes PDF
Following slide exhibits survey that helps to understand role of transparency in employee high commitment towards company. It includes elements such as satisfaction towards employer, job and salary. If you are looking for a format to display your unique thoughts, then the professionally designed Strategic Approaches To Efficient Candidate Selection Impact Of Transparency In Recruitment On Employee Themes PDF is the one for you. You can use it as a Google Slides template or a PowerPoint template. Incorporate impressive visuals, symbols, images, and other charts. Modify or reorganize the text boxes as you desire. Experiment with shade schemes and font pairings. Alter, share or cooperate with other people on your work. Download Strategic Approaches To Efficient Candidate Selection Impact Of Transparency In Recruitment On Employee Themes PDF and find out how to give a successful presentation. Present a perfect display to your team and make your presentation unforgettable.

Cybersecurity Operations Cybersecops Before Vs After Secops Implementation Inspiration PDF
This slide represents the impact of the successful implementation of SecOps in the organization by showing the reduced number of malware attacks on departments. The purpose of this slide is to highlight the reduced number of malware attacks on different departments after implementing SecOps. If you are looking for a format to display your unique thoughts, then the professionally designed Cybersecurity Operations Cybersecops Before Vs After Secops Implementation Inspiration PDF is the one for you. You can use it as a Google Slides template or a PowerPoint template. Incorporate impressive visuals, symbols, images, and other charts. Modify or reorganize the text boxes as you desire. Experiment with shade schemes and font pairings. Alter, share or cooperate with other people on your work. Download Cybersecurity Operations Cybersecops Before Vs After Secops Implementation Inspiration PDF and find out how to give a successful presentation. Present a perfect display to your team and make your presentation unforgettable.
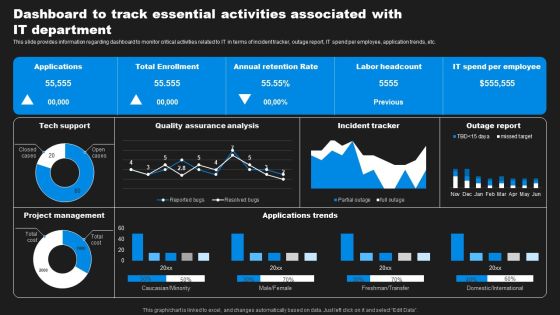
Enhancing Information Technology With Strategic Dashboard To Track Essential Activities Formats PDF
This slide provides information regarding dashboard to monitor critical activities related to IT in terms of incident tracker, outage report, IT spend per employee, application trends, etc. If you are looking for a format to display your unique thoughts, then the professionally designed Enhancing Information Technology With Strategic Dashboard To Track Essential Activities Formats PDF is the one for you. You can use it as a Google Slides template or a PowerPoint template. Incorporate impressive visuals, symbols, images, and other charts. Modify or reorganize the text boxes as you desire. Experiment with shade schemes and font pairings. Alter, share or cooperate with other people on your work. Download Enhancing Information Technology With Strategic Dashboard To Track Essential Activities Formats PDF and find out how to give a successful presentation. Present a perfect display to your team and make your presentation unforgettable.
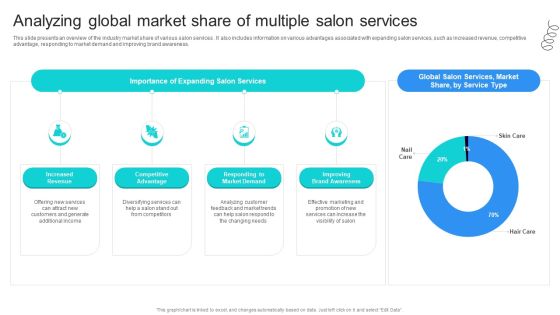
Strategic Marketing For Hair And Beauty Salon To Increase Analyzing Global Market Share Introduction PDF
This slide presents an overview of the industry market share of various salon services . It also includes information on various advantages associated with expanding salon services, such as increased revenue, competitive advantage, responding to market demand and improving brand awareness. If you are looking for a format to display your unique thoughts, then the professionally designed Strategic Marketing For Hair And Beauty Salon To Increase Analyzing Global Market Share Introduction PDF is the one for you. You can use it as a Google Slides template or a PowerPoint template. Incorporate impressive visuals, symbols, images, and other charts. Modify or reorganize the text boxes as you desire. Experiment with shade schemes and font pairings. Alter, share or cooperate with other people on your work. Download Strategic Marketing For Hair And Beauty Salon To Increase Analyzing Global Market Share Introduction PDF and find out how to give a successful presentation. Present a perfect display to your team and make your presentation unforgettable.
