AI PPT Maker
Templates
PPT Bundles
Design Services
Business PPTs
Business Plan
Management
Strategy
Introduction PPT
Roadmap
Self Introduction
Timelines
Process
Marketing
Agenda
Technology
Medical
Startup Business Plan
Cyber Security
Dashboards
SWOT
Proposals
Education
Pitch Deck
Digital Marketing
KPIs
Project Management
Product Management
Artificial Intelligence
Target Market
Communication
Supply Chain
Google Slides
Research Services
 One Pagers
All Categories
-
Home
- Customer Favorites
- Resource Plan
Resource Plan
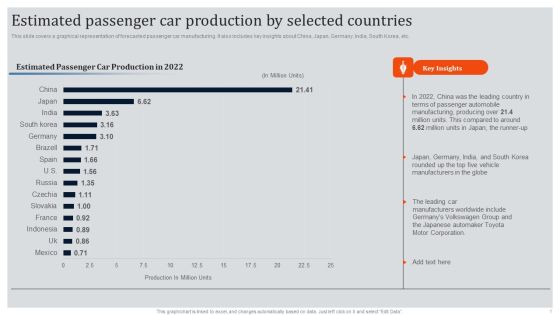
Global Automotive Industry Research And Analysis Estimated Passenger Car Production By Selected Countries Infographics PDF
Whether you have daily or monthly meetings, a brilliant presentation is necessary. Global Automotive Industry Research And Analysis Estimated Passenger Car Production By Selected Countries Infographics PDF can be your best option for delivering a presentation. Represent everything in detail using Global Automotive Industry Research And Analysis Estimated Passenger Car Production By Selected Countries Infographics PDF and make yourself stand out in meetings. The template is versatile and follows a structure that will cater to your requirements. All the templates prepared by Slidegeeks are easy to download and edit. Our research experts have taken care of the corporate themes as well. So, give it a try and see the results.

Talent Administration And Succession HR Performance Management Dashboard Background PDF
Whether you have daily or monthly meetings, a brilliant presentation is necessary. Talent Administration And Succession HR Performance Management Dashboard Background PDF can be your best option for delivering a presentation. Represent everything in detail using Talent Administration And Succession HR Performance Management Dashboard Background PDF and make yourself stand out in meetings. The template is versatile and follows a structure that will cater to your requirements. All the templates prepared by Slidegeeks are easy to download and edit. Our research experts have taken care of the corporate themes as well. So, give it a try and see the results.
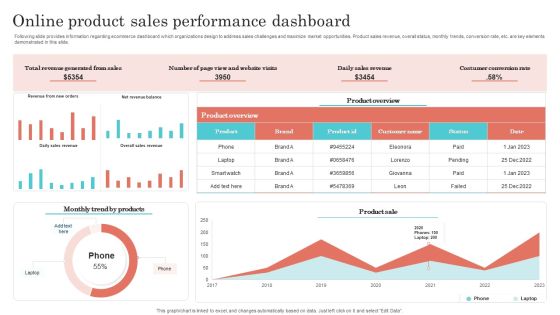
Online Product Sales Performance Dashboard Designs PDF
Following slide provides information regarding ecommerce dashboard which organizations design to address sales challenges and maximize market opportunities. Product sales revenue, overall status, monthly trends, conversion rate, etc. are key elements demonstrated in this slide. Showcasing this set of slides titled Online Product Sales Performance Dashboard Designs PDF. The topics addressed in these templates are Revenue Generated From Sales, Daily Sales Revenue, Costumer Conversion Rate. All the content presented in this PPT design is completely editable. Download it and make adjustments in color, background, font etc. as per your unique business setting.

Cloud Platform Dashboard For Tracking Project Team Activities Microsoft PDF
The following slide depicts project team task tracking cloud dashboard. It provides information about hours worked, projects worked, time spent, daily limit, product design, weekly activity, etc. Create an editable Cloud Platform Dashboard For Tracking Project Team Activities Microsoft PDF that communicates your idea and engages your audience. Whether you are presenting a business or an educational presentation, pre-designed presentation templates help save time. Cloud Platform Dashboard For Tracking Project Team Activities Microsoft PDF is highly customizable and very easy to edit, covering many different styles from creative to business presentations. Slidegeeks has creative team members who have crafted amazing templates. So, go and get them without any delay.

Storage Facility Orders Productivity Management Dashboard Diagrams PDF
This slide showcases a dashboard for tracking and managing orders productivity performance at warehouse. It includes key components such as collection time, daily orders, number of workers per shift, top ordered products and least ordered products. Showcasing this set of slides titled Storage Facility Orders Productivity Management Dashboard Diagrams PDF. The topics addressed in these templates are Top Most Ordered Products, Least Ordered Products, Orders Per Day. All the content presented in this PPT design is completely editable. Download it and make adjustments in color, background, font etc. as per your unique business setting.
Nft Transaction Analysis And Tracking Dashboard Ppt PowerPoint Presentation File Layouts PDF
This slide demonstrates the dashboard for tracking NFT transactions and analysis based on daily sales, ETH volume collections, and so on. Present like a pro with Nft Transaction Analysis And Tracking Dashboard Ppt PowerPoint Presentation File Layouts PDF Create beautiful presentations together with your team, using our easy to use presentation slides. Share your ideas in real time and make changes on the fly by downloading our templates. So whether you are in the office, on the go, or in a remote location, you can stay in sync with your team and present your ideas with confidence. With Slidegeeks presentation got a whole lot easier. Grab these presentations today.
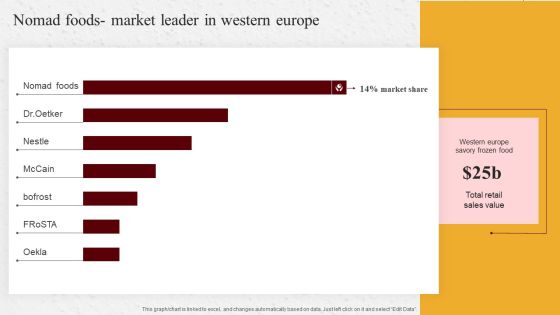
Industry Report Of Packaged Food Products Part 2 Nomad Foods Market Pictures PDF
Whether you have daily or monthly meetings, a brilliant presentation is necessary. Industry Report Of Packaged Food Products Part 2 Nomad Foods Market Pictures PDF can be your best option for delivering a presentation. Represent everything in detail using Industry Report Of Packaged Food Products Part 2 Nomad Foods Market Pictures PDF and make yourself stand out in meetings. The template is versatile and follows a structure that will cater to your requirements. All the templates prepared by Slidegeeks are easy to download and edit. Our research experts have taken care of the corporate themes as well. So, give it a try and see the results.

New Orders Logistics Management Dashboard With Delivery Status Designs PDF
This slide showcases shipping management dashboard that can help company to daily track the status of their new orders shipped. Its key components are recent orders, items ordered, items shipped and total shipped orders. Pitch your topic with ease and precision using this New Orders Logistics Management Dashboard With Delivery Status Designs PDF. This layout presents information on Recent Orders, Current Shipping Status, New Orders. It is also available for immediate download and adjustment. So, changes can be made in the color, design, graphics or any other component to create a unique layout.
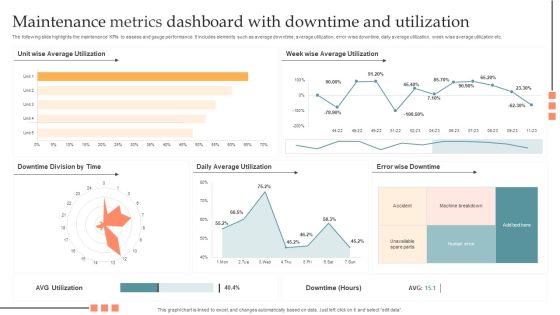
Maintenance Metrics Dashboard With Downtime And Utilization Pictures PDF
The following slide highlights the maintenance KPIs to assess and gauge performance. It includes elements such as average downtime, average utilization, error wise downtime, daily average utilization, week wise average utilization etc. Showcasing this set of slides titled Maintenance Metrics Dashboard With Downtime And Utilization Pictures PDF. The topics addressed in these templates are Maintenance Metrics Dashboard, Downtime And Utilization. All the content presented in this PPT design is completely editable. Download it and make adjustments in color, background, font etc. as per your unique business setting.

Addressing Insurance Product Sales Estimation Formats PDF
This slide provides information regarding the insurance and financial products sales estimation for upcoming five years. Whether you have daily or monthly meetings, a brilliant presentation is necessary. Addressing Insurance Product Sales Estimation Formats PDF can be your best option for delivering a presentation. Represent everything in detail using Addressing Insurance Product Sales Estimation Formats PDF and make yourself stand out in meetings. The template is versatile and follows a structure that will cater to your requirements. All the templates prepared by Slidegeeks are easy to download and edit. Our research experts have taken care of the corporate themes as well. So, give it a try and see the results.

Call Center Kpis Agent Performance Dashboard Clipart PDF
This slide covers contact center agent performance metrics KPI dashboard. It involves metrics such as number of calls, average response time, average hold time, daily average transfer rate and agents with most hold time and transfer rate. Showcasing this set of slides titled Call Center Kpis Agent Performance Dashboard Clipart PDF. The topics addressed in these templates are Transfer Rate, Call Center, Hold Time. All the content presented in this PPT design is completely editable. Download it and make adjustments in color, background, font etc. as per your unique business setting.

Dashboard To Measure Robotic Process Automation Bots Performance Structure PDF
This slide presents a dashboard to measure RPA bots performance in an organization. It includes utilization hours, bot types, average daily utilization, percentage of errors that occurred by bots, and occupied bots by business operations. If your project calls for a presentation, then Slidegeeks is your go-to partner because we have professionally designed, easy-to-edit templates that are perfect for any presentation. After downloading, you can easily edit Dashboard To Measure Robotic Process Automation Bots Performance Structure PDF and make the changes accordingly. You can rearrange slides or fill them with different images. Check out all the handy templates

Digital Wellbeing And IOT And Remote Management Professional PDF
This slide provide a dashboard for tracking the daily time spent on mobile phone social media applications that helps to keep a track of screen time and take necessary actions for individual health. Key components are time spent, social media apps, etc. Showcasing this set of slides titled Digital Wellbeing And IOT And Remote Management Professional PDF. The topics addressed in these templates are Trend, Dashboard, Digital Wellbeing. All the content presented in this PPT design is completely editable. Download it and make adjustments in color, background, font etc. as per your unique business setting.
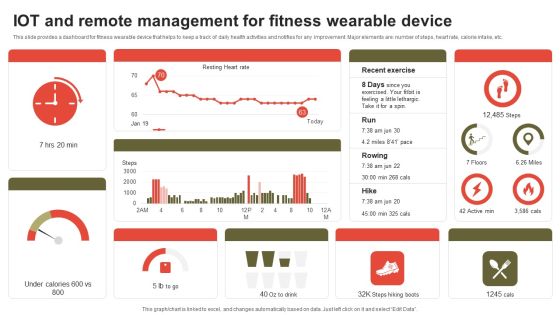
IOT And Remote Management For Fitness Wearable Device Download PDF
This slide provides a dashboard for fitness wearable device that helps to keep a track of daily health activities and notifies for any improvement. Major elements are number of steps, heart rate, calorie intake, etc. Showcasing this set of slides titled IOT And Remote Management For Fitness Wearable Device Download PDF. The topics addressed in these templates are Recent Exercise, Run, Rowing. All the content presented in this PPT design is completely editable. Download it and make adjustments in color, background, font etc. as per your unique business setting.

Client Health Score Measurement Survey Result Download PDF
This slide provides information about how frequently managers measure the customer health score in an organization to reduce the churn rate of users. It includes elements such as sample size key insights, quarterly, annually, daily and weekly. Showcasing this set of slides titled Client Health Score Measurement Survey Result Download PDF. The topics addressed in these templates are Reduce Churn Rate, Improves Efficiency, Provide Innovation Products. All the content presented in this PPT design is completely editable. Download it and make adjustments in color, background, font etc. as per your unique business setting.
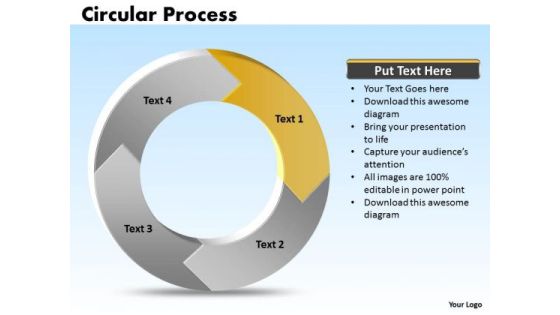
Ppt Cycle Process Cause And Effect Diagram PowerPoint Template 4 Stages Templates
PPT cycle process cause and effect diagram powerpoint template 4 stages Templates-Visually support your Microsoft office PPT Presentation with our above template. This diagram shows the flow of control between activities. You can model the sequential steps in a process with this diagram-PPT cycle process cause and effect diagram powerpoint template 4 stages Templates-Arrow, Chart, Circular Procedure, Color, Colorful, Connect, Connection, Design, Diagram, Finance, Graphic, Group, Growth, Icon, Illustration, Marketing, Pieces, Process, Recycle, Recycling, Round, Set, Strategy, Symbol, Wheel

Learning And Development Programs For Multiple Departments Building Efficient Workplace Performance Themes PDF
This slide illustrates learning and development programs for various teams. It provides information about communication, spreadsheet management, task management, reporting, finance, trading, analytics, dashboard, email writing, etc.Whether you have daily or monthly meetings, a brilliant presentation is necessary. Learning And Development Programs For Multiple Departments Building Efficient Workplace Performance Themes PDF can be your best option for delivering a presentation. Represent everything in detail using Learning And Development Programs For Multiple Departments Building Efficient Workplace Performance Themes PDF and make yourself stand out in meetings. The template is versatile and follows a structure that will cater to your requirements. All the templates prepared by Slidegeeks are easy to download and edit. Our research experts have taken care of the corporate themes as well. So, give it a try and see the results.

Company Turnover Financial Ratios Chart Comparison Icons PDF
This slide illustrates graph for turnover ratios that are accounts receivable, inventory turnover, accounts payable turnover, fixed asset turnover and total assets turnover ratio. It showcases comparison of three companies. Pitch your topic with ease and precision using this company turnover financial ratios chart comparison icons pdf. This layout presents information on company turnover financial ratios chart comparison. It is also available for immediate download and adjustment. So, changes can be made in the color, design, graphics or any other component to create a unique layout.

Coverage Financial Ratios Chart For 5 Financial Years Themes PDF
This slide illustrates graph for coverage ratios that are interest coverage ratio, debt service coverage ratio and asset coverage ratio. It showcases comparison for a period of 5 years that can help company to measure ability to service its debt and meet its financial obligations Showcasing this set of slides titled coverage financial ratios chart for 5 financial years themes pdf. The topics addressed in these templates are coverage financial ratios chart for 5 financial years. All the content presented in this PPT design is completely editable. Download it and make adjustments in color, background, font etc. as per your unique business setting.

Debt To Equity Financial Ratios Chart Comparison Download PDF
This slide illustrates debt to equity ratio graph that can help to evaluate total debt and financial liabilities against the total shareholders equity. It showcases comparison for a period of last four quarters Pitch your topic with ease and precision using this debt to equity financial ratios chart comparison download pdf. This layout presents information on debt to equity financial ratios chart comparison. It is also available for immediate download and adjustment. So, changes can be made in the color, design, graphics or any other component to create a unique layout.

Dividend Payout Financial Ratios Chart Comparison Themes PDF
This slide showcases dividend payout ratio graph that can help organization to determine the percentage of the companys earnings that is paid out to shareholders by way of dividend. It showcases comparison for a period of 8 years Showcasing this set of slides titled dividend payout financial ratios chart comparison themes pdf. The topics addressed in these templates are dividend payout financial ratios chart comparison. All the content presented in this PPT design is completely editable. Download it and make adjustments in color, background, font etc. as per your unique business setting.

Fixed Asset Turnover Financial Ratios Comparison Chart Structure PDF
This slide showcases graph for fixed asset turnover ratio that can help to identify how efficiently a company is a generating sales with its machinery and equipment. It showcases comparison of ratio of three companies for a period of 5 financial years Showcasing this set of slides titled fixed asset turnover financial ratios comparison chart structure pdf. The topics addressed in these templates are fixed asset turnover financial ratios comparison chart. All the content presented in this PPT design is completely editable. Download it and make adjustments in color, background, font etc. as per your unique business setting.

Inventory Turnover Financial Ratios Chart Conversion Portrait PDF
This slide illustrates graph for inventory turnover ratio that can help company to analyze efficiency of inventory management. It showcases ratio graph comparison of 4 companies for a period of last 6 years Pitch your topic with ease and precision using this inventory turnover financial ratios chart conversion portrait pdf. This layout presents information on inventory turnover financial ratios chart conversion. It is also available for immediate download and adjustment. So, changes can be made in the color, design, graphics or any other component to create a unique layout.

Price To Earning Financial Ratios Chart Comparison Slides PDF
This slide illustrates P or E ratio graph that can help company to measures its current share price relative to its per-share earnings. It showcases comparison for last 5 years Showcasing this set of slides titled price to earning financial ratios chart comparison slides pdf. The topics addressed in these templates are price to earning financial ratios chart comparison. All the content presented in this PPT design is completely editable. Download it and make adjustments in color, background, font etc. as per your unique business setting.
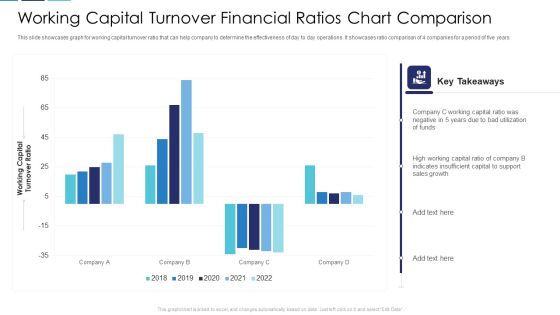
Working Capital Turnover Financial Ratios Chart Comparison Clipart PDF
This slide showcases graph for working capital turnover ratio that can help company to determine the effectiveness of day to day operations. It showcases ratio comparison of 4 companies for a period of five years Pitch your topic with ease and precision using this working capital turnover financial ratios chart comparison clipart pdf. This layout presents information on working capital turnover financial ratios chart comparison. It is also available for immediate download and adjustment. So, changes can be made in the color, design, graphics or any other component to create a unique layout.

Deployment Of Business Process Column Chart Ppt Infographics Smartart PDF
Get a simple yet stunning designed Deployment Of Business Process Column Chart Ppt Infographics Smartart PDF. It is the best one to establish the tone in your meetings. It is an excellent way to make your presentations highly effective. So, download this PPT today from Slidegeeks and see the positive impacts. Our easy-to-edit Deployment Of Business Process Column Chart Ppt Infographics Smartart PDF can be your go-to option for all upcoming conferences and meetings. So, what are you waiting for Grab this template today.

Guide To Business Customer Acquisition Clustered Bar Chart Mockup PDF
Crafting an eye catching presentation has never been more straightforward. Let your presentation shine with this tasteful yet straightforward Guide To Business Customer Acquisition Clustered Bar Chart Mockup PDF template. It offers a minimalistic and classy look that is great for making a statement. The colors have been employed intelligently to add a bit of playfulness while still remaining professional. Construct the ideal Guide To Business Customer Acquisition Clustered Bar Chart Mockup PDF that effortlessly grabs the attention of your audience. Begin now and be certain to wow your customers.
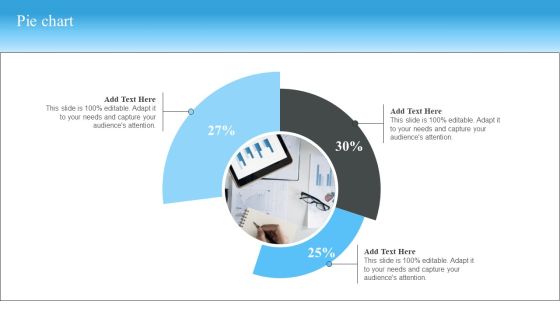
Market Evaluation Of IT Industry Pie Chart Formats PDF
Explore a selection of the finest Market Evaluation Of IT Industry Pie Chart Formats PDF here. With a plethora of professionally designed and pre made slide templates, you can quickly and easily find the right one for your upcoming presentation. You can use our Market Evaluation Of IT Industry Pie Chart Formats PDF to effectively convey your message to a wider audience. Slidegeeks has done a lot of research before preparing these presentation templates. The content can be personalized and the slides are highly editable. Grab templates today from Slidegeeks.

Digital Consultation Growth Chart After Pandemic Ppt Slides
This template depicts the growth chart of telemedicine after the pandemic. The purpose of this slide is to measure the telemedicine used by the target audience after the pandemic. It evaluate by conducting survey on e health portal Showcasing this set of slides titled Digital Consultation Growth Chart After Pandemic Ppt Slides. The topics addressed in these templates are Consultation, Growth, Pandemic. All the content presented in this PPT design is completely editable. Download it and make adjustments in color, background, font etc. as per your unique business setting.
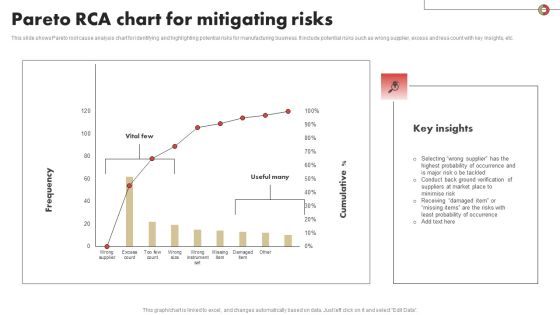
Pareto RCA Chart For Mitigating Risks Slides PDF
This slide shows Pareto root cause analysis chart for identifying and highlighting potential risks for manufacturing business. It include potential risks such as wrong supplier, excess and less count with key insights, etc. Pitch your topic with ease and precision using this Pareto RCA Chart For Mitigating Risks Slides PDF Download. This layout presents information on Mitigating, Pareto, Probability. It is also available for immediate download and adjustment. So, changes can be made in the color, design, graphics or any other component to create a unique layout.

Reform Endgame Discounted Cash Flow Model Demonstration PDF
DCF is a valuation method will help in determining the present value of company at depending upon the projections of how much money will it generate in future. Deliver an awe inspiring pitch with this creative reform endgame discounted cash flow model demonstration pdf bundle. Topics like discount rate, perpetual growth rate, current price, discounted cash flow, shares outstanding can be discussed with this completely editable template. It is available for immediate download depending on the needs and requirements of the user.
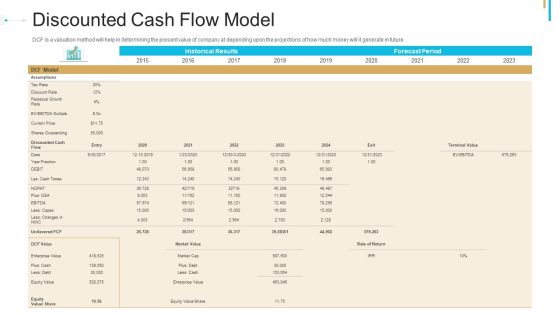
Stock Offering As An Exit Alternative Discounted Cash Flow Model Portrait PDF
DCF is a valuation method will help in determining the present value of company at depending upon the projections of how much money will it generate in future. Deliver an awe inspiring pitch with this creative stock offering as an exit alternative discounted cash flow model portrait pdf bundle. Topics like assumptions, value, price, growth can be discussed with this completely editable template. It is available for immediate download depending on the needs and requirements of the user.

Business Process Flowchart Examples 4 Stages Spoke Design Center Lock PowerPoint Slides
We present our business process flowchart examples 4 stages spoke design center lock PowerPoint Slides.Download and present our Industrial PowerPoint Templates because It can Conjure up grand ideas with our magical PowerPoint Templates and Slides. Leave everyone awestruck by the end of your presentation. Present our Arrows PowerPoint Templates because Our PowerPoint Templates and Slides will give good value for money. They also have respect for the value of your time. Download our Signs PowerPoint Templates because You can Zap them with our PowerPoint Templates and Slides. See them reel under the impact. Download our Shapes PowerPoint Templates because Our PowerPoint Templates and Slides will generate and maintain the level of interest you desire. They will create the impression you want to imprint on your audience. Present our Process and Flows PowerPoint Templates because You have gained great respect for your brilliant ideas. Use our PowerPoint Templates and Slides to strengthen and enhance your reputation.Use these PowerPoint slides for presentations relating to 3d, abstract, arrow, art, background, blank, business, chart, circle, concept, connection, cycle, development, diagram, direction, element, environment, exchange, finance, financial, flow, graph, graphic, graphic presentation, group, icon, illustration, investment, isolated, isometric, market, motion, movement, organization, passive income, perspective, presentation, process, process chart, recycle, report, ring, sign, step, stock, success, symbol, teamwork, text. The prominent colors used in the PowerPoint template are Orange, Gray, White.
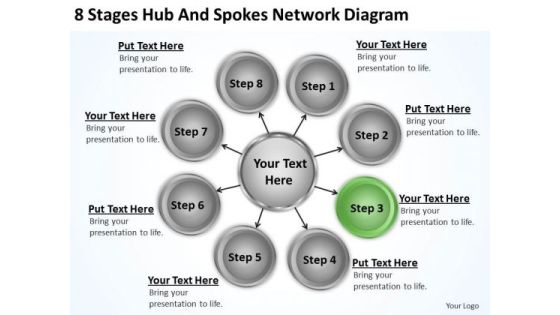
Business Processes 8 Stages Hub And Spokes Network Diagram Ppt 4 PowerPoint Slides
We present our business processes 8 stages hub and spokes network diagram ppt 4 PowerPoint Slides.Download our Industrial PowerPoint Templates because You canTake a leap off the starting blocks with our PowerPoint Templates and Slides. They will put you ahead of the competition in quick time. Download our Arrows PowerPoint Templates because Our PowerPoint Templates and Slides will give good value for money. They also have respect for the value of your time. Download our Signs PowerPoint Templates because It can be used to Set your controls for the heart of the sun. Our PowerPoint Templates and Slides will be the propellant to get you there. Download and present our Shapes PowerPoint Templates because Our PowerPoint Templates and Slides are created with admirable insight. Use them and give your group a sense of your logical mind. Download our Process and Flows PowerPoint Templates because Our PowerPoint Templates and Slides will help you be quick off the draw. Just enter your specific text and see your points hit home.Use these PowerPoint slides for presentations relating to 3d, abstract, arrow, art, background, blank, business, chart, circle, concept, connection, cycle, development, diagram, direction, element, environment, exchange, finance, financial, flow, graph, graphic, graphic presentation, group, icon, illustration, investment, isolated, isometric, market, motion, movement, organization, passive income, perspective, presentation, process, process chart, recycle, report, ring, sign, step, stock, success, symbol, teamwork, text. The prominent colors used in the PowerPoint template are Green, Gray, White.

Business To Business Social Dashboard To Track Social Media Marketing Campaign Metrics Microsoft PDF
This slide showcases dashboard that can help organization to track the metrics of social media marketing campaign. Its key components are followers, post reach, page impressions, visitors, avg engagement and lifetime views. Here you can discover an assortment of the finest PowerPoint and Google Slides templates. With these templates, you can create presentations for a variety of purposes while simultaneously providing your audience with an eye-catching visual experience. Download Business To Business Social Dashboard To Track Social Media Marketing Campaign Metrics Microsoft PDF to deliver an impeccable presentation. These templates will make your job of preparing presentations much quicker, yet still, maintain a high level of quality. Slidegeeks has experienced researchers who prepare these templates and write high-quality content for you. Later on, you can personalize the content by editing the Business To Business Social Dashboard To Track Social Media Marketing Campaign Metrics Microsoft PDF.

Social Networks Marketing To Improve Google Analytics Report To Identify Target Ideas PDF
This slide shows the report to help enterprise identify and analyze the behavior, demographics and online behavior of their target audience. It includes details related to number of users, page views, bounce rate etc. Slidegeeks has constructed Social Networks Marketing To Improve Google Analytics Report To Identify Target Ideas PDF after conducting extensive research and examination. These presentation templates are constantly being generated and modified based on user preferences and critiques from editors. Here, you will find the most attractive templates for a range of purposes while taking into account ratings and remarks from users regarding the content. This is an excellent jumping-off point to explore our content and will give new users an insight into our top-notch PowerPoint Templates.
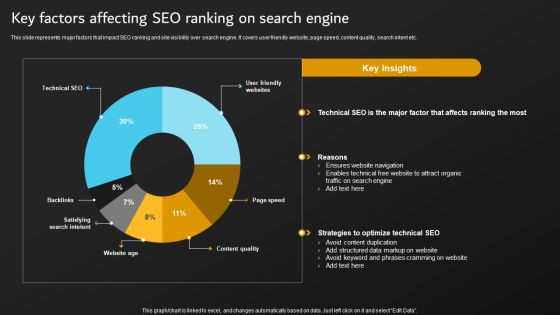
Implementation Of Digital Marketing Key Factors Affecting SEO Ranking On Search Summary PDF
This slide represents major factors that impact SEO ranking and site visibility over search engine. It covers user friendly website, page speed, content quality, search intent etc. Coming up with a presentation necessitates that the majority of the effort goes into the content and the message you intend to convey. The visuals of a PowerPoint presentation can only be effective if it supplements and supports the story that is being told. Keeping this in mind our experts created Implementation Of Digital Marketing Key Factors Affecting SEO Ranking On Search Summary PDF to reduce the time that goes into designing the presentation. This way, you can concentrate on the message while our designers take care of providing you with the right template for the situation.

Consumer Lead Generation Process Lead Generation Dashboard For Tracking Conversion Rates Mockup PDF
This slide covers the KPI dashboard for tracking lead conversion rates. It includes metrics such as visitors, average session rate, per visit, bounce rate, page views, etc. Here you can discover an assortment of the finest PowerPoint and Google Slides templates. With these templates, you can create presentations for a variety of purposes while simultaneously providing your audience with an eye-catching visual experience. Download Consumer Lead Generation Process Lead Generation Dashboard For Tracking Conversion Rates Mockup PDF to deliver an impeccable presentation. These templates will make your job of preparing presentations much quicker, yet still, maintain a high level of quality. Slidegeeks has experienced researchers who prepare these templates and write high-quality content for you. Later on, you can personalize the content by editing the Consumer Lead Generation Process Lead Generation Dashboard For Tracking Conversion Rates Mockup PDF.
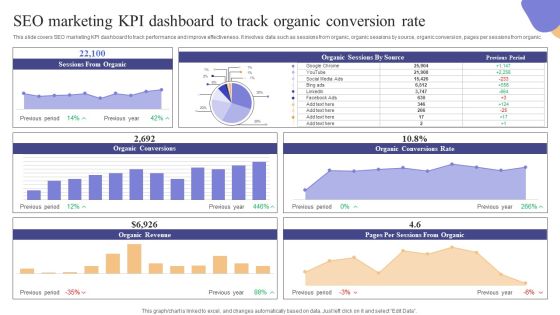
SEO Marketing KPI Dashboard To Track Organic Conversion Rate Microsoft PDF
This slide covers SEO marketing KPI dashboard to track performance and improve effectiveness. It involves data such as sessions from organic, organic sessions by source, organic conversion, pages per sessions from organic. Formulating a presentation can take up a lot of effort and time, so the content and message should always be the primary focus. The visuals of the PowerPoint can enhance the presenters message, so our SEO Marketing KPI Dashboard To Track Organic Conversion Rate Microsoft PDF was created to help save time. Instead of worrying about the design, the presenter can concentrate on the message while our designers work on creating the ideal templates for whatever situation is needed. Slidegeeks has experts for everything from amazing designs to valuable content, we have put everything into SEO Marketing KPI Dashboard To Track Organic Conversion Rate Microsoft PDF

Business Framework Deming Chain Reaction PowerPoint Presentation
This image slide has been designed to display Deming chain reaction in your presentations. This image slide may be used in your presentations to depict business marketing mix. You may change color size and orientation of any icon to your liking. This image slide will help you make professional, fast and affordable presentations.
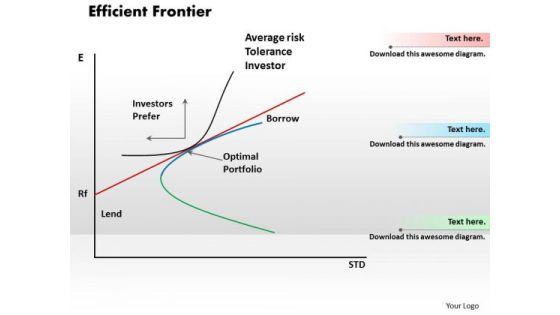
Business Framework Efficient Frontier PowerPoint Presentation
This image slide has been designed to depict efficient frontier diagram. This image slide display graph to show expected level of return for its level of risk. This image slide may be used to exhibit business marketing analysis in your presentations. This image slide will give edge to your presentations.
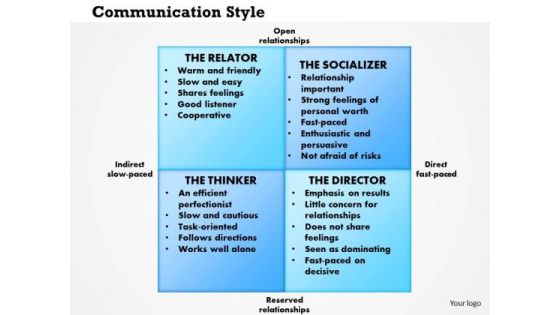
Business Framework Communication Styles PowerPoint Presentation
Our communication styles template emerges from a combination of brain dominance, psychological preference, sensory approach and the communication examples that have surrounded us since birth. This image slide will help you explain concept of successful communication at workplace. Give your thoughts appropriate appearance in your presentations using this image slide.

Business Framework Motivational Archetypes PowerPoint Presentation
Explain the deep structure of human motivation and meaning with this Motivational Archetypes PPT. This PPT contains the 3d graphic of Motivational Archetypes. Use this template in your motivational presentation.

Business Framework PowerPoint Blackboard PowerPoint Presentation
This colorful image slide has been designed with graphic of blackboard, chalk and colored pencils stand. This image slide is 100% editable. You may change color, size and orientation of any icon to your liking. This image slide may be used in school, business and social presentations. Add spark to your presentations using this image slide.

Business Framework PowerPoint Certificate Template PowerPoint Presentation
This image slide displays beautiful certificate PowerPoint template. This image slide is 100% editable. This image slide may be used to depict success, achievement and appreciation in your presentations. This image slide may be used in school, business and social presentations. This image slide will enhance the quality of your presentations.

Business Framework PowerPoint Certificate Templates PowerPoint Presentation
This image slide displays designed certificate PowerPoint template. This image slide is 100% editable. This image slide may be used to depict success, achievement and appreciation in your presentations. This image slide may be used in school, business and social presentations. This image slide will enhance the quality of your presentations.

Business Framework PowerPoint Chain PowerPoint Presentation
This image slide displays value chain info graphic template. This innovative image slide has been designed with abstract info graphic to represent any information. This image slide is 100% editable. You may change color, size and orientation of any icon to your liking. This image slide may be used in school, business and social presentations. Make your presentations interesting using this image slide.
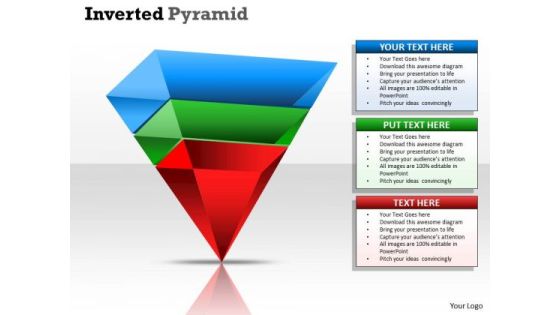
Business Framework PowerPoint Pyramid PowerPoint Presentation
This image slide displays inverted pyramid template. This innovative image slide has been designed with colorful pyramid to represent information. This image slide is 100% editable. You may change color, size and orientation of any icon to your liking. This image slide may be used in school, business and social presentations. This image slide will enhance the quality of your presentations.

Business Framework PowerPoint Roadmap PowerPoint Presentation
This image slide displays road map diagram template. This innovative image slide has been designed with road map having cubes to display information related to achievement and progress. This image slide is 100% editable. You may change color, size and orientation of any icon to your liking. This image slide may be used in school, business and social presentations. This image slide will enhance the quality of your presentations.

Business Framework PowerPoint Speedometer PowerPoint Presentation
This image slide displays speedometer diagram with download and upload speed template. This innovative image slide has been designed to depict progress. This image slide is 100% editable. You may change color, size and orientation of any icon to your liking. This image slide may be used in school, business and social presentations. Create amazing presentations using this image slide.

Business Framework PowerPoint Thermometer PowerPoint Presentation
This image slide displays thermometers template. This innovative image slide has been designed to depict progress. This image slide is 100% editable. You may change color, size and orientation of any icon to your liking. This image slide may be used in school, business and social presentations. Create interesting presentations using this image slide.
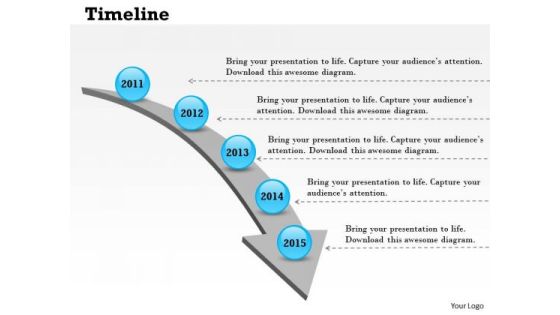
Business Framework PowerPoint Timeline PowerPoint Presentation
This image slide displays timeline with milestones template. This innovative image slide has been designed to depict progress. This image slide is 100% editable. You may change color, size and orientation of any icon to your liking. This image slide may be used in school, business and social presentations. Create amazing presentations using this image slide.
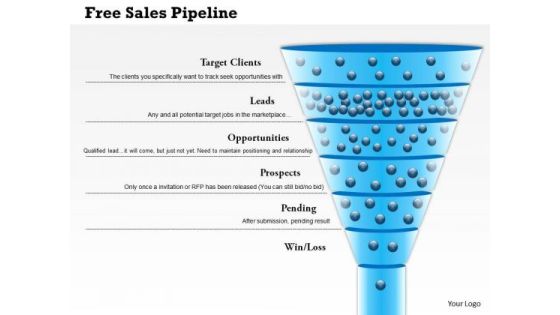
Business Framework Free Sales Pipeline PowerPoint Presentation
This image slide has been designed to display free sales pipeline diagram. This image has been designed with graphic of funnel with spheres and target client, prospective, win, opportunities, prospective, pending and leads attributes. Use this image slide, in your presentation to depict sale prospective in business and marketing presentations. This image slide will help you express your views to target audience.
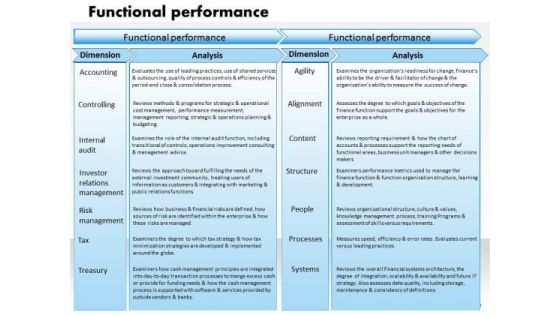
Business Framework Functional Performance PowerPoint Presentation
This image slide has been designed to displays functional performance diagram. This image slide has been designed with textboxes horizontal process diagram with functional performance, dimensions and analysis attributes. Use this image slide in business and marketing presentations to depict accounting, risk management, tax and various dimensions of business. This image slide will enhance the quality of your presentations.
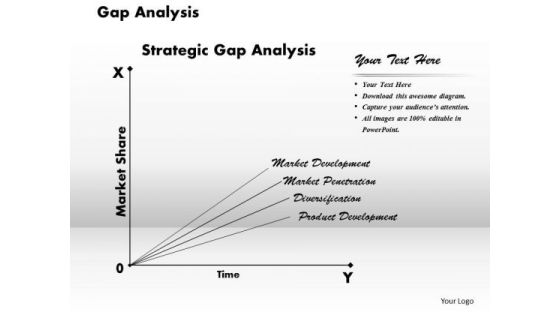
Business Framework Gap Analysis PowerPoint Presentation
This image slide displays gap analysis graph. This image slide has been designed with gap analysis graph with market share and time axis. It is the comparison of actual performance with potential or desired performance. Use this image slide to depict strategic gap analysis in your presentations. Make outstanding presentations in your presentations.
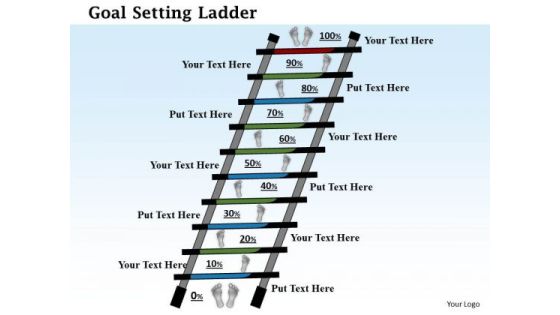
Business Framework Goal Setting Ladder PowerPoint Presentation
This image slide has been designed to express views on goals, targets and achievements. This image slide displays goal setting ladder with percentage steps. This image slide will enhance the quality of your presentations.

Business Framework Groupthink Model PowerPoint Presentation
This image slide displays group think model. This image slide has been crafted with flow model having antecedents and observable consequences attributes. Use this image slide in business, marketing and social presentations. This image slide will help you express your views to target audience.

Business Framework Hawthorn Effect PowerPoint Presentation
This image slide displays Hawthorn effect. The Hawthorne effect refers to a phenomenon whereby individuals improve or modify an aspect of their behavior in response to their awareness of being observed. This image slide may be used in business, social and marketing presentations. This image slide will enhance the quality of your presentations.

Business Framework Hawthorn Effect PowerPoint Presentation 2
This image slide displays Hawthorn effect. The Hawthorne effect refers to a phenomenon whereby individuals improve or modify an aspect of their behavior in response to their awareness of being observed. This image slide may be used in business, social and marketing presentations. This image slide will enhance the quality of your presentations.
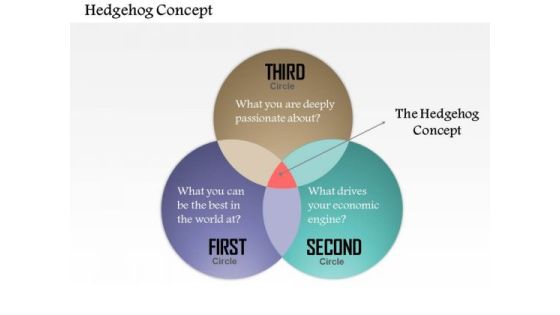
Business Framework Hedgehog Concept PowerPoint Presentation
This image slide displays Hedgehog concept diagram. Use this image slide to express views on understanding of what you can be best at. This image slide may be used in business, social and marketing presentations. This image slide will help you make professional presentations.
