Resource Plan

Product Manufacturing Data Analytics Kpis Dashboard Guidelines PDF
This slide represents the data analytics dashboard for production manufacturing and management. It includes details related to KPIs such as rework quantity, labor cost, performance, overall equipment effectiveness etc. Showcasing this set of slides titled Product Manufacturing Data Analytics Kpis Dashboard Guidelines PDF. The topics addressed in these templates are Quantity, Rework Quantity, Manufacturing Cost, Labor Cot. All the content presented in this PPT design is completely editable. Download it and make adjustments in color, background, font etc. as per your unique business setting.

Power Plant Energy Consumption And Monitoring Dashboard Diagrams PDF
The slide showcases dashboard it helps energy suppliers to cover fast-changing market demands, analyse and optimize production costs as well as to increase the overall profitability in the long-run. It covers energy consumption by sector, production costs, energy sources, contribution to renewable energy, sales, number of power cuts and average duration. Pitch your topic with ease and precision using this Power Plant Energy Consumption And Monitoring Dashboard Diagrams PDF. This layout presents information on Power Plant Energy Consumption, Monitoring Dashboard. It is also available for immediate download and adjustment. So, changes can be made in the color, design, graphics or any other component to create a unique layout.
Global Medicare Outpatients Inpatients Kpi Dashboard Template PDF
This slide shows global healthcare KPIs related to outpatients-inpatients through dashboard. It include Key performance indicators such as average global patients, average treatment cost etc. Pitch your topic with ease and precision using this Global Medicare Outpatients Inpatients Kpi Dashboard Template PDF. This layout presents information on Average Treatment Cost, Average Global Patients, Average Available Staff. It is also available for immediate download and adjustment. So, changes can be made in the color, design, graphics or any other component to create a unique layout.

Statistical Analysis Of Self Serve Applications Channels Graphics PDF
This slide presents statistics on self service channels used by brands and their approximate cost per contact, helpful in highlighting their effectiveness. It includes web, IVR and live chat. Showcasing this set of slides titled Statistical Analysis Of Self Serve Applications Channels Graphics PDF. The topics addressed in these templates are Customers Web, Cost Per Contact, Large Staffing Hiring. All the content presented in this PPT design is completely editable. Download it and make adjustments in color, background, font etc. as per your unique business setting.
Promotional Campaign Performance Tracking Dashboard For Business Growth Information PDF
This slide represents dashboard showcasing advertising campaign performance progress which helps to manage marketing activities effectively. It provides information regarding total marketing cost, website impressions, content clicks, customer acquisition, cost per campaign etc. Showcasing this set of slides titled Promotional Campaign Performance Tracking Dashboard For Business Growth Information PDF. The topics addressed in these templates are Website Impression, Content Clicks, Customer Acquisition . All the content presented in this PPT design is completely editable. Download it and make adjustments in color, background, font etc. as per your unique business setting.

Dashboard Illustrating Attrition Risk And Expenses Of Employee Attrition Clipart PDF
This slide represents a dashboard that help predict attrition risks and turnover costs incurred by companies. It includes various aspects such as current high risk employees, key prospects at high risk for leaving, cost of turnover, risk by country, etc. Pitch your topic with ease and precision using this Dashboard Illustrating Attrition Risk And Expenses Of Employee Attrition Clipart PDF. This layout presents information on Dashboard Illustrating Attrition Risk, Expenses Of Employee Attrition . It is also available for immediate download and adjustment. So, changes can be made in the color, design, graphics or any other component to create a unique layout.

Display Ad Campaigning Dashboard To Monitor Productivity Infographics PDF
This slide showcases KPI dashboard for display advertising for real- time tracking of key marketing metrices, It includes elements such as cost, clicks, impressions, CTR, conversion rate, CPC, etc. Showcasing this set of slides titled Display Ad Campaigning Dashboard To Monitor Productivity Infographics PDF. The topics addressed in these templates are Cost Per Conversion, Conversions, Ad Impressions. All the content presented in this PPT design is completely editable. Download it and make adjustments in color, background, font etc. as per your unique business setting.
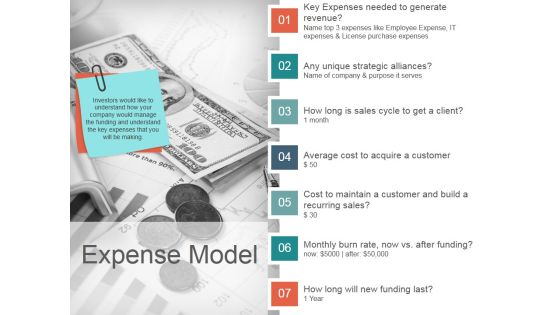
Expense Model Template 2 Ppt PowerPoint Presentation Design Templates
This is a expense model template 2 ppt powerpoint presentation design templates. This is a seven stage process. The stages in this process are strategy, finance, currency, marketing.

Target Marketing Techniques Evaluating Target Market Size For Target Marketing Mockup PDF
This template covers evaluation of target market size for preparing marketing strategies. The purpose of this template is to identify the potential of target market for launching new product or service. Create an editable Target Marketing Techniques Evaluating Target Market Size For Target Marketing Mockup PDF that communicates your idea and engages your audience. Whether you are presenting a business or an educational presentation, pre designed presentation templates help save time. Target Marketing Techniques Evaluating Target Market Size For Target Marketing Mockup PDF is highly customizable and very easy to edit, covering many different styles from creative to business presentations. Slidegeeks has creative team members who have crafted amazing templates. So, go and get them without any delay.

Sales Techniques Playbook MEDDIC Sales Methodology For Client Qualification Download PDF
Sales methodology caters guidelines that assist sales representatives in closing deal with clients. MEDDIC sales methodology is client qualification process for complex and enterprise sales. MEDDIC comprise of metrics, economic buyer, decision criteria, decision process, identify pain and champion. Deliver and pitch your topic in the best possible manner with this sales techniques playbook meddic sales methodology for client qualification download pdf Use them to share invaluable insights on determine economic impact of product, ensure engagement of financial, comparative assessment and impress your audience. This template can be altered and modified as per your expectations. So, grab it now.

Business Framework Organization Chart In PowerPoint PowerPoint Presentation
This image slide has been designed with business man icons to display organization chart. Use this image slide, in your presentations to depict business management designations. This image slide will enhance the quality of your presentations.
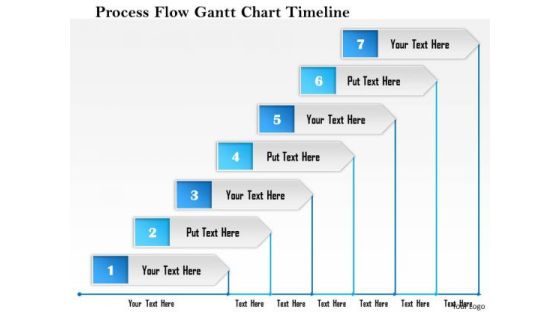
Business Framework Process Flow Gantt Chart Timeline PowerPoint Presentation
This Power point template slide has been designed with graphic of Gantt chart. This PPT slide contains the concept of process flow. Use this PPT slide for your business process related topics.
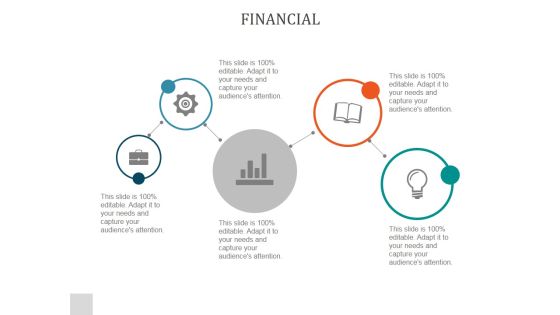
Financial Ppt PowerPoint Presentation Samples
This is a financial ppt powerpoint presentation samples. This is a six stage process. The stages in this process are business, finance, marketing, icons, strategy.

Stacked Bar Template 2 Ppt PowerPoint Presentation Deck
This is a stacked bar template 2 ppt powerpoint presentation deck. This is a two stage process. The stages in this process are business, strategy, analysis, marketing, finance.

100 Stacked Bar Ppt PowerPoint Presentation Slides Skills
This is a 100 stacked bar ppt powerpoint presentation slides skills. This is a four stage process. The stages in this process are business, marketing, bar, finance, strategy.

Clustered Bar Ppt PowerPoint Presentation Infographic Template Guidelines
This is a clustered bar ppt powerpoint presentation infographic template guidelines. This is a four stage process. The stages in this process are business, marketing, bar, finance, strategy.

Bar Graph Ppt PowerPoint Presentation File Tips
This is a bar graph ppt powerpoint presentation file tips. This is a twelve stage process. The stages in this process are business, marketing, finance, graph, strategy.

Competitive Analysis Ppt PowerPoint Presentation Summary Model
This is a competitive analysis ppt powerpoint presentation summary model. This is a six stage process. The stages in this process are business, marketing, strategy, bar, finance.

Current Quarter Portfolio Ppt PowerPoint Presentation Summary Ideas
This is a current quarter portfolio ppt powerpoint presentation summary ideas. This is a two stage process. The stages in this process are business, marketing, bar, finance, strategy.
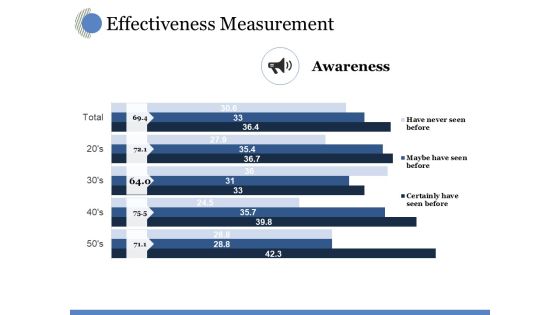
Effectiveness Measurement Ppt PowerPoint Presentation Inspiration Guide
This is a effectiveness measurement ppt powerpoint presentation inspiration guide. This is a five stage process. The stages in this process are awareness, business, marketing, strategy, finance.

Effectiveness Measurement Ppt PowerPoint Presentation Styles Ideas
This is a effectiveness measurement ppt powerpoint presentation styles ideas. This is a five stage process. The stages in this process are awareness, business, marketing, finance, strategy.

Clustered Bar Ppt PowerPoint Presentation Model Visual Aids
This is a clustered bar ppt powerpoint presentation model visual aids. This is a three stage process. The stages in this process are business, marketing, strategy, graph, finance.

Clustered Bar Ppt PowerPoint Presentation Pictures Display
This is a clustered bar ppt powerpoint presentation pictures display. This is a two stage process. The stages in this process are clustered bar, finance, marketing, strategy, business.

Bar Diagram Ppt PowerPoint Presentation Show Maker
This is a bar diagram ppt powerpoint presentation show maker. This is a seven stage process. The stages in this process are bar graph, finance, marketing, strategy, business.

Financial Ppt Powerpoint Presentation Ideas Example
This is a financial ppt powerpoint presentation ideas example. This is a three stage process. The stages in this process are business, finance, analysis, marketing, strategy.

Stacked Bar Ppt PowerPoint Presentation Professional Designs
This is a stacked bar ppt powerpoint presentation professional designs. This is a four stage process. The stages in this process are stacked bar, finance, marketing, strategy, business.

Clustered Bar Ppt PowerPoint Presentation Slides Show
This is a clustered bar ppt powerpoint presentation slides show. This is a three stage process. The stages in this process are finance, analysis, business, strategy, marketing.

Clustered Bar Ppt PowerPoint Presentation Infographic Template Grid
This is a clustered bar ppt powerpoint presentation infographic template grid. This is a two stage process. The stages in this process are finance, analysis, marketing, business, strategy.

Financial Ppt PowerPoint Presentation Model Maker
This is a financial ppt powerpoint presentation model maker. This is a three stage process. The stages in this process are finance, business, marketing, strategy, analysis.

Stacked Line Ppt PowerPoint Presentation File Objects
This is a stacked line ppt powerpoint presentation file objects. This is a three stage process. The stages in this process are stacked line, finance, marketing, strategy, business.

Stacked Bar Ppt PowerPoint Presentation Layouts Model
This is a stacked bar ppt powerpoint presentation layouts model. This is a two stage process. The stages in this process are stacked bar, finance, marketing, strategy, business.

Clustered Column Ppt PowerPoint Presentation Summary Show
This is a clustered column ppt powerpoint presentation summary show. This is a two stage process. The stages in this process are finance, marketing, business, graph, strategy.

Stacked Line Ppt PowerPoint Presentation Summary Themes
This is a stacked line ppt powerpoint presentation summary themes. This is a three stage process. The stages in this process are business, marketing, strategy, management, finance.

Clustered Bar Ppt PowerPoint Presentation Ideas Information
This is a clustered bar ppt powerpoint presentation ideas information. This is a three stage process. The stages in this process are clustered bar, finance, marketing, strategy, analysis.

Clustered Bar Ppt PowerPoint Presentation Slides Gallery
This is a clustered bar ppt powerpoint presentation slides gallery. This is a two stage process. The stages in this process are clustered bar, business, finance, marketing, strategy.

Clustered Column Ppt PowerPoint Presentation Icon Demonstration
This is a clustered column ppt powerpoint presentation icon demonstration. This is a two stage process. The stages in this process are clustered column, finance, marketing, strategy, business.

Shareholding Pattern Ppt PowerPoint Presentation Slides Model
This is a shareholding pattern ppt powerpoint presentation slides model. This is a two stage process. The stages in this process are business, compare, finance, marketing, strategy.

Stacked Bar Ppt PowerPoint Presentation Pictures Slides
This is a stacked bar ppt powerpoint presentation pictures slides. This is a two stage process. The stages in this process are business, marketing, graph, finance, strategy.

Clustered Column Ppt PowerPoint Presentation Gallery Graphics
This is a clustered column ppt powerpoint presentation gallery graphics. This is a two stage process. The stages in this process are clustered column, finance, marketing, strategy, business.

Clustered Column Ppt PowerPoint Presentation Ideas Format Ideas
This is a clustered column ppt powerpoint presentation ideas format ideas. This is a two stage process. The stages in this process are business, marketing, graph, finance, strategy.

Income Statement Overview Ppt PowerPoint Presentation Model Example
This is a income statement overview ppt powerpoint presentation model example. This is a five stage process. The stages in this process are business, finance, marketing, strategy, analysis.

Stacked Line Ppt PowerPoint Presentation File Guidelines
This is a stacked line ppt powerpoint presentation file guidelines. This is a three stage process. The stages in this process are in percentage, business, marketing, finance, strategy.

Cash Flow Statement Kpis Ppt PowerPoint Presentation Clipart
This is a cash flow statement kpis ppt powerpoint presentation clipart. This is a four stage process. The stages in this process are business, marketing, finance, graph, strategy.

Activity Ratios Ppt PowerPoint Presentation Slides Layout
This is a activity ratios ppt powerpoint presentation slides layout. This is a two stage process. The stages in this process are business, finance, analysis, strategy, marketing.
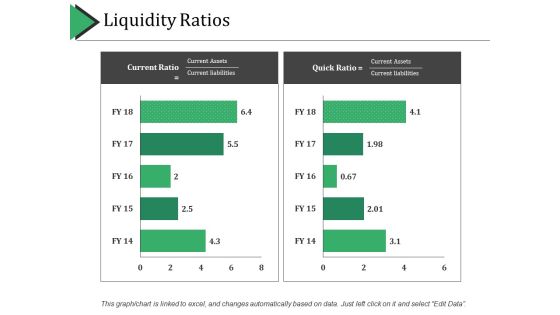
Liquidity Ratios Ppt PowerPoint Presentation Professional Ideas
This is a liquidity ratios ppt powerpoint presentation professional ideas. This is a two stage process. The stages in this process are business, finance, marketing, strategy, analysis.
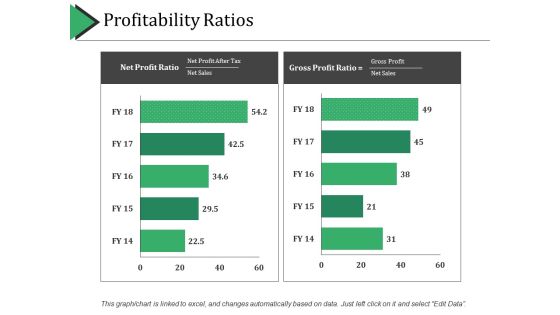
Profitability Ratios Ppt PowerPoint Presentation Layouts Gridlines
This is a profitability ratios ppt powerpoint presentation layouts gridlines. This is a two stage process. The stages in this process are business, finance, marketing, strategy, analysis.
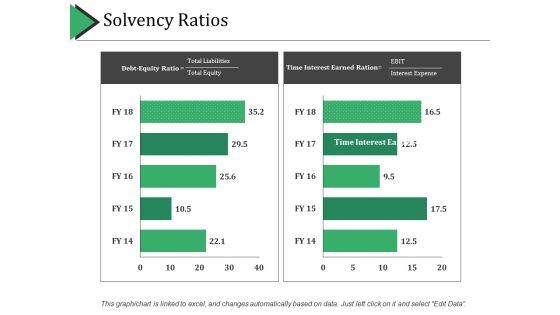
Solvency Ratios Ppt PowerPoint Presentation Professional Summary
This is a solvency ratios ppt powerpoint presentation professional summary. This is a two stage process. The stages in this process are solvency ratios, finance, marketing, strategy, business.
Stacked Bar Ppt PowerPoint Presentation Icon Objects
This is a stacked bar ppt powerpoint presentation icon objects. This is a two stage process. The stages in this process are stacked bar, finance, analysis, marketing, strategy.

Demand Statistics Ppt PowerPoint Presentation Pictures Slides
This is a demand statistics ppt powerpoint presentation pictures slides. This is a four stage process. The stages in this process are business, marketing, years, finance, strategy.
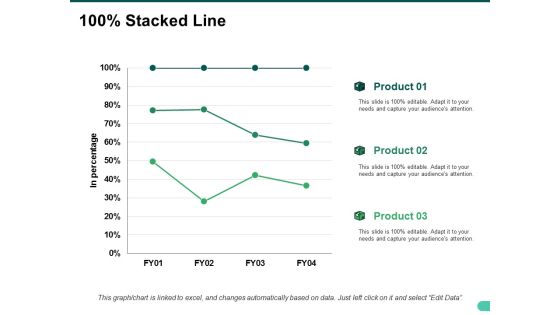
Stacked Line Ppt PowerPoint Presentation Slides Show
This is a stacked line ppt powerpoint presentation slides show. This is a three stage process. The stages in this process are in percentage, business, marketing, strategy, finance.
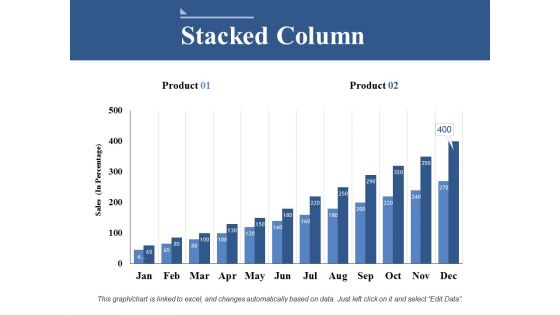
Stacked Column Ppt PowerPoint Presentation Model Information
This is a stacked column ppt powerpoint presentation model information. This is a two stage process. The stages in this process are business, sales, marketing, finance, strategy.

Bar Graph Ppt PowerPoint Presentation Layouts Portrait
This is a bar graph ppt powerpoint presentation layouts portrait. This is a three stage process. The stages in this process are bar graph, finance, marketing, strategy, business.

Bar Graph Ppt PowerPoint Presentation File Display
This is a bar graph ppt powerpoint presentation file display. This is a four stage process. The stages in this process are bar graph, marketing, strategy, finance, analysis.

Bar Graph Ppt PowerPoint Presentation Professional Background
This is a bar graph ppt powerpoint presentation professional background. This is a two stage process. The stages in this process are bar graph, finance, marketing, strategy, business.

Clustered Bar Ppt PowerPoint Presentation Pictures Guidelines
This is a clustered bar ppt powerpoint presentation pictures guidelines. This is a three stage process. The stages in this process are clustered bar, finance, marketing, strategy, business.

Clustered Bar Ppt PowerPoint Presentation Diagram Templates
This is a clustered bar ppt powerpoint presentation diagram templates. This is a three stage process. The stages in this process are business, marketing, unit count, finance, strategy.
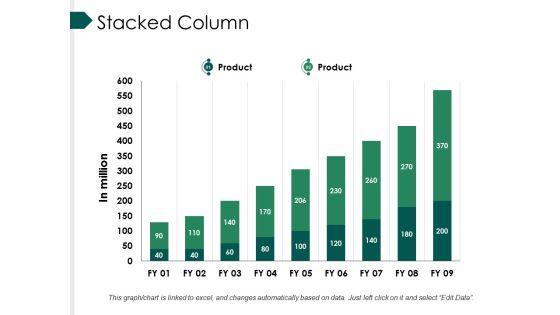
Stacked Column Ppt PowerPoint Presentation Professional Infographics
This is a stacked column ppt powerpoint presentation professional infographics. This is a nine stage process. The stages in this process are bar, marketing, strategy, finance, teamwork.

Bar Graph Ppt PowerPoint Presentation Layouts Backgrounds
This is a bar graph ppt powerpoint presentation layouts backgrounds. This is a one stage process. The stages in this process are business, marketing, finance, bar graph, strategy.

Statistics Results Ppt PowerPoint Presentation Gallery Graphics Pictures
This is a statistics results ppt powerpoint presentation gallery graphics pictures. This is a two stage process. The stages in this process are business, finance, marketing, strategy, analysis.

Predictive Analytics Benefits Ppt PowerPoint Presentation Professional Samples
This is a predictive analytics benefits ppt powerpoint presentation professional samples. This is a five stage process. The stages in this process are business, finance, marketing, strategy, analysis.


 Continue with Email
 Sign up for an account
 Home
Home