Resource Mapping
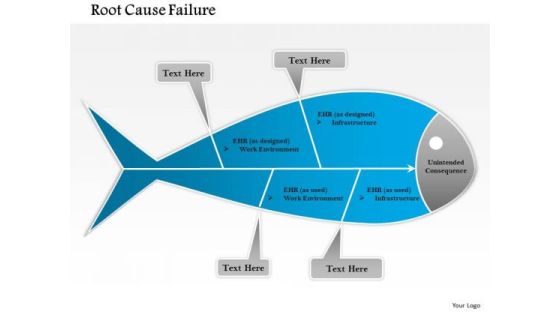
Business Framework Root Cause Failure PowerPoint Presentation
Use this fish bone diagram to explain root cause failure. Use this diagram in your presentation and make it more effective. This pre designed high quality business diagram will make your presentation simply the best.

Business Framework Sales Force Sizing PowerPoint Presentation
This diagrams displays graphical representations of sales force sizing. Optimizing size and structure of your sales force is important to overall business success. Make interactive presentations with this slide.

Business Framework Sales Pipeline Tool PowerPoint Presentation
This sales pipeline tool diagram can be used to prepare a business presentation or sales strategy presentation. This pipeline diagrams to represent sales pipeline tools. Use this professional and customized business diagram for PowerPoint.

Business Framework Sales Planning Tools PowerPoint Presentation
This sales planning tool diagram can be used to prepare a business presentation or sales strategy presentation. This diagrams represent sales planning tools. Use this professional and customized business diagram for PowerPoint.

Business Framework Scientific Management Model PowerPoint Presentation
Our above diagram represents model of scientific management. This circular diagram displays concepts of scientific management. Use this professional and customized business diagram for PowerPoint.

Business Framework Scientific Management PowerPoint Presentation
Our above diagram represents model of scientific management. This circular diagram displays concepts of scientific management. Use this professional and customized business diagram for PowerPoint.
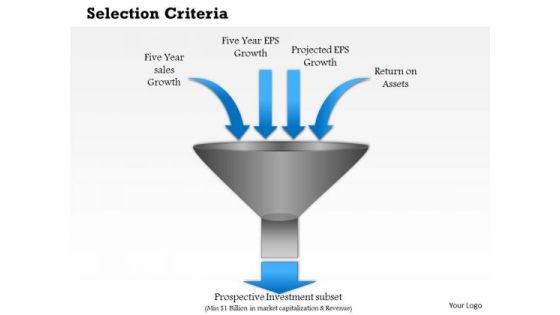
Business Framework Selection Criteria PowerPoint Presentation
This funnel diagram represents selection criteria and sales growth. You can use this funnel diagram in business and sales related presentations. Use this professional and customized business diagram for PowerPoint.

Business Framework Seo Value Proposition 4 Layers PowerPoint Presentation
Download this business diagram to give presentations on search engine optimization. Above diagram displays SEO value proposition with 4 layers. Use this professional and customized business diagram for PowerPoint.
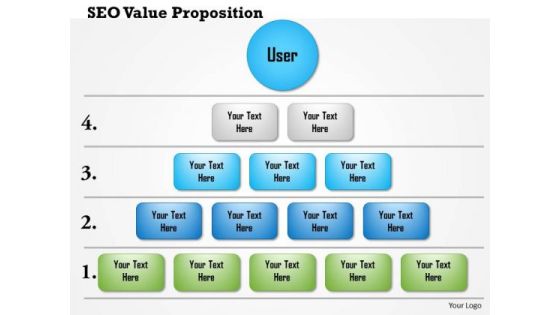
Business Framework Seo Value Proposition 5 Layers PowerPoint Presentation
Download this business diagram to give presentations on search engine optimization. Above diagram displays SEO value proposition with 5 layers. Use this professional and customized business diagram for PowerPoint.
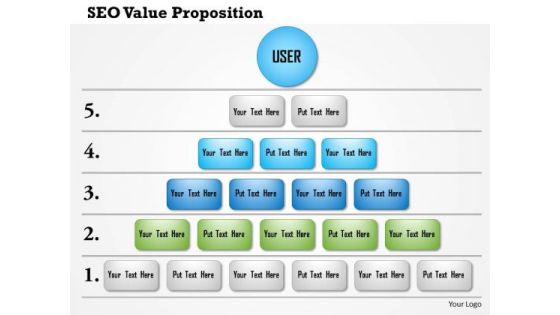
Business Framework Seo Value Proposition 6 Layers PowerPoint Presentation
Download this business diagram to give presentations on search engine optimization. Above diagram displays SEO value proposition with 6 layers. Use this professional and customized business diagram for PowerPoint.
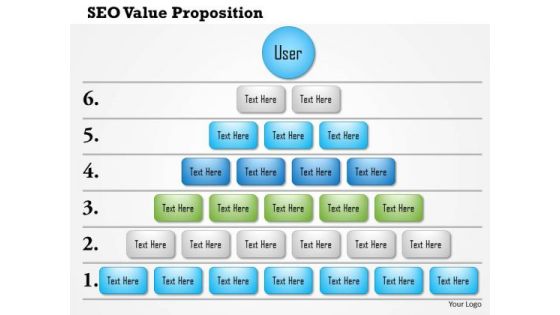
Business Framework Seo Value Proposition 7 Layers PowerPoint Presentation
Download this business diagram to give presentations on search engine optimization. Above diagram displays SEO value proposition with 7 layers. Use this professional and customized business diagram for PowerPoint.
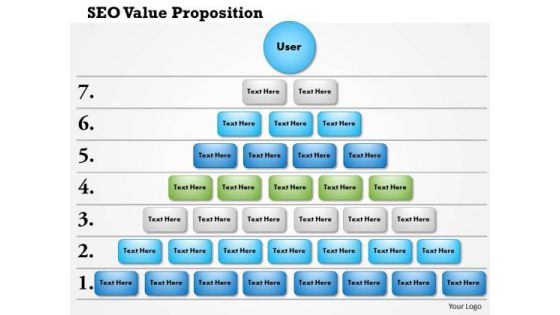
Business Framework Seo Value Proposition 8 Layers PowerPoint Presentation
Download this business diagram to give presentations on search engine optimization. Above diagram displays SEO value proposition with 8 layers. Use this professional and customized business diagram for PowerPoint.
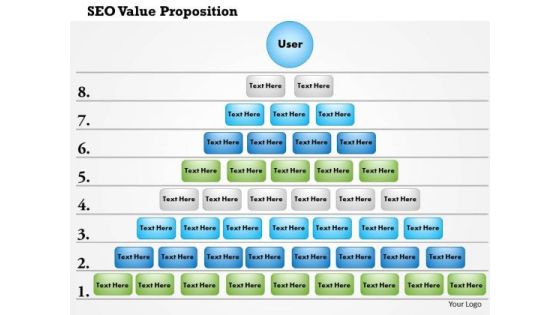
Business Framework Seo Value Proposition 9 Layers PowerPoint Presentation
Download this business diagram to give presentations on search engine optimization. Above diagram displays SEO value proposition with 9 layers. Use this professional and customized business diagram for PowerPoint.
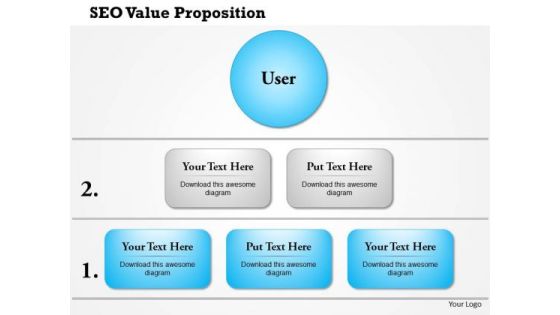
Business Framework Seo Value Proposition PowerPoint Presentation
Download this business diagram to give presentations on search engine optimization. Above diagram displays SEO value proposition. Use this professional and customized business diagram for PowerPoint.
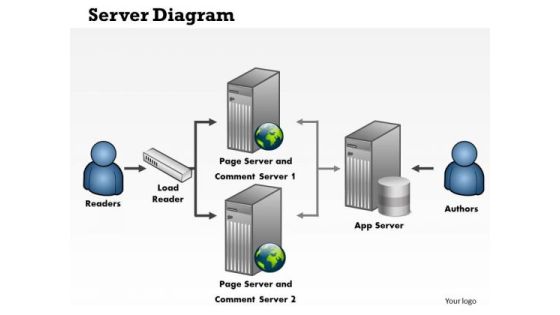
Business Framework Server Diagram PowerPoint Presentation
This business diagram displays framework of servers. Use this professional diagram in technology and network related topics. Make interactive presentations with this slide.
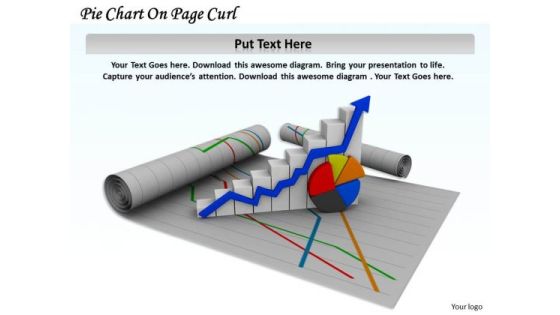
Stock Photo Pie Chart On Page Curl Arrow PowerPoint Slide
This image slide displays pie chart and growth bar graph on page curl. Use this image slide, in your presentations to express views on progress, growth and achievements. This image slide may also be used to depict strategic business planning. Make professional presentations using this image slide.

Stock Photo Pie Chart On Page Curl PowerPoint Slide
This image slide displays pie chart and growth bar graph on page curl on blue shaded background. Use this image slide, in your presentations to express views on progress, growth and achievements. This image slide may also be used to depict strategic business planning. Make professional presentations using this image slide.
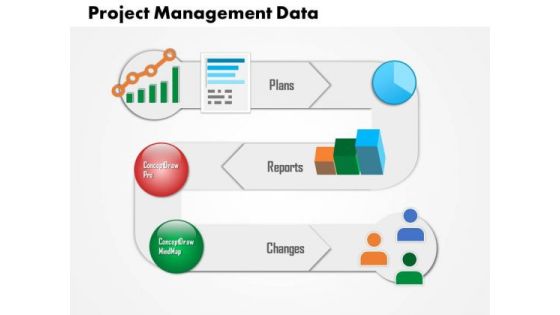
Business Diagram Project Management Data PowerPoint Ppt Presentation
This slide provides diagram for project management data. It contains spiral diagram with icons depicting plans reports and changes. Download this awesome diagram to capture your audiences attention.
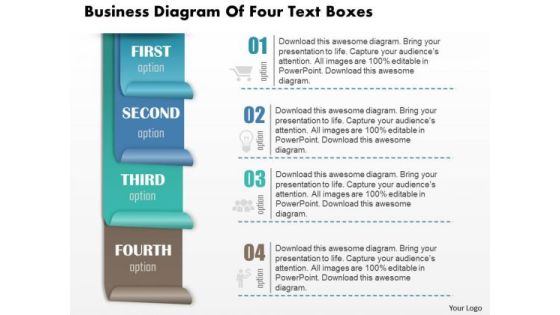
Business Diagram Of Four Text Boxes Presentation Template
We present you the image slide of business consulting diagram of four colorful text boxes. This image slide depicts processes. Use this PowerPoint template, in your presentations to express views on planning, management, achievements, targets etc. This image slide will make your presentations colorful.

Business Diagram Percentage Pie Chart On Computer Tablet Presentation Template
This image slide displays business consulting diagram of percentage pie chart on computer tablet. This image has been made with 3d colorful graphic of pie chart on black tablet. Use this PowerPoint template, in your presentations to express various views like growth, achievements, success in business. This image slide will make your presentations outshine.

Business Diagram Pie Chart Showing Percentages Presentation Template
This image slide displays business consulting diagram of pie chart showing percentage. Pie Charts can be used to display a wide variety of information. When data is represented in the form of a pie chart the human eye finds it very easy to compare the data and quickly draw conclusions. In short they are a great visual aid and will add a touch of professionalism to any presentation which requires the display of data.
Business Diagram Rectangle Showing Four Steps With Icons Presentation Template
This image slide displays 3d colorful graphic of rectangle showing four steps. This image slide has been made with 3d graphic of rectangle with envelope shape on all sides with symbols in center. Use this PowerPoint template, in your presentations to express views on growth, target, management and planning in any business. All text and graphic are editable in this image slide. This image slide will make your presentations colorful.
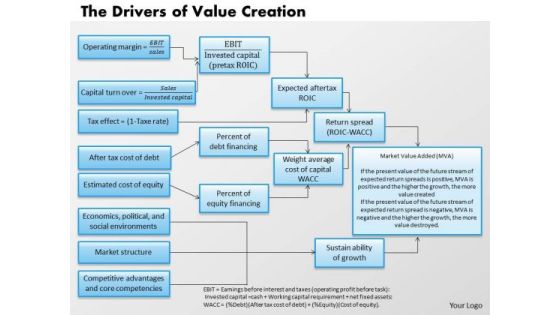
Business Framework The Drivers Of Value Creation PowerPoint Presentation
Above diagram provides framework for the drivers of value creation. It contains flow-chart depicting formula and steps for value creation. Use this professional and customized business diagram for PowerPoint presentations.

Business Diagram Business Step Process Diagram PowerPoint Ppt Presentation
This slide has been designed with business step process diagram. Use this diagram to displays steps of business process. Make amazing presentations with this diagram.

Stock Photo Smartphone Shopping Cart Credit Card PowerPoint Slide
This image slide is designed with graphics of smart phone with credit card. This image depicts shopping through mobile apps. You may use this layout to display your content in an interesting, eye-catching manner.

Business Diagram Business Man With Debt Info Graphic Presentation Template
This template has graphics of 3d man falling down with heavy debt stone. This professional diagram signifies the concept of loss, struggle, and debt burden etc. Download this awesome diagram to capture your audiences attention.

Business Diagram Arrangement Of Business Steps And Text Boxes Presentation Template
This image slide displays business consulting diagram of arrangement of business steps and textboxes. In this slide, there is graphic of alphabetic colorful textboxes with different icons in steps. This image slide depicts planning. Use this PowerPoint template, in your presentations to express growth, teamwork and planning in business. This image slide will make your presentations attractive.
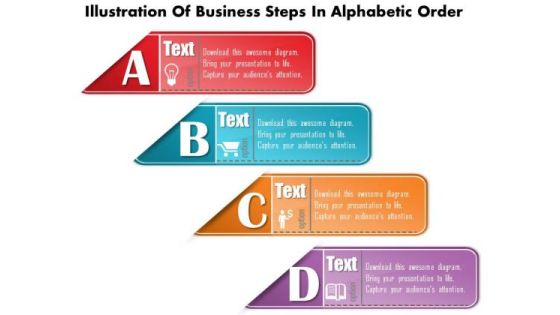
Business Diagram Illustration Of Business Steps In Alphabetic Order Presentation Template
This image slide displays business consulting diagram illustration of business steps in alphabetic order. This image slide depicts stepwise process. Use this PowerPoint template, in your presentations to express views on various business activities. This image slide will make your presentations colorful.

Business Diagram Bar Graph For Result Display On Mobile Presentation Template
This Power Point template has been designed with graphic of bar graph on mobile phone. This business diagram can be used to make business reports. Download this Power Point slide to build quality presentation for your viewers.
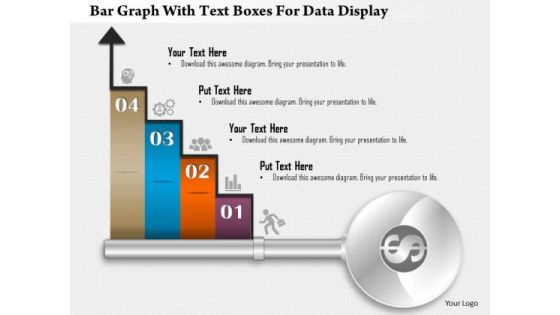
Business Diagram Bar Graph With Text Boxes For Data Display Presentation Template
Our above business diagram displays bar graph. It contains four steps on bar graph with icons. Use this diagram to display four stages of business growth. Download this Power Point slide to build quality presentation for your viewers.
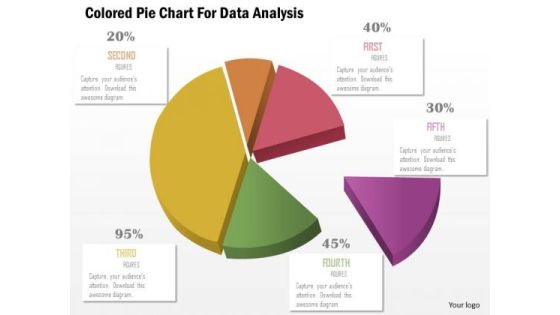
Business Diagram Colored Pie Chart For Data Analysis Presentation Template
This business slide displays pie chart. This diagram is a data visualization tool that gives you a simple way to present statistical information. This slide helps your audience examine and interpret the data you present.
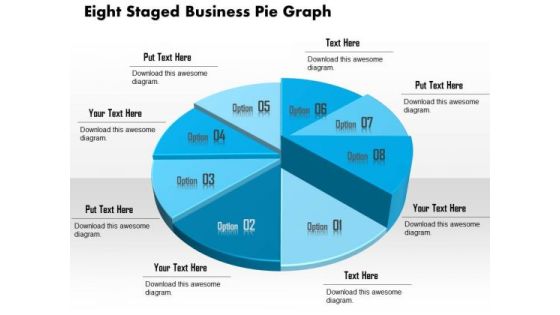
Business Diagram Eight Staged Business Pie Graph Presentation Template
This business slide displays eight staged pie chart. This diagram is a data visualization tool that gives you a simple way to present statistical information. This slide helps your audience examine and interpret the data you present.
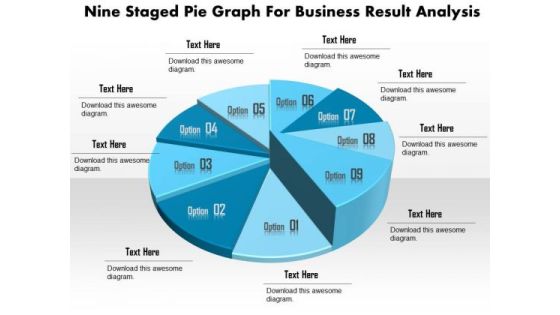
Business Diagram Nine Staged Pie Graph For Business Result Analysis Presentation Template
This business slide displays nine staged pie chart. This diagram is a data visualization tool that gives you a simple way to present statistical information. This slide helps your audience examine and interpret the data you present.

Stock Photo Dollars Covered With Lock And Chain PowerPoint Slide
This Power Point image template has been designed with graphic of dollar and chain. In this image dollar is covered with chain which shows the concept of safety. Use this image template financial security related presentations.
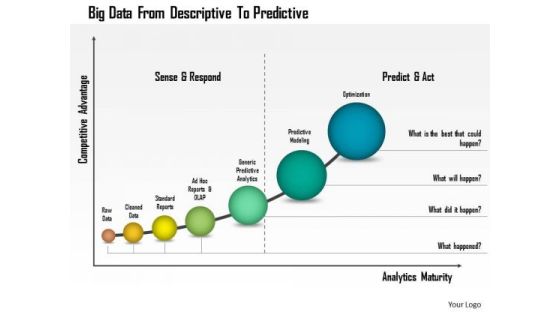
Business Diagram Big Data From Descriptive To Predictive Presentation Template
This business diagram has been designed with graphic of linear bar graph. This growing bar graph depicts the concept of big data analysis. Use this professional diagram for your financial and business analysis.
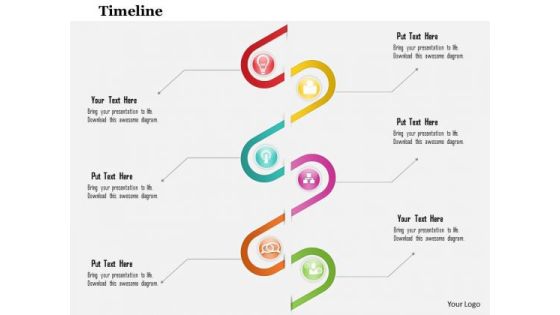
Business Diagram Six Staged Spiral Diagram For Data Flow Presentation Template
This business slide depicts six staged spiral diagram. This diagram provides an effective way of displaying information you can edit text, color, shade and style as per you need. Present your views using this innovative slide and be assured of leaving a lasting impression.
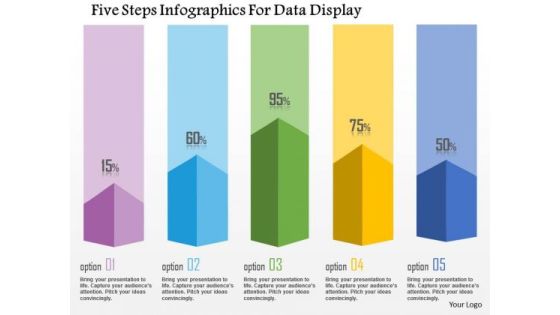
Business Diagram Five Steps Infographics For Data Display Presentation Template
This business diagram has been designed with graphic of five staged info graphics. This diagram can be used to display statistical information. Use this bar graph for your business and sales related presentations.
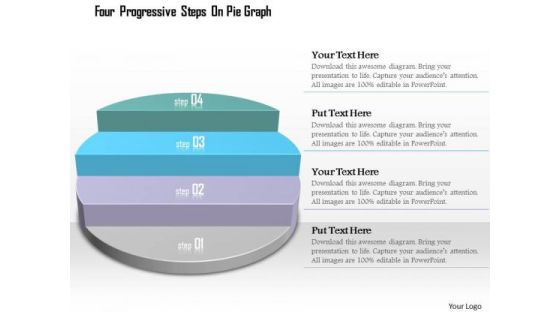
Business Diagram Four Progressive Steps On Pie Graph Presentation Template
This diagram displays progressive steps on pie chart. It contains graphic of pie graph with four steps. Use this diagram, in your presentations to express views on process, steps, stages, progress, targets, goals, success and achievements. Give professional appearance to your presentations using this business slide.

Business Diagram Compass With Multiple Business Plan Presentation Template
This power point template has been designed with graphic of compass. This PPT contains the concept of making business plans. Use this PPT for business and management related presentations.
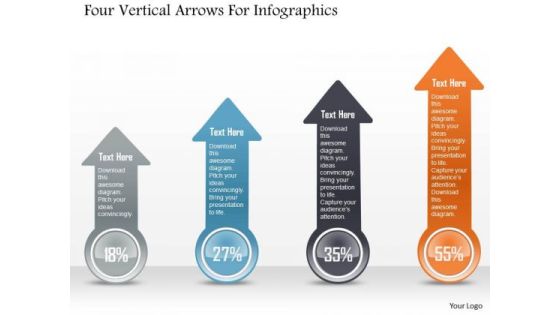
Business Diagram Four Vertical Arrows For Infographics PowerPoint Template
Four vertical arrows are used to craft this power point template. This PPT slide contains the concept of information representation. Display your information in any presentation with this professional PPT slide.
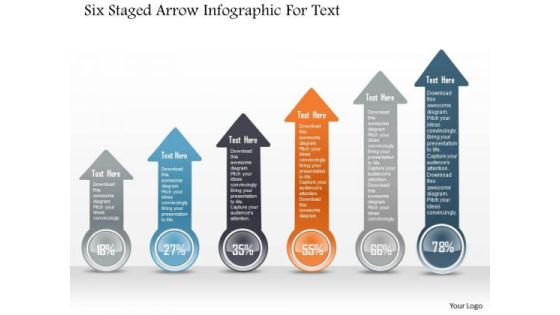
Business Diagram Six Staged Arrow Infographic For Text PowerPoint Template
Six staged colored arrow info graphics diagram has been used to craft this power point template. This PPT contains the concept of business process flow and information representation. Display any process flow in your presentation with this professional PPT slide.
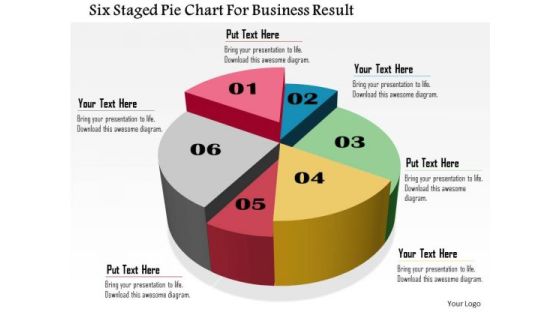
Business Daigram Six Staged Pie Chart For Business Result Presentation Templets
Six staged pie chart is used to design this business slide. Download this diagram to make business and financial reports. Use our above diagram to express information in a visual way.

Business Diagram Pencils For 4 Financial Statements Presentation Template
Emphatically define your message with this slide which contains a graphic of pencils. Above image may be used to display four financial statements. Use this slide to build exclusive presentations for your viewers.
Business Diagram Pie Chart With Icons For Financial Analysis Presentation Template
This professional business diagram slide has been designed with pie chart and icons. It contains concept of financial analysis. Use this slide to build exclusive presentations for your viewers.
Business Diagram Steps With Icons For Success Presentation Template
This business slide displays icons on stairs. Use this diagram slide, in your presentations to depict growth and progress steps. Make your presentations outshine using this professional slide.
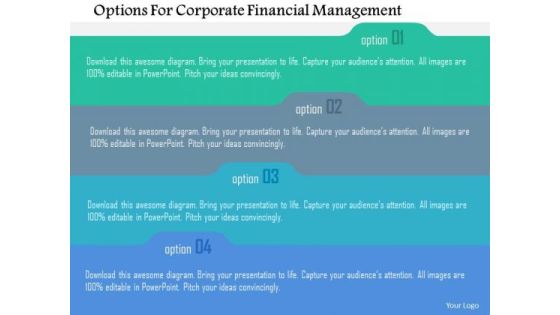
Business Diagram Options For Corporate Financial Management Presentation Template
This diagram contains list of four options. Download this diagram slide to display corporate financial management. This diagram provides an effective way of displaying information you can edit text, color, shade and style as per you need.

Business Diagram Six Options In Pyramid Presentation Template
Sales process can be explained with this pyramid diagram. This diagram contains the graphic of pyramid chart with six options. This diagram provides an effective way of displaying information.

Stock Photo Bar Graph With Growth Arrow PowerPoint Slide
This creative image displays design of Bar Graph with Growth Arrow. This image has been designed to depict business on an Upward Trend. Create an impact with this quality image and make professional presentations.
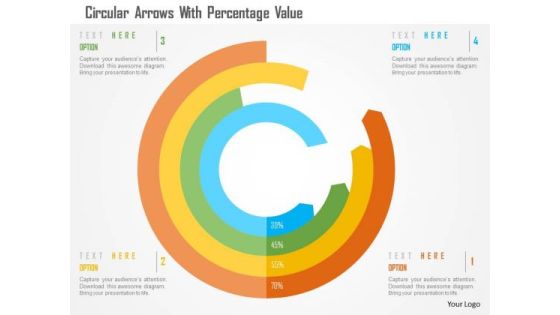
Business Diagram Circular Arrows With Percentage Value Presentation Template
This business slide has been designed with circular arrows. You may download this diagram to display percentage growth data. This template is innovatively designed to highlight your worthy views
Business Diagram Cloud Icon For Data Storage Presentation Template
Concept of cloud computing and data storage has been defined in this power point template. This business diagram contains the graphic of clouds. Use this diagram for business and technology related presentations.

Business Diagram Folders For Financial Review Presentation Template
This business diagram has been designed with graphics of colored folders. You may download this slide for financial review. Use this slide to create an impact on your viewers.
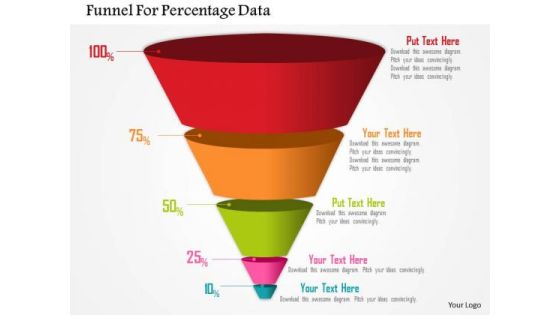
Business Diagram Funnel For Percentage Data Presentation Template
Four staged funnel diagram has been used to design this power point template. This diagram contains the concept of filtration. Present your views and ideas with this impressive image.
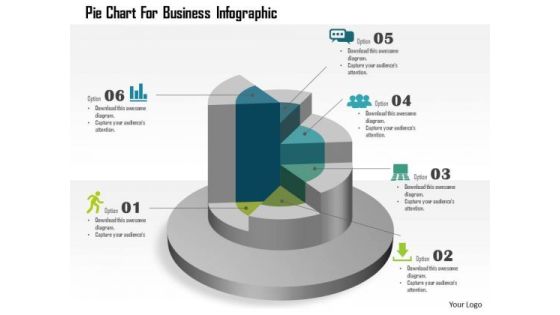
Business Diagram Pie Chart For Business Infographic Presentation Template
This template displays pie chart business infographic. You may download this business slide for result analysis. Amplify your thoughts via this appropriate business template.
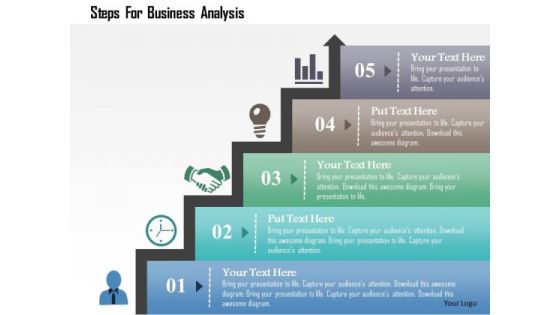
Business Diagram Steps For Business Analysis Presentation Template
Concept of time management has been defined in this power point template diagram. This diagram contains the graphic of bar graph. Amplify your thoughts via this appropriate business template.

Business Diagram Pencil Graph For Statistics Presentation Template
The above template contains graphics of pencil graph. This diagram may be used to display statistical information. This diagram slide will
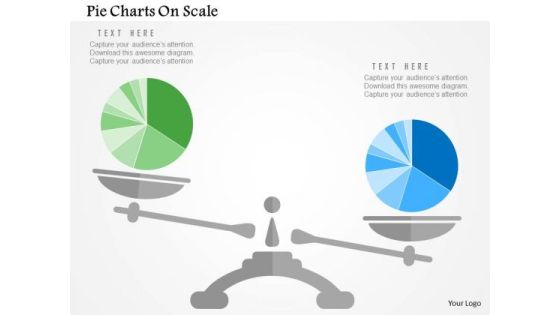
Business Diagram Pie Charts On Scale Presentation Template
Our above slide display graphics of pie chart on a scale. Download this diagram slide to display competitive analysis of business. Adjust the above diagram in your business presentations to visually support your content.

Business Diagram Bar Graph For Growth And Progress Presentation Template
This business slide has been designed with graphics of bar chart. You may download this diagram to display concepts like growth, progress and success in business. Download this diagram slide to make impressive presentations.

Business Diagram Bars For Profit Percentages Presentation Template
Download this exclusive business diagram to present profit in percentage ratio. This slide contains the graphic of bars. This diagram can be useful for business presentations.
Business Diagram Icons Around Pie Chart Presentation Template
Strategy and planning can be displayed with this business diagram. This slide contains the graphic of icons around pie chart Use this editable slide to build quality presentation for your viewers.
Circles With Icons For Communication PowerPoint Template
The above template displays a diagram of circles with icons. This diagram has been professionally designed to emphasize on concept of competitive strategy. Grab centre stage with this slide. Capture the attention of your audience.
 Home
Home