Resource Mapping
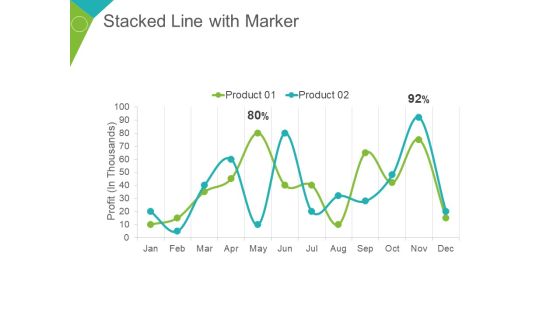
Stacked Line With Marker Ppt PowerPoint Presentation Summary Demonstration
This is a stacked line with marker ppt powerpoint presentation summary demonstration. This is a two stage process. The stages in this process are profit in thousands, product, percentage, finance, business.

Midstream Organic Growth Ppt PowerPoint Presentation Slides Good
This is a midstream organic growth ppt powerpoint presentation slides good. This is a three stage process. The stages in this process are midstream organic growth, category, finance, percentage, business.
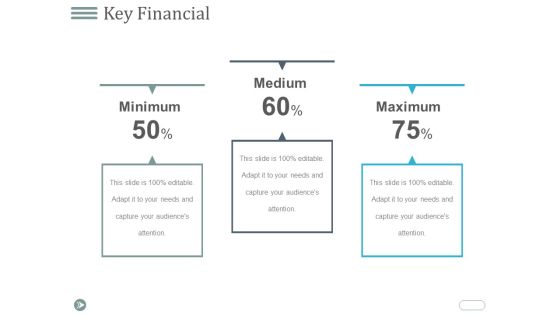
Key Financial Ppt PowerPoint Presentation Summary Example Topics
This is a key financial ppt powerpoint presentation summary example topics. This is a three stage process. The stages in this process are minimum, medium, maximum, finance, business, percentage.

Gap Between Current And Required Staff Ppt PowerPoint Presentation Ideas Format Ideas
This is a gap between current and required staff ppt powerpoint presentation ideas format ideas. This is a five stage process. The stages in this process are number of staff, category, current, graph, finance.
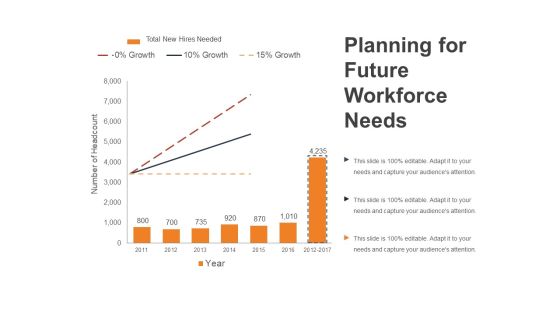
Planning For Future Workforce Needs Ppt PowerPoint Presentation Outline Smartart
This is a planning for future workforce needs ppt powerpoint presentation outline smartart. This is a three stage process. The stages in this process are growth, percentage, number of headcount, year, finance.
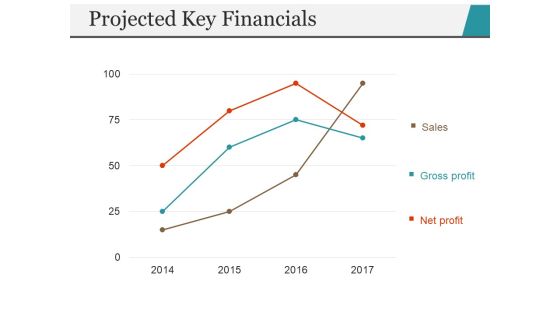
Projected Key Financials Template 2 Ppt PowerPoint Presentation Portfolio Inspiration
This is a projected key financials template 2 ppt powerpoint presentation portfolio inspiration. This is a three stage process. The stages in this process are sales, gross profit, net profit, year, finance.

Demand Forecasting Ppt PowerPoint Presentation Outline Model
This is a demand forecasting ppt powerpoint presentation outline model. This is a one stage process. The stages in this process are demand quality, dynamic demand, stable demand, trend, finance.

Scatter With Smooth Lines And Markers Ppt PowerPoint Presentation Visual Aids Ideas
This is a scatter with smooth lines and markers ppt powerpoint presentation visual aids ideas. This is a nine stage process. The stages in this process are product, profit, dollar, business, finance.

Scatter Bubble Chart Ppt PowerPoint Presentation Infographic Template Examples
This is a scatter bubble chart ppt powerpoint presentation infographic template examples. This is a two stage process. The stages in this process are highest sale, product, in price, finance, business.
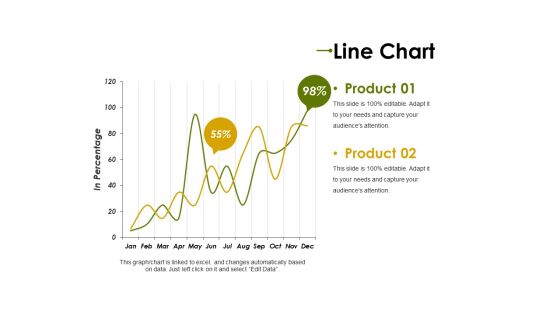
Line Chart Ppt PowerPoint Presentation Professional Clipart Images
This is a line chart ppt powerpoint presentation professional clipart images. This is a two stage process. The stages in this process are product, in percentage, graph, percentage, finance, business.

Area Chart Ppt PowerPoint Presentation Show Templates
This is a area chart ppt powerpoint presentation show templates. This is a two stage process. The stages in this process are product, in percentage, in years, finance, graph.

Bar Chart Ppt PowerPoint Presentation Outline Guidelines
This is a bar chart ppt powerpoint presentation outline guidelines. This is a four stage process. The stages in this process are product, unit count, in years, graph, finance, business.

Clustered Column Ppt PowerPoint Presentation Portfolio Smartart
This is a clustered column ppt powerpoint presentation portfolio smartart. This is a two stage process. The stages in this process are financial year, product, sales in percentage, finance, business, graph.
Open High Low Close Ppt PowerPoint Presentation Icon Model
This is a open high low close ppt powerpoint presentation icon model. This is a five stage process. The stages in this process are high, low, product, business, finance.
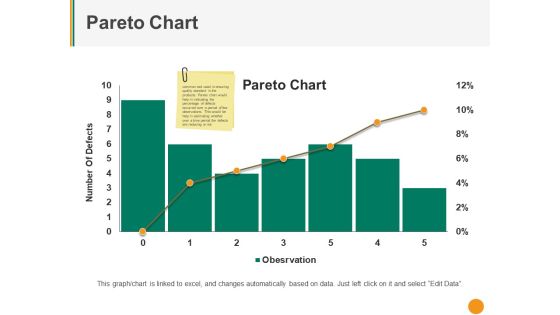
Pareto Chart Ppt PowerPoint Presentation Inspiration Master Slide
This is a pareto chart ppt powerpoint presentation inspiration master slide. This is a six stage process. The stages in this process are number of defects, pareto chart, finance, business, graph.

Scatter Chart Ppt PowerPoint Presentation Summary Visuals
This is a scatter chart ppt powerpoint presentation summary visuals. This is a eight stage process. The stages in this process are product, profit in sales, in percentage, finance, business.

Stock Chart Ppt PowerPoint Presentation Summary File Formats
This is a stock chart ppt powerpoint presentation summary file formats. This is a five stage process. The stages in this process are high, volume, low, business, graph, finance.
Traction Ppt PowerPoint Presentation Icon Example Introduction
This is a traction ppt powerpoint presentation icon example introduction. This is a three stage process. The stages in this process are any coverage in articles news, company s logo, growing fast, generating good revenues, business, finance.

Project Management Gantt Chart Template 1 Ppt PowerPoint Presentation Gallery Graphics Template
This is a project management gantt chart template 1 ppt powerpoint presentation gallery graphics template. This is a two stage process. The stages in this process are start, duration, complete, business, finance.

Revenue Splitby Product And Segment Ppt PowerPoint Presentation Styles Example File
This is a revenue splitby product and segment ppt powerpoint presentation styles example file. This is a two stage process. The stages in this process are revenue by product, revenue by segment, finance, strategy, business.

Bar Chart Ppt PowerPoint Presentation Outline Backgrounds
This is a bar chart ppt powerpoint presentation outline backgrounds. This is a one stage process. The stages in this process are sales in percentage, financial years, product, bar graph, finance.

Bar Chart Ppt PowerPoint Presentation Summary File Formats
This is a bar chart ppt powerpoint presentation summary file formats. This is a two stage process. The stages in this process are business, finance, financial years, sales in percentage, graph.

Combo Chart Ppt PowerPoint Presentation Gallery Design Ideas
This is a combo chart ppt powerpoint presentation gallery design ideas. This is a three stage process. The stages in this process are business, financial years, sales in percentage, finance, graph.

Open High Low Close Chart Ppt PowerPoint Presentation Slides File Formats
This is a open high low close chart ppt powerpoint presentation slides file formats. This is a five stage process. The stages in this process are open, high, low, close, finance.

Control Charts Average Ppt PowerPoint Presentation Ideas Demonstration
This is a control charts average ppt powerpoint presentation ideas demonstration. This is a one stage process. The stages in this process are control charts, sub group average, sub group numbers, finance, business.
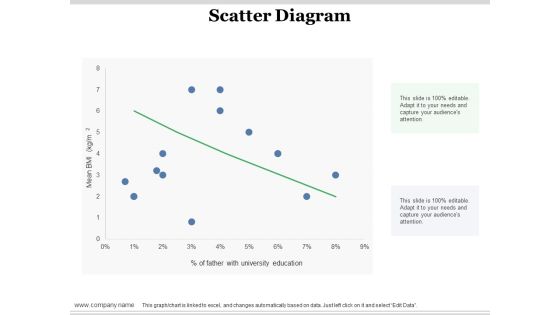
Scatter Diagram Ppt PowerPoint Presentation Infographic Template Design Ideas
This is a scatter diagram ppt powerpoint presentation infographic template design ideas. This is a one stage process. The stages in this process are scatter diagram, finance, in percentage, business, bar graph.
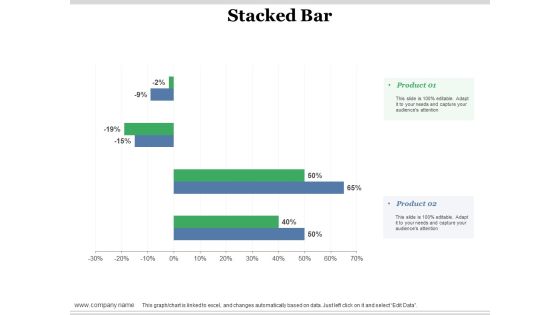
Stacked Bar Ppt PowerPoint Presentation Slides Layout Ideas
This is a stacked bar ppt powerpoint presentation slides layout ideas. This is a two stage process. The stages in this process are stacked bar, product, percentage, finance, business.
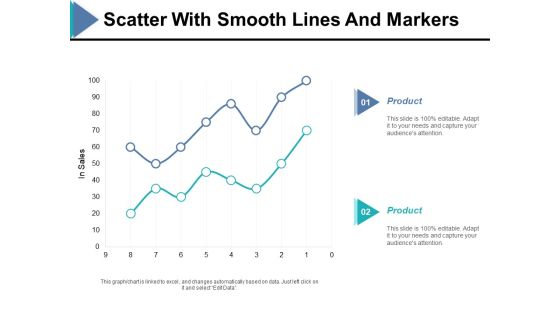
Scatter With Smooth Lines And Markers Ppt PowerPoint Presentation Ideas Example
This is a scatter with smooth lines and markers ppt powerpoint presentation ideas example. This is a two stage process. The stages in this process are in sales, finance, bar graph, product, business.
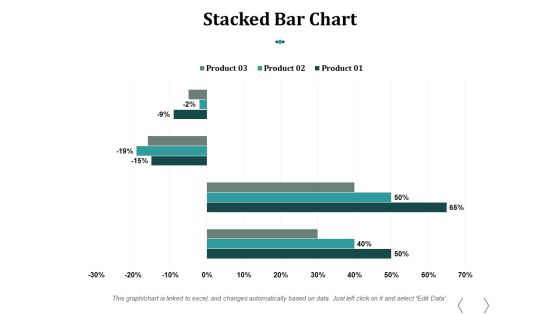
Stacked Bar Chart Ppt PowerPoint Presentation Influencers
This is a stacked bar chart ppt powerpoint presentation influencers. This is a three stage process. The stages in this process are stacked bar chart, product, percentage, finance, business.

Benefits Of An Mvp For Your Business Opportunity Ppt PowerPoint Presentation Summary Slideshow
Presenting this set of slides with name benefits of an mvp for your business opportunity ppt powerpoint presentation summary slideshow. This is a four stage process. The stages in this process are opportunity, intelligence, market validation, budget friendly, development strategy. This is a completely editable PowerPoint presentation and is available for immediate download. Download now and impress your audience.
New Commodity Building Procedure Development Plans Ppt Icon Aids PDF
Presenting this set of slides with name new commodity building procedure development plans ppt icon aids pdf. This is a six stage process. The stages in this process are marketing, communication, plan, budgeting, manufacturing. This is a completely editable PowerPoint presentation and is available for immediate download. Download now and impress your audience.

New Commodity Presenting Initiatives Development Plans Ppt Portfolio
Presenting this set of slides with name new commodity presenting initiatives development plans ppt portfolio. This is a six stage process. The stages in this process are marketing, communication, plan, budgeting, manufacturing. This is a completely editable PowerPoint presentation and is available for immediate download. Download now and impress your audience.

New Commodity Reveal Initiative Development Plans Ppt Professional Show PDF
Presenting this set of slides with name new commodity reveal initiative development plans ppt professional show pdf. This is a six stage process. The stages in this process are marketing, communication, plan, budgeting, manufacturing. This is a completely editable PowerPoint presentation and is available for immediate download. Download now and impress your audience.

Business Product Development Plan Development Plans Ppt Professional Sample PDF
Presenting this set of slides with name business product development plan development plans ppt professional sample pdf. This is a six stage process. The stages in this process are manufacturing, plan, marketing, communication, budgeting. This is a completely editable PowerPoint presentation and is available for immediate download. Download now and impress your audience.
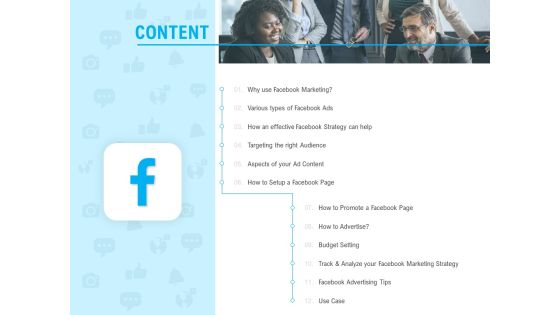
Social Media Advertisement Content Ppt File Outline PDF
Presenting social media advertisement content ppt file outline pdf to provide visual cues and insights. Share and navigate important information on twelve stages that need your due attention. This template can be used to pitch topics like targeting, effective, marketing, budget, analyze. In addtion, this PPT design contains high resolution images, graphics, etc, that are easily editable and available for immediate download.

Strategies To Enter Physical Fitness Club Business Barriers To Entry In Gym Health And Fitness Clubs Industry Guidelines PDF
Here we have mentioned some of the barriers to enter in Gym, Health and Fitness Clubs Industry such as rental costs, substandard products and services, unorganized players, maintaining chains of centers etc. Deliver an awe inspiring pitch with this creative strategies to enter physical fitness club business barriers to entry in gym health and fitness clubs industry guidelines pdf bundle. Topics likeaccount, revenues, awareness, global, players can be discussed with this completely editable template. It is available for immediate download depending on the needs and requirements of the user.

Projects And Assignments Template 1 Ppt PowerPoint Presentation Design Templates
This is a projects and assignments template 1 ppt powerpoint presentation design templates. This is a five stage process. The stages in this process are business, strategy, analysis, success, growth.

Number Of Crowdfunding Platforms By Region Ppt PowerPoint Presentation Slides Graphics Example
This is a number of crowdfunding platforms by region ppt powerpoint presentation slides graphics example. This is a six stage process. The stages in this process are business, strategy, analysis, compare.

Content Distribution Basic Details Ppt PowerPoint Presentation Summary Slides
This is a content distribution basic details ppt powerpoint presentation summary slides. This is a five stage process. The stages in this process are business, management, icons, analysis, strategy.
Financial Bizbok Business Design Ppt PowerPoint Presentation Pictures Graphics
This is a financial bizbok business design ppt powerpoint presentation pictures graphics. This is a three stage process. The stages in this process are business, management, strategy, analysis, financial.
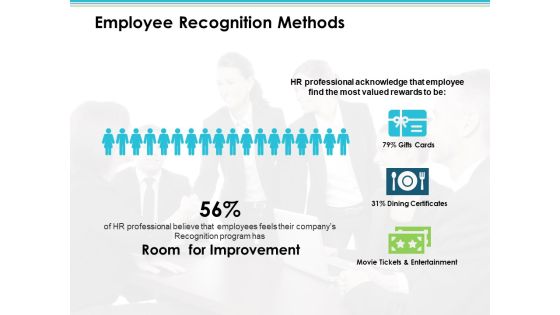
Employee Recognition Methods Employee Value Proposition Ppt PowerPoint Presentation Infographics Example
This is a employee recognition methods employee value proposition ppt powerpoint presentation infographics example. This is a three stage process. The stages in this process are business, management, strategy, analysis, icons.

Gym Health And Fitness Market Industry Report Market Opportunities For Gym Health And Fitness Clubs Industry Infographics PDF
Presenting this set of slides with name gym health and fitness market industry report market opportunities for gym health and fitness clubs industry infographics pdf. The topics discussed in these slides are health insurance costs, market, premium price, prime locations. This is a completely editable PowerPoint presentation and is available for immediate download. Download now and impress your audience.

Relevance Of Scrum Operations In Various Industries Diagrams PDF
This slide showcase agile methodology used for growing number of industries and benefits by opting project management . It includes construction, engineering, event planning and finance. Presenting Relevance Of Scrum Operations In Various Industries Diagrams PDF to dispense important information. This template comprises four stages. It also presents valuable insights into the topics including Construction, Engineering, Event Planning. This is a completely customizable PowerPoint theme that can be put to use immediately. So, download it and address the topic impactfully.
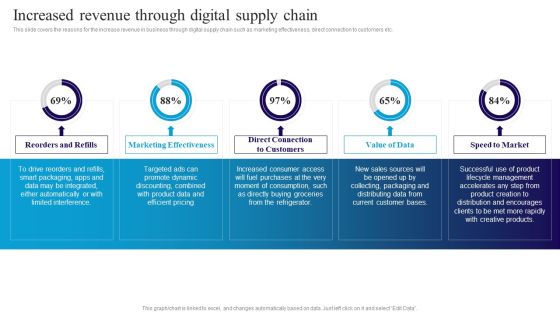
Deploying Automation In Logistics To Improve Increased Revenue Through Digital Supply Chain Topics PDF
This slide covers the reasons for the increase revenue in business through digital supply chain such as marketing effectiveness, direct connection to customers etc. Formulating a presentation can take up a lot of effort and time, so the content and message should always be the primary focus. The visuals of the PowerPoint can enhance the presenters message, so our Deploying Automation In Logistics To Improve Increased Revenue Through Digital Supply Chain Topics PDF was created to help save time. Instead of worrying about the design, the presenter can concentrate on the message while our designers work on creating the ideal templates for whatever situation is needed. Slidegeeks has experts for everything from amazing designs to valuable content, we have put everything into Deploying Automation In Logistics To Improve Increased Revenue Through Digital Supply Chain Topics PDF

Data Monetization Approach To Drive Business Growth Impact Of Data Monetization On Firm Growth Sample PDF
This slide depicts information regarding the impact of organic growth in terms of increase in revenues and market share. Are you in need of a template that can accommodate all of your creative concepts. This one is crafted professionally and can be altered to fit any style. Use it with Google Slides or PowerPoint. Include striking photographs, symbols, depictions, and other visuals. Fill, move around, or remove text boxes as desired. Test out color palettes and font mixtures. Edit and save your work, or work with colleagues. Download Data Monetization Approach To Drive Business Growth Impact Of Data Monetization On Firm Growth Sample PDF and observe how to make your presentation outstanding. Give an impeccable presentation to your group and make your presentation unforgettable.

Dashboard To Track Website And Application Traffic Implementing Focus Strategy To Improve Formats PDF
This slide showcases dashboard that can help organization to evaluate the traffic of website and application after entering into niche market. Its key elements are users, conversions, conversion by event type and engagement rate.Do you know about Slidesgeeks Dashboard To Track Website And Application Traffic Implementing Focus Strategy To Improve Formats PDF These are perfect for delivering any kind od presentation. Using it, create PowerPoint presentations that communicate your ideas and engage audiences. Save time and effort by using our pre-designed presentation templates that are perfect for a wide range of topic. Our vast selection of designs covers a range of styles, from creative to business, and are all highly customizable and easy to edit. Download as a PowerPoint template or use them as Google Slides themes.

Utilizing SEO To Boost Customer KPI Metrics Dashboard To Monitor Mobile Seo Performance Download PDF
The purpose of this slide is to outline key performance indicator KPI dashboard which will assist the marketer to analyze mobile search engine optimization SEO performance. The key metrics mentioned in the slide are total sessions, search engine rankings etc. Coming up with a presentation necessitates that the majority of the effort goes into the content and the message you intend to convey. The visuals of a PowerPoint presentation can only be effective if it supplements and supports the story that is being told. Keeping this in mind our experts created Utilizing SEO To Boost Customer KPI Metrics Dashboard To Monitor Mobile Seo Performance Download PDF to reduce the time that goes into designing the presentation. This way, you can concentrate on the message while our designers take care of providing you with the right template for the situation.

Business Strategy Consulting Solutions Company Outline Competitive Comparison By Financials Structure PDF
This slide shows the comparison with competitors on the basis of financials which includes revenue, net profit, market share, employee count and service coverage. Here you can discover an assortment of the finest PowerPoint and Google Slides templates. With these templates, you can create presentations for a variety of purposes while simultaneously providing your audience with an eye catching visual experience. Download Business Strategy Consulting Solutions Company Outline Competitive Comparison By Financials Structure PDF to deliver an impeccable presentation. These templates will make your job of preparing presentations much quicker, yet still, maintain a high level of quality. Slidegeeks has experienced researchers who prepare these templates and write high quality content for you. Later on, you can personalize the content by editing the Business Strategy Consulting Solutions Company Outline Competitive Comparison By Financials Structure PDF.

Organizational Advisory Solutions Business Profile Competitive Comparison By Financials Mockup PDF
This slide shows the comparison with competitors on the basis of financials which includes revenue, net profit, market share, employee count and service coverage. Here you can discover an assortment of the finest PowerPoint and Google Slides templates. With these templates, you can create presentations for a variety of purposes while simultaneously providing your audience with an eye catching visual experience. Download Organizational Advisory Solutions Business Profile Competitive Comparison By Financials Mockup PDF to deliver an impeccable presentation. These templates will make your job of preparing presentations much quicker, yet still, maintain a high level of quality. Slidegeeks has experienced researchers who prepare these templates and write high quality content for you. Later on, you can personalize the content by editing the Organizational Advisory Solutions Business Profile Competitive Comparison By Financials Mockup PDF.
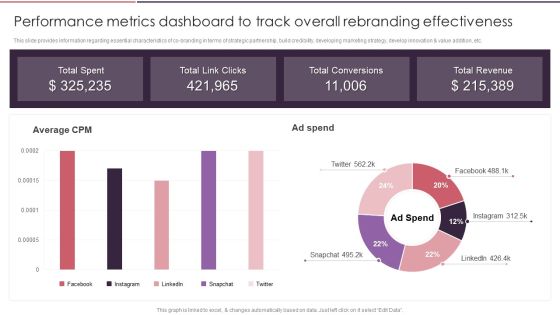
Rebranding Brand Fresh Face Development Performance Metrics Dashboard To Track Overall Rules PDF
This slide provides information regarding essential characteristics of co-branding in terms of strategic partnership, build credibility, developing marketing strategy, develop innovation and value addition, etc. Coming up with a presentation necessitates that the majority of the effort goes into the content and the message you intend to convey. The visuals of a PowerPoint presentation can only be effective if it supplements and supports the story that is being told. Keeping this in mind our experts created Rebranding Brand Fresh Face Development Performance Metrics Dashboard To Track Overall Rules PDF to reduce the time that goes into designing the presentation. This way, you can concentrate on the message while our designers take care of providing you with the right template for the situation.
Rebranding Brand Fresh Face Development Rebranding Project Progress Tracking Dashboard Background PDF
This slide provides information regarding essential characteristics of co-branding in terms of strategic partnership, build credibility, developing marketing strategy, develop innovation and value addition, etc. This Rebranding Brand Fresh Face Development Rebranding Project Progress Tracking Dashboard Background PDF is perfect for any presentation, be it in front of clients or colleagues. It is a versatile and stylish solution for organizing your meetings. The Rebranding Brand Fresh Face Development Rebranding Project Progress Tracking Dashboard Background PDF features a modern design for your presentation meetings. The adjustable and customizable slides provide unlimited possibilities for acing up your presentation. Slidegeeks has done all the homework before launching the product for you. So, dont wait, grab the presentation templates today.

Determining The Likelihood Of Loosing Sales Deals Strategic Promotion Plan To Improve Product Brand Image Pictures PDF
Purpose of this slide is to address the impact of improved marketing efforts on the likelihood of loosing sales deals. It also demonstrates a 26 precent increase in lead conversion rate.Crafting an eye-catching presentation has never been more straightforward. Let your presentation shine with this tasteful yet straightforward Determining The Likelihood Of Loosing Sales Deals Strategic Promotion Plan To Improve Product Brand Image Pictures PDF template. It offers a minimalistic and classy look that is great for making a statement. The colors have been employed intelligently to add a bit of playfulness while still remaining professional. Construct the ideal Determining The Likelihood Of Loosing Sales Deals Strategic Promotion Plan To Improve Product Brand Image Pictures PDF that effortlessly grabs the attention of your audience Begin now and be certain to wow your customers.

CRM Pipeline Administration Tracking Customer Sales Funnel Dashboard Brochure PDF
This slide covers information regarding the customer sales funnel tracking with sales volume and total market. If you are looking for a format to display your unique thoughts, then the professionally designed CRM Pipeline Administration Tracking Customer Sales Funnel Dashboard Brochure PDF is the one for you. You can use it as a Google Slides template or a PowerPoint template. Incorporate impressive visuals, symbols, images, and other charts. Modify or reorganize the text boxes as you desire. Experiment with shade schemes and font pairings. Alter, share or cooperate with other people on your work. Download CRM Pipeline Administration Tracking Customer Sales Funnel Dashboard Brochure PDF and find out how to give a successful presentation. Present a perfect display to your team and make your presentation unforgettable.
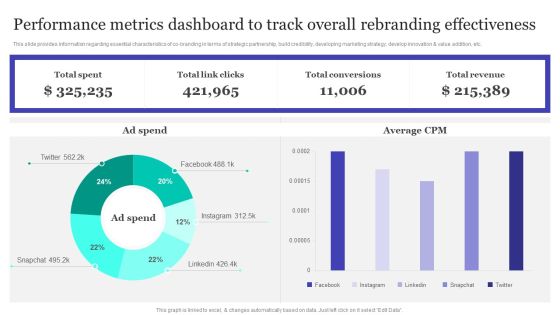
Performance Metrics Dashboard To Track Overall Rebranding Effectiveness Information PDF
This slide provides information regarding essential characteristics of co-branding in terms of strategic partnership, build credibility, developing marketing strategy, develop innovation and value addition, etc. This Performance Metrics Dashboard To Track Overall Rebranding Effectiveness Information PDF from Slidegeeks makes it easy to present information on your topic with precision. It provides customization options, so you can make changes to the colors, design, graphics, or any other component to create a unique layout. It is also available for immediate download, so you can begin using it right away. Slidegeeks has done good research to ensure that you have everything you need to make your presentation stand out. Make a name out there for a brilliant performance.

Business To Business Social Decline In Leads Generated And Organic Reach Graphics PDF
This slide showcases scenario and results of organization marketing campaigns. It illustrates graph which shows decline in leads generated and organic reach of social media posts from past four months This Business To Business Social Decline In Leads Generated And Organic Reach Graphics PDF from Slidegeeks makes it easy to present information on your topic with precision. It provides customization options, so you can make changes to the colors, design, graphics, or any other component to create a unique layout. It is also available for immediate download, so you can begin using it right away. Slidegeeks has done good research to ensure that you have everything you need to make your presentation stand out. Make a name out there for a brilliant performance.

Business To Business Digital Facts About Linkedin As Number One For Lead Inspiration PDF
This template covers statistics about LinkedIn as number one social media platform for lead generation, B2B marketing, posting articles, blogs and videos. Slidegeeks is here to make your presentations a breeze with Business To Business Digital Facts About Linkedin As Number One For Lead Inspiration PDF With our easy-to-use and customizable templates, you can focus on delivering your ideas rather than worrying about formatting. With a variety of designs to choose from, youre sure to find one that suits your needs. And with animations and unique photos, illustrations, and fonts, you can make your presentation pop. So whether youre giving a sales pitch or presenting to the board, make sure to check out Slidegeeks first.

Business To Business Digital Google Analytics For All Web Tracking Elements PDF
This template covers tools to measure marketing analytics such as google analytics for all web tracking, google data studio to build real-time reporting dashboards and google data studio reports. Do you have an important presentation coming up Are you looking for something that will make your presentation stand out from the rest Look no further than Business To Business Digital Google Analytics For All Web Tracking Elements PDF. With our professional designs, you can trust that your presentation will pop and make delivering it a smooth process. And with Slidegeeks, you can trust that your presentation will be unique and memorable. So why wait Grab Business To Business Digital Google Analytics For All Web Tracking Elements PDF today and make your presentation stand out from the rest.

Business To Business Digital Google Data Studio Reports Icons PDF
This template covers tools to measure marketing analytics such as google analytics for all web tracking, google data studio to build real-time reporting dashboards and google data studio reports. Whether you have daily or monthly meetings, a brilliant presentation is necessary. Business To Business Digital Google Data Studio Reports Icons PDF can be your best option for delivering a presentation. Represent everything in detail using Business To Business Digital Google Data Studio Reports Icons PDF and make yourself stand out in meetings. The template is versatile and follows a structure that will cater to your requirements. All the templates prepared by Slidegeeks are easy to download and edit. Our research experts have taken care of the corporate themes as well. So, give it a try and see the results.

Business To Business Digital Google Data Studio To Build Real Time Reporting Summary PDF
This template covers tools to measure marketing analytics such as google analytics for all web tracking, google data studio to build real-time reporting dashboards and google data studio reports. Find highly impressive Business To Business Digital Google Data Studio To Build Real Time Reporting Summary PDF on Slidegeeks to deliver a meaningful presentation. You can save an ample amount of time using these presentation templates. No need to worry to prepare everything from scratch because Slidegeeks experts have already done a huge research and work for you. You need to download Business To Business Digital Google Data Studio To Build Real Time Reporting Summary PDF for your upcoming presentation. All the presentation templates are 100 percent editable and you can change the color and personalize the content accordingly. Download now.

Business To Business Digital Implement Tracking And Reporting To Measure Summary PDF
This template covers dashboard to measure and analyze campaign performance. It also helps in tracking and reporting account based marketing channel and tactics. If you are looking for a format to display your unique thoughts, then the professionally designed Business To Business Digital Implement Tracking And Reporting To Measure Summary PDF is the one for you. You can use it as a Google Slides template or a PowerPoint template. Incorporate impressive visuals, symbols, images, and other charts. Modify or reorganize the text boxes as you desire. Experiment with shade schemes and font pairings. Alter, share or cooperate with other people on your work. Download Business To Business Digital Implement Tracking And Reporting To Measure Summary PDF and find out how to give a successful presentation. Present a perfect display to your team and make your presentation unforgettable.
 Home
Home