Research Data Management
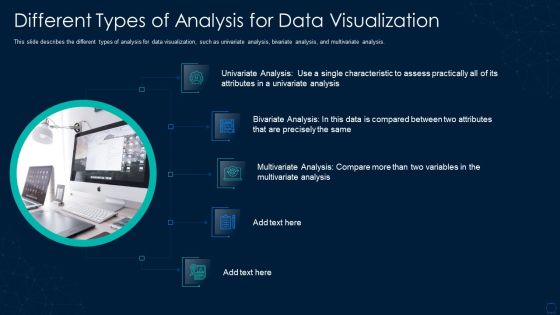
Graphical Representation Of Research IT Different Types Of Analysis For Data Visualization Structure PDF
This slide describes the different types of analysis for data visualization, such as univariate analysis, bivariate analysis, and multivariate analysis. This is a graphical representation of research it different types of analysis for data visualization structure pdf template with various stages. Focus and dispense information on five stages using this creative set, that comes with editable features. It contains large content boxes to add your information on topics like different types of analysis for data visualization. You can also showcase facts, figures, and other relevant content using this PPT layout. Grab it now.

Table Of Contents For Graphical Representation Of Research IT Data Elements PDF
Presenting table of contents for graphical representation of research it data elements pdf to provide visual cues and insights. Share and navigate important information on five stages that need your due attention. This template can be used to pitch topics like implementation, plan, sales performance. In addtion, this PPT design contains high resolution images, graphics, etc, that are easily editable and available for immediate download.

Addressing Data Requirements For Genetic Science Research Proposal One Pager Sample Example Document
This slide provides information about the data requirements demanded by the project management company in order to meet the clients requirements. Presenting you an exemplary Addressing Data Requirements For Genetic Science Research Proposal One Pager Sample Example Document. Our one-pager comprises all the must-have essentials of an inclusive document. You can edit it with ease, as its layout is completely editable. With such freedom, you can tweak its design and other elements to your requirements. Download this Addressing Data Requirements For Genetic Science Research Proposal One Pager Sample Example Document brilliant piece now.
Magnifying Glass With Icons For Research Management Ppt PowerPoint Presentation Influencers
This is a magnifying glass with icons for research management ppt powerpoint presentation influencers. This is a one stage process. The stages in this process are magnifier, icons, search, business, analysis, strategy, success.

Blue Data Research Development Internet PowerPoint Templates And PowerPoint Backgrounds 0211
Microsoft PowerPoint Template and Background with blue data research and development

Data Research And Analysis Vector Icon Ppt PowerPoint Presentation Icon Background Image PDF
Presenting data research and analysis vector icon ppt powerpoint presentation icon background image pdf to dispense important information. This template comprises three stages. It also presents valuable insights into the topics including data research and analysis vector icon. This is a completely customizable PowerPoint theme that can be put to use immediately. So, download it and address the topic impactfully.

Development Leadership Program Research Data Analysis Liquidation Value Ppt PowerPoint Presentation File Graphics Example
This is a development leadership program research data analysis liquidation value ppt powerpoint presentation file graphics example. This is a four stage process. The stages in this process are development leadership program, research data analysis, liquidation value.
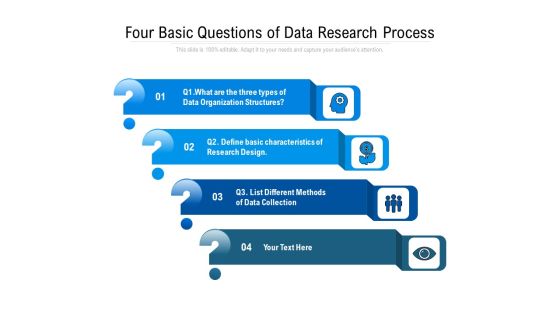
Four Basic Questions Of Data Research Process Ppt PowerPoint Presentation File Slides PDF
Presenting four basic questions of data research process ppt powerpoint presentation file slides pdf to dispense important information. This template comprises four stages. It also presents valuable insights into the topics including data organization, research design, data collection. This is a completely customizable PowerPoint theme that can be put to use immediately. So, download it and address the topic impactfully.

Four Stages Of Data Science With Research And Development Ppt PowerPoint Presentation File Smartart PDF
Showcasing this set of slides titled four stages of data science with research and development ppt powerpoint presentation file smartart pdf. The topics addressed in these templates are data science, product,data exploration, model development, research. All the content presented in this PPT design is completely editable. Download it and make adjustments in color, background, font etc. as per your unique business setting.

Market Research Plan With Data Collection Ppt PowerPoint Presentation Slides Master Slide PDF
Pitch your topic with ease and precision using this market research plan with data collection ppt powerpoint presentation slides master slide pdf. This layout presents information on data collection, research plan, data sources. It is also available for immediate download and adjustment. So, changes can be made in the color, design, graphics or any other component to create a unique layout.

Data Advisory And Research Advisory Project Ppt PowerPoint Presentation File Slides PDF
This slide exhibits data collection consulting project which includes process, project scope, services and time taken to complete the project. It includes 4 major tasks like- defining project, data collection, data analysis and modelling. Presenting Data Advisory And Research Advisory Project Ppt PowerPoint Presentation File Slides PDF to dispense important information. This template comprises data advisory and research advisory project ppt powerpoint presentation file slides pdf stages. It also presents valuable insights into the topics including define project, data collection, data analysis, modelling. This is a completely customizable PowerPoint theme that can be put to use immediately. So, download it and address the topic impactfully.

Online Data Research Advisory Project Ppt PowerPoint Presentation File Themes PDF
This slide exhibits online data research consulting project process and methods, It includes- tools and methods, process, service features and so on. Presenting online data research advisory project ppt powerpoint presentation file themes pdf to dispense important information. This template comprises five stages. It also presents valuable insights into the topics including report preparation, data analysis, data collection, develop research plan, problem. This is a completely customizable PowerPoint theme that can be put to use immediately. So, download it and address the topic impactfully.

Strategic Research Compare Prepare And Manipulate Data Ppt PowerPoint Presentation Styles Rules
This is a strategic research compare prepare and manipulate data ppt powerpoint presentation styles rules. This is a five stage process. The stages in this process are predictive model, predictive framework, predictive structure.
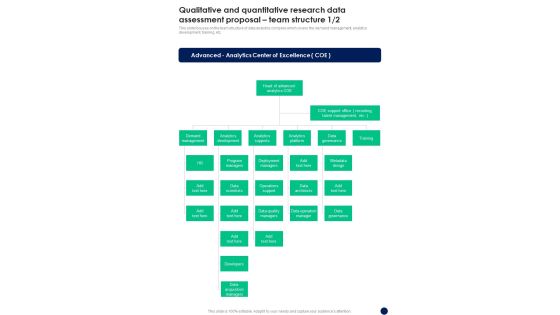
Qualitative And Quantitative Research Data Assessment Proposal Team Structure One Pager Sample Example Document
This slide focuses on the team structure of data analytics company which covers the demand management, analytics development, training, etc. Presenting you an exemplary Qualitative And Quantitative Research Data Assessment Proposal Team Structure One Pager Sample Example Document. Our one pager comprises all the must have essentials of an inclusive document. You can edit it with ease, as its layout is completely editable. With such freedom, you can tweak its design and other elements to your requirements. Download this Qualitative And Quantitative Research Data Assessment Proposal Team Structure One Pager Sample Example Document brilliant piece now.

Qualitative And Quantitative Research Data Assessment Proposal Plan Of Action One Pager Sample Example Document
This slide covers the plan of action for research data analysis based on different phases such as data collection, pre- processing, etc. Presenting you an exemplary Qualitative And Quantitative Research Data Assessment Proposal Plan Of Action One Pager Sample Example Document. Our one pager comprises all the must have essentials of an inclusive document. You can edit it with ease, as its layout is completely editable. With such freedom, you can tweak its design and other elements to your requirements. Download this Qualitative And Quantitative Research Data Assessment Proposal Plan Of Action One Pager Sample Example Document brilliant piece now.

Qualitative And Quantitative Research Data Assessment Proposal Timeline One Pager Sample Example Document
This slide covers the timeline for research data analysis project which focuses on business issue, data understanding, preparation, etc. Presenting you an exemplary Qualitative And Quantitative Research Data Assessment Proposal Timeline One Pager Sample Example Document. Our one pager comprises all the must have essentials of an inclusive document. You can edit it with ease, as its layout is completely editable. With such freedom, you can tweak its design and other elements to your requirements. Download this Qualitative And Quantitative Research Data Assessment Proposal Timeline One Pager Sample Example Document brilliant piece now.

Proposal For Data Analysis In Research Project Example Document Report Doc Pdf Ppt
Here is a predesigned Proposal For Data Analysis In Research Project Example Document Report Doc Pdf Ppt for you. Built on extensive research and analysis, this one-complete deck has all the center pieces of your specific requirements. This temple exudes brilliance and professionalism. Being completely editable, you can make changes to suit your purpose. Get this Proposal For Data Analysis In Research Project Example Document Report Doc Pdf Ppt A4 One-pager now.
Qualitative And Quantitative Research Data Assessment Proposal Example Document Report Doc Pdf Ppt
Heres a predesigned Qualitative And Quantitative Research Data Assessment Proposal Example Document Report Doc Pdf Ppt for you. Built on extensive research and analysis, this one complete deck has all the center pieces of your specific requirements. This temple exudes brilliance and professionalism. Being completely editable, you can make changes to suit your purpose. Get this Qualitative And Quantitative Research Data Assessment Proposal Example Document Report Doc Pdf Ppt A4 One pager now.

Departments Of Visualization Research Data Driven Project Planning After Visualization Rules PDF
This slide depicts the impact of visualization research implementation, which results in data-driven project planning, due to which there is a 23 times increase in happy customers.This is a Departments Of Visualization Research Data Driven Project Planning After Visualization Rules PDF template with various stages. Focus and dispense information on three stages using this creative set, that comes with editable features. It contains large content boxes to add your information on topics like Visualization Research, Strategy Of The Company, Customers Are Regained You can also showcase facts, figures, and other relevant content using this PPT layout. Grab it now.

Quantitative Risk Assessment Methods To Collect Data For Market Research Guidelines PDF
This slide provides the glimpse about the method to collect data market research such as interviews, focus groups, observation, usage data, surveys, etc. Presenting Quantitative Risk Assessment Methods To Collect Data For Market Research Guidelines PDF to provide visual cues and insights. Share and navigate important information on five stages that need your due attention. This template can be used to pitch topics like Observation, Surveys, Usage Data, Focus Groups, Interviews. In addtion, this PPT design contains high resolution images, graphics, etc, that are easily editable and available for immediate download.

Qualitative And Quantitative Research Data Assessment Proposal Key Deliverables One Pager Sample Example Document
This slide covers the key deliverables for research data analysis which covers the decision mapping, analysis and design, implementation, etc. Presenting you an exemplary Qualitative And Quantitative Research Data Assessment Proposal Key Deliverables One Pager Sample Example Document. Our one pager comprises all the must have essentials of an inclusive document. You can edit it with ease, as its layout is completely editable. With such freedom, you can tweak its design and other elements to your requirements. Download this Qualitative And Quantitative Research Data Assessment Proposal Key Deliverables One Pager Sample Example Document brilliant piece now.
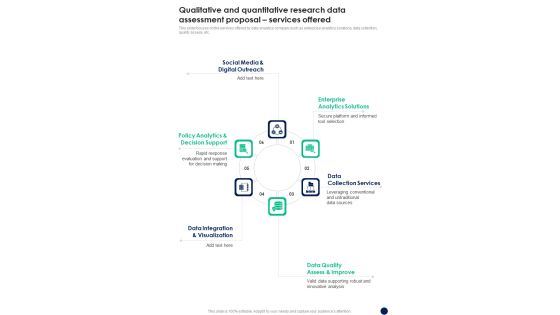
Qualitative And Quantitative Research Data Assessment Proposal Services Offered One Pager Sample Example Document
This slide focuses on the services offered by data analytics company such as enterprise analytics solutions, data collection, quality assess, etc. Presenting you an exemplary Qualitative And Quantitative Research Data Assessment Proposal Services Offered One Pager Sample Example Document. Our one pager comprises all the must have essentials of an inclusive document. You can edit it with ease, as its layout is completely editable. With such freedom, you can tweak its design and other elements to your requirements. Download this Qualitative And Quantitative Research Data Assessment Proposal Services Offered One Pager Sample Example Document brilliant piece now.

Business Circle Chart PowerPoint Templates Business Market Research Data Ppt Slides
Business Circle Chart PowerPoint Templates Business market research data PPT Slides-\nThis PowerPoint diagram slide shows a circular process withan arrow. Useful to represent process slides-Business Circle Chart PowerPoint Templates Business market research data PPT Slides-This template can be used for presentations relating to 3d, Abstract, Around, Arrow, Background, Bright, Business, Card, Chart, Circle, Circular, Circulation, Collection, Colorful, Communication, Concept, Cycle, Cyclic, Design, Direction, Element, Flow, Glass, Glossy, Graphic, Icon, Illustration, Modern, Motion, Network
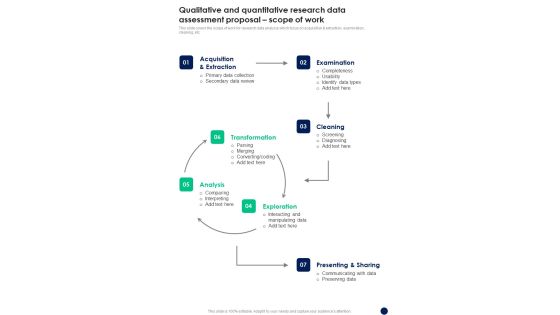
Qualitative And Quantitative Research Data Assessment Proposal Scope Of Work One Pager Sample Example Document
This slide covers the scope of work for research data analysis which focus on acquisition and extraction, examination, cleaning, etc. Presenting you an exemplary Qualitative And Quantitative Research Data Assessment Proposal Scope Of Work One Pager Sample Example Document. Our one pager comprises all the must have essentials of an inclusive document. You can edit it with ease, as its layout is completely editable. With such freedom, you can tweak its design and other elements to your requirements. Download this Qualitative And Quantitative Research Data Assessment Proposal Scope Of Work One Pager Sample Example Document brilliant piece now.
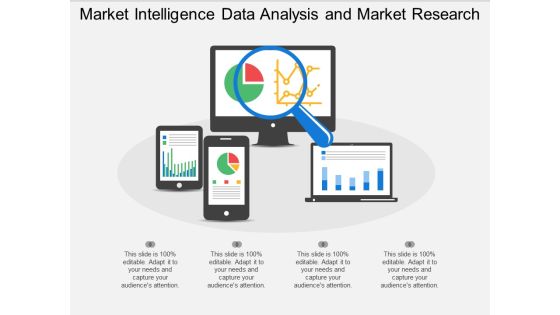
Market Intelligence Data Analysis And Market Research Ppt PowerPoint Presentation Professional Templates
This is a market intelligence data analysis and market research ppt powerpoint presentation professional templates. This is a four stage process. The stages in this process are digital analytics, digital dashboard, marketing.
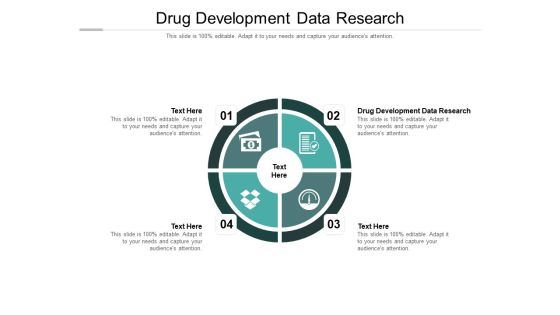
Drug Development Data Research Ppt PowerPoint Presentation Infographic Template Ideas Cpb Pdf
Presenting this set of slides with name drug development data research ppt powerpoint presentation infographic template ideas cpb pdf. This is an editable Powerpoint four stages graphic that deals with topics like drug development data research to help convey your message better graphically. This product is a premium product available for immediate download and is 100 percent editable in Powerpoint. Download this now and use it in your presentations to impress your audience.
Data Research And Analysis For Mobile Users Ppt PowerPoint Presentation Icon Inspiration
This is a data research and analysis for mobile users ppt powerpoint presentation icon inspiration. This is a four stage process. The stages in this process are mobile analytics, mobile tracking, mobile web analytics.

Plan Of Action For Data Analysis In Research Project One Pager Sample Example Document
Presenting you an exemplary Plan Of Action For Data Analysis In Research Project One Pager Sample Example Document. Our one-pager comprises all the must-have essentials of an inclusive document. You can edit it with ease, as its layout is completely editable. With such freedom, you can tweak its design and other elements to your requirements. Download this Plan Of Action For Data Analysis In Research Project One Pager Sample Example Document brilliant piece now.
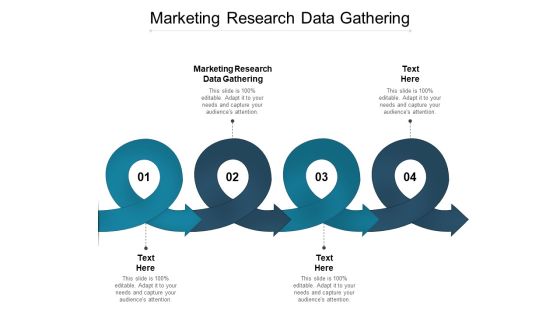
Marketing Research Data Gathering Ppt PowerPoint Presentation Slides Design Templates Cpb
Presenting this set of slides with name marketing research data gathering ppt powerpoint presentation slides design templates cpb. This is an editable Powerpoint four stages graphic that deals with topics like marketing research data gathering to help convey your message better graphically. This product is a premium product available for immediate download and is 100 percent editable in Powerpoint. Download this now and use it in your presentations to impress your audience.
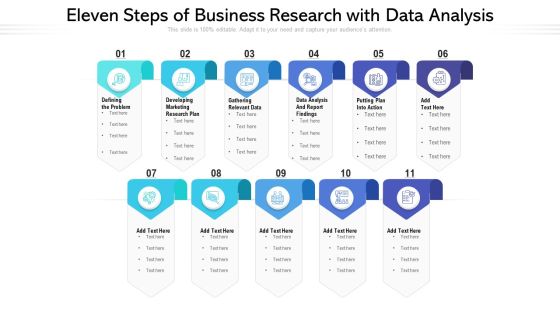
Eleven Steps Of Business Research With Data Analysis Ppt PowerPoint Presentation File Structure PDF
Presenting eleven steps of business research with data analysis ppt powerpoint presentation file structure pdf to dispense important information. This template comprises eleven stages. It also presents valuable insights into the topics including marketing, data analysis, developing. This is a completely customizable PowerPoint theme that can be put to use immediately. So, download it and address the topic impactfully.

Graphical Representation Of Research IT Data Driven Project Planning Structure PDF
This slide depicts the impact of visualization research implementation, which results in data driven project planning, due to which there is a 23 times increase in happy customers. This is a graphical representation of research it data driven project planning structure pdf template with various stages. Focus and dispense information on three stages using this creative set, that comes with editable features. It contains large content boxes to add your information on topics like profit, customers, strategy. You can also showcase facts, figures, and other relevant content using this PPT layout. Grab it now.
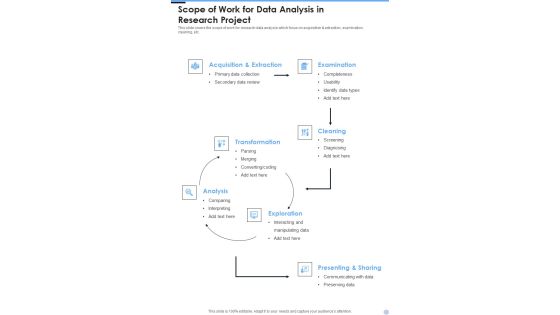
Scope Of Work For Data Analysis In Research Project One Pager Sample Example Document
Presenting you an exemplary Scope Of Work For Data Analysis In Research Project One Pager Sample Example Document. Our one-pager comprises all the must-have essentials of an inclusive document. You can edit it with ease, as its layout is completely editable. With such freedom, you can tweak its design and other elements to your requirements. Download this Scope Of Work For Data Analysis In Research Project One Pager Sample Example Document brilliant piece now.

Statement Of Work And Contract For Data Analytics Research Project Service One Pager Sample Example Document
Presenting you an exemplary Statement Of Work And Contract For Data Analytics Research Project Service One Pager Sample Example Document. Our one-pager comprises all the must-have essentials of an inclusive document. You can edit it with ease, as its layout is completely editable. With such freedom, you can tweak its design and other elements to your requirements. Download this Statement Of Work And Contract For Data Analytics Research Project Service One Pager Sample Example Document brilliant piece now.
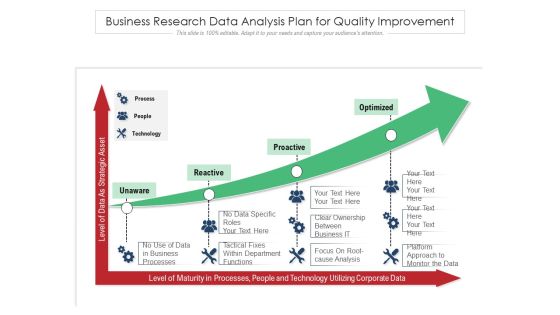
Business Research Data Analysis Plan For Quality Improvement Ppt PowerPoint Presentation File Visual Aids PDF
Presenting business research data analysis plan for quality improvement ppt powerpoint presentation file visual aids pdf to dispense important information. This template comprises four stages. It also presents valuable insights into the topics including unaware, reactive, proactive. This is a completely customizable PowerPoint theme that can be put to use immediately. So, download it and address the topic impactfully.

Departments Of Visualization Research Google Charts Tool For Data Visualization Themes PDF
This slide depicts google charts as the tool for data visualization, which can extract data from various sources, including SQL, databases, google sheets.This is a Departments Of Visualization Research Google Charts Tool For Data Visualization Themes PDF template with various stages. Focus and dispense information on five stages using this creative set, that comes with editable features. It contains large content boxes to add your information on topics like Popular Free Alternative, Create Dynamic Data, Including SQL Databases You can also showcase facts, figures, and other relevant content using this PPT layout. Grab it now.

Business Operation Modeling Approaches Methods To Collect Data For Market Research Formats PDF
This slide provides the glimpse about the method to collect data market research such as interviews, focus groups, observation, usage data, surveys, etc.This is a business operation modeling approaches methods to collect data for market research formats pdf template with various stages. Focus and dispense information on five stages using this creative set, that comes with editable features. It contains large content boxes to add your information on topics like observation, focus groups, surveys You can also showcase facts, figures, and other relevant content using this PPT layout. Grab it now.
PMP Tools Methods To Collect Data For Market Research Icons PDF
This slide provides the glimpse about the method to collect data market research such as interviews, focus groups, observation, usage data, surveys, etc.This is a PMP Tools Methods To Collect Data For Market Research Icons PDF template with various stages. Focus and dispense information on five stages using this creative set, that comes with editable features. It contains large content boxes to add your information on topics like Observation, Interviews, Focus Groups You can also showcase facts, figures, and other relevant content using this PPT layout. Grab it now.

Branches For Visualization Research And Development Data Driven Project Planning Template PDF
This slide depicts the impact of visualization research implementation, which results in data-driven project planning, due to which there is a 23 times increase in happy customers. Get a simple yet stunning designed Branches For Visualization Research And Development Data Driven Project Planning Template PDF. It is the best one to establish the tone in your meetings. It is an excellent way to make your presentations highly effective. So, download this PPT today from Slidegeeks and see the positive impacts. Our easy-to-edit Branches For Visualization Research And Development Data Driven Project Planning Template PDF can be your go-to option for all upcoming conferences and meetings. So, what are you waiting for Grab this template today.
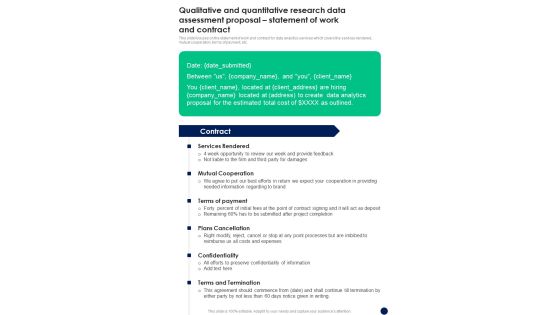
Qualitative And Quantitative Research Data Assessment Statement Of Work One Pager Sample Example Document
This slide focuses on the statement of work and contract for data analytics services which covers the services rendered, mutual cooperation, terms of payment, etc. Presenting you an exemplary Qualitative And Quantitative Research Data Assessment Statement Of Work One Pager Sample Example Document. Our one pager comprises all the must have essentials of an inclusive document. You can edit it with ease, as its layout is completely editable. With such freedom, you can tweak its design and other elements to your requirements. Download this Qualitative And Quantitative Research Data Assessment Statement Of Work One Pager Sample Example Document brilliant piece now.

Branches For Visualization Research And Development Highcharts As Data Visualization Ideas PDF
This slide represents another data visualization research tool that provides a high level of compatibility and is also a popular tool for commercial use. Whether you have daily or monthly meetings, a brilliant presentation is necessary. Branches For Visualization Research And Development Highcharts As Data Visualization Ideas PDF can be your best option for delivering a presentation. Represent everything in detail using Branches For Visualization Research And Development Highcharts As Data Visualization Ideas PDF and make yourself stand out in meetings. The template is versatile and follows a structure that will cater to your requirements. All the templates prepared by Slidegeeks are easy to download and edit. Our research experts have taken care of the corporate themes as well. So, give it a try and see the results.

Clinical Trial Phases With Data Focus And Design Features Clinical Research Trial Phases Structure PDF
This slide shows the tabulation of key objectives of multiple phases of the clinical research process. It also provides information regarding factors to be identified while investigating the new drug. Find highly impressive Clinical Trial Phases With Data Focus And Design Features Clinical Research Trial Phases Structure PDF on Slidegeeks to deliver a meaningful presentation. You can save an ample amount of time using these presentation templates. No need to worry to prepare everything from scratch because Slidegeeks experts have already done a huge research and work for you. You need to download Clinical Trial Phases With Data Focus And Design Features Clinical Research Trial Phases Structure PDF for your upcoming presentation. All the presentation templates are 100 percent editable and you can change the color and personalize the content accordingly. Download now.

Branches For Visualization Research And Development Data Visualization Helps In Academic Download PDF
This slide describes that using visualization in academic areas caters to easy detection of trendy data sets and helps understand the data. From laying roadmaps to briefing everything in detail, our templates are perfect for you. You can set the stage with your presentation slides. All you have to do is download these easy-to-edit and customizable templates. Branches For Visualization Research And Development Data Visualization Helps In Academic Download PDF will help you deliver an outstanding performance that everyone would remember and praise you for. Do download this presentation today.
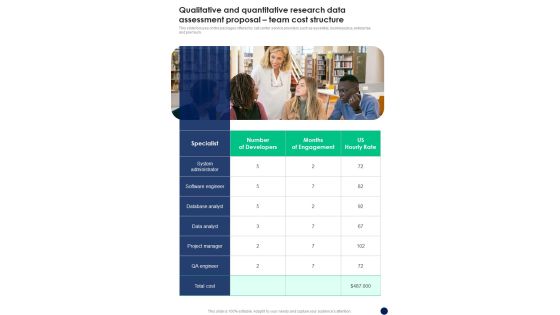
Qualitative And Quantitative Research Data Assessment Proposal Team Cost Structure One Pager Sample Example Document
This slide focuses on the packages offered by call center service providers such as essential, business plus, enterprise, and premium. Presenting you an exemplary Qualitative And Quantitative Research Data Assessment Proposal Team Cost Structure One Pager Sample Example Document. Our one pager comprises all the must have essentials of an inclusive document. You can edit it with ease, as its layout is completely editable. With such freedom, you can tweak its design and other elements to your requirements. Download this Qualitative And Quantitative Research Data Assessment Proposal Team Cost Structure One Pager Sample Example Document brilliant piece now.

Branches For Visualization Research And Development Google Charts Tool For Data Elements PDF
This slide depicts google charts as the tool for data visualization, which can extract data from various sources, including SQL, databases, google sheets. Do you have an important presentation coming up Are you looking for something that will make your presentation stand out from the rest Look no further than Branches For Visualization Research And Development Google Charts Tool For Data Elements PDF. With our professional designs, you can trust that your presentation will pop and make delivering it a smooth process. And with Slidegeeks, you can trust that your presentation will be unique and memorable. So why wait Grab Branches For Visualization Research And Development Google Charts Tool For Data Elements PDF today and make your presentation stand out from the rest.

Graphical Representation Of Research IT Google Charts Tool For Data Visualization Introduction PDF
This slide depicts google charts as the tool for data visualization, which can extract data from various sources, including SQL, databases, google sheets. This is a graphical representation of research it google charts tool for data visualization introduction pdf template with various stages. Focus and dispense information on five stages using this creative set, that comes with editable features. It contains large content boxes to add your information on topics like dynamic, databases, sources, technology. You can also showcase facts, figures, and other relevant content using this PPT layout. Grab it now.

Data Driven Marketing Solutions Firm Company Profile Research Services Infographics PDF
The following slide highlights the research services offered by Pureprofile. It provides high-quality data insights in the form of product concept testing, customer loyalty measurement, and creative add testing This Data Driven Marketing Solutions Firm Company Profile Research Services Infographics PDF from Slidegeeks makes it easy to present information on your topic with precision. It provides customization options, so you can make changes to the colors, design, graphics, or any other component to create a unique layout. It is also available for immediate download, so you can begin using it right away. Slidegeeks has done good research to ensure that you have everything you need to make your presentation stand out. Make a name out there for a brilliant performance.

Academic Investigation Method Of Data Collection For Student Research Proposal Ppt Infographics Graphic Tips PDF
Presenting this set of slides with name academic investigation method of data collection for student research proposal ppt infographics graphic tips pdf. This is a two stage process. The stages in this process are primary sources, secondary sources. This is a completely editable PowerPoint presentation and is available for immediate download. Download now and impress your audience.
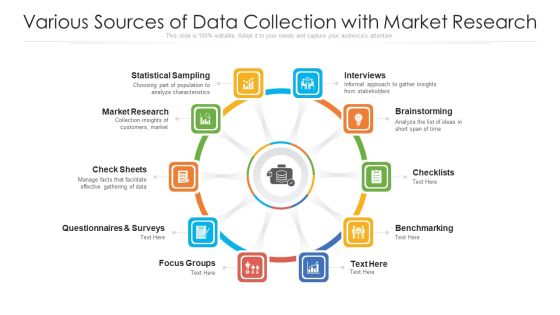
Various Sources Of Data Collection With Market Research Ppt PowerPoint Presentation Styles Mockup PDF
Presenting various sources of data collection with market research ppt powerpoint presentation styles mockup pdf to dispense important information. This template comprises ten stages. It also presents valuable insights into the topics including statistical sampling, interviews, brainstorming. This is a completely customizable PowerPoint theme that can be put to use immediately. So, download it and address the topic impactfully.

Data And Information Visualization Visual Analytics Branch Of Visualization Research Designs PDF
This slide shows visual analytics, the last branch of visualization research, which emerged from the advancements in the other two branches and mainly focused on analytical reasoning. Make sure to capture your audiences attention in your business displays with our gratis customizable Data And Information Visualization Visual Analytics Branch Of Visualization Research Designs PDF. These are great for business strategies, office conferences, capital raising or task suggestions. If you desire to acquire more customers for your tech business and ensure they stay satisfied, create your own sales presentation with these plain slides.
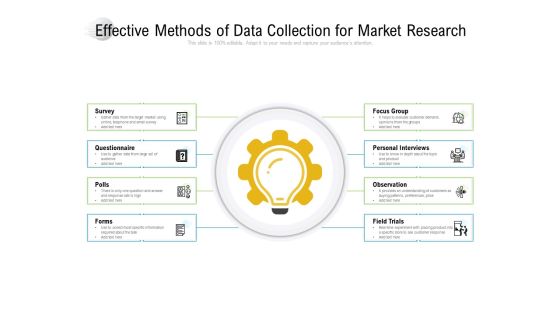
Effective Methods Of Data Collection For Market Research Ppt PowerPoint Presentation File Professional
Presenting this set of slides with name effective methods of data collection for market research ppt powerpoint presentation file professional. This is a eight stage process. The stages in this process are survey, questionnaire, polls, forms, focus group, personal interviews, observation, field trials. This is a completely editable PowerPoint presentation and is available for immediate download. Download now and impress your audience.

Departments Of Visualization Research Univariate Analysis Techniques For Data Visualization Microsoft PDF
This slide depicts the univariate analysis technique for data visualization, including distribution, box and whisker, and the violin plot.This is a Departments Of Visualization Research Univariate Analysis Techniques For Data Visualization Microsoft PDF template with various stages. Focus and dispense information on three stages using this creative set, that comes with editable features. It contains large content boxes to add your information on topics like Distribution Plot, Box And Whisker Plot, Violin Plot You can also showcase facts, figures, and other relevant content using this PPT layout. Grab it now.

Branches For Visualization Research And Development Lack Of Data Understanding Faced Introduction PDF
This slide depicts the different issues faced by the company in a project, but the lack of data understanding is the primary concern among all. If you are looking for a format to display your unique thoughts, then the professionally designed Branches For Visualization Research And Development Lack Of Data Understanding Faced Introduction PDF is the one for you. You can use it as a Google Slides template or a PowerPoint template. Incorporate impressive visuals, symbols, images, and other charts. Modify or reorganize the text boxes as you desire. Experiment with shade schemes and font pairings. Alter, share or cooperate with other people on your work. Download Branches For Visualization Research And Development Lack Of Data Understanding Faced Introduction PDF and find out how to give a successful presentation. Present a perfect display to your team and make your presentation unforgettable.

Departments Of Visualization Research Bivariate Analysis Techniques For Data Visualization Ideas PDF
This slide describes the second analysis technique, bivariate analysis for data visualization, which includes three plots line, bar, and scatter.This is a Departments Of Visualization Research Bivariate Analysis Techniques For Data Visualization Ideas PDF template with various stages. Focus and dispense information on three stages using this creative set, that comes with editable features. It contains large content boxes to add your information on topics like Effective In Evaluating, Displaying Basic, Range Of Applications, Including You can also showcase facts, figures, and other relevant content using this PPT layout. Grab it now.

Types Of Data For Competitors Intelligence Research Ppt PowerPoint Presentation Summary Templates PDF
Presenting types of data for competitors intelligence research ppt powerpoint presentation summary templates pdf to dispense important information. This template comprises five stages. It also presents valuable insights into the topics including competitor top sellers, competitor market shares, overall market potential, competitor pricing, product line performance. This is a completely customizable PowerPoint theme that can be put to use immediately. So, download it and address the topic impactfully.
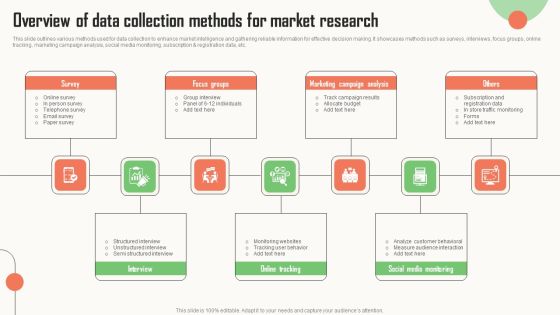
Strategic Market Insight Implementation Guide Overview Of Data Collection Methods For Market Research Demonstration PDF
This slide outlines various methods used for data collection to enhance market intelligence and gathering reliable information for effective decision making. It showcases methods such as surveys, interviews, focus groups, online tracking, marketing campaign analysis, social media monitoring, subscription and registration data, etc. Do you know about Slidesgeeks Strategic Market Insight Implementation Guide Overview Of Data Collection Methods For Market Research Demonstration PDF. These are perfect for delivering any kind od presentation. Using it, create PowerPoint presentations that communicate your ideas and engage audiences. Save time and effort by using our pre designed presentation templates that are perfect for a wide range of topic. Our vast selection of designs covers a range of styles, from creative to business, and are all highly customizable and easy to edit. Download as a PowerPoint template or use them as Google Slides themes.

Departments Of Visualization Research Different Types Of Analysis For Data Visualization Summary PDF
This slide describes the different types of analysis for data visualization, such as univariate analysis, bivariate analysis, and multivariate analysis.This is a Departments Of Visualization Research Different Types Of Analysis For Data Visualization Summary PDF template with various stages. Focus and dispense information on five stages using this creative set, that comes with editable features. It contains large content boxes to add your information on topics like Multivariate Analysis, Assess Practically, Univariate Analysis You can also showcase facts, figures, and other relevant content using this PPT layout. Grab it now.

Data Analytics Management Big Data Management In Healthcare Department Infographics PDF
This slide represents the application of big data in the healthcare department and benefits diagnostics, medicine prevention, medical research, and cost reduction.Deliver and pitch your topic in the best possible manner with this Data Analytics Management Big Data Management In Healthcare Department Infographics PDF. Use them to share invaluable insights on Preventing Medicine, Precision Medicine, Medical Research and impress your audience. This template can be altered and modified as per your expectations. So, grab it now.

Data Lineage For Data Management Professionals Deploying Data Lineage IT Template PDF
This slide showcases the importance of data lineage for data management professionals and caters to their needs, initiatives, benefits, and type of lineage. The requirements include assuring that guidelines are obeyed, analyzing impact and root cause and so on.Whether you have daily or monthly meetings, a brilliant presentation is necessary. Data Lineage For Data Management Professionals Deploying Data Lineage IT Template PDF can be your best option for delivering a presentation. Represent everything in detail using Data Lineage For Data Management Professionals Deploying Data Lineage IT Template PDF and make yourself stand out in meetings. The template is versatile and follows a structure that will cater to your requirements. All the templates prepared by Slidegeeks are easy to download and edit. Our research experts have taken care of the corporate themes as well. So, give it a try and see the results.
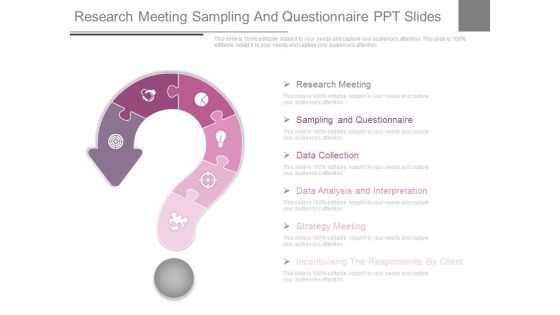
Research Meeting Sampling And Questionnaire Ppt Slides
This is a research meeting sampling and questionnaire ppt slides. This is a six stage process. The stages in this process are sampling and questionnaire, research meeting, data collection, data analysis and interpretation, strategy meeting, incentivising the respondents by client.

Research Meeting Powerpoint Slide Designs Download
This is a research meeting powerpoint slide designs download. This is a six stage process. The stages in this process are research meeting, sampling and questionnaire, strategy meeting, data collection, incentivising the respondents by client, data analysis and interpretation.
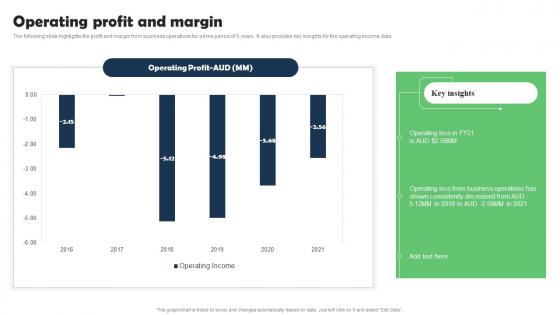
Operating Profit And Margin Marketing Research Services Management Business Pictures Pdf
The following slide highlights the profit and margin from business operations for a time period of 6 years. It also provides key insights for the operating income data. The Operating Profit And Margin Marketing Research Services Management Business Pictures Pdf is a compilation of the most recent design trends as a series of slides. It is suitable for any subject or industry presentation, containing attractive visuals and photo spots for businesses to clearly express their messages. This template contains a variety of slides for the user to input data, such as structures to contrast two elements, bullet points, and slides for written information. Slidegeeks is prepared to create an impression.

Choosing An Area Of Research Powerpoint Slides
This is a choosing an area of research powerpoint slides. This is a five stage process. The stages in this process are choosing an area of research, choosing method of data collection, review of studies, sources of feedback, complete proposal.

Market Research Analysis Template Presentation Powerpoint
This is a market research analysis template presentation powerpoint. This is a five stage process. The stages in this process are market research data analysis, web survey analysis, product research, data processing, brand valuation, market research analysis.
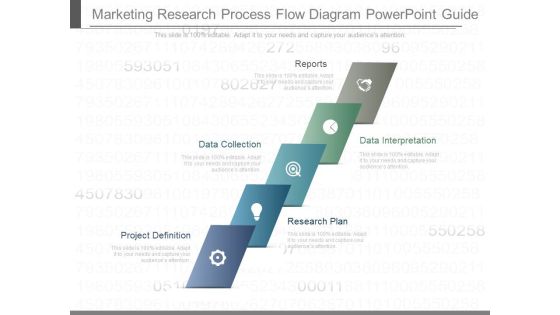
Marketing Research Process Flow Diagram Powerpoint Guide
This is a marketing research process flow diagram powerpoint guide. This is a five stage process. The stages in this process are reports, data interpretation, data collection, research plan, project definition.

Market Research Study Template Ppt Sample
This is a market research study template ppt sample. This is a four stage process. The stages in this process are market size estimation, market crack down and data triangulation, market forecast model, key data points.
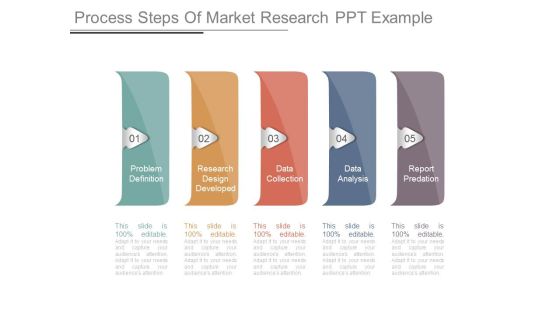
Process Steps Of Market Research Ppt Example
This is a process steps of market research ppt example. This is a five stage process. The stages in this process are problem definition, research design developed, data collection, data analysis, report predation.

Marketing Report For Research Ppt Powerpoint Ideas
This is a marketing report for research ppt powerpoint ideas. This is a five stage process. The stages in this process are project definition, research plan, data collection, data interpretation, summary.
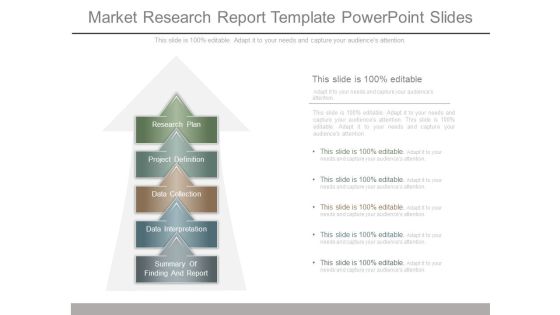
Market Research Report Template Powerpoint Slides
This is a market research report template powerpoint slides. This is a five stage process. The stages in this process are research plan, project definition, data collection, data interpretation, summary of finding and report.
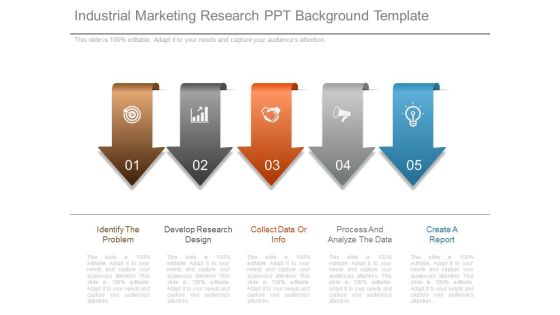
Industrial Marketing Research Ppt Background Template
This is a industrial marketing research ppt background template. This is a five stage process. The stages in this process are identify the problem, develop research design, collect data or info, process and analyze the data, create a report.

Audience Research Ppt PowerPoint Presentation Infographic Template
This is a audience research ppt powerpoint presentation infographic template. This is a five stage process. The stages in this process are mind map, process, success, strategy, analysis.
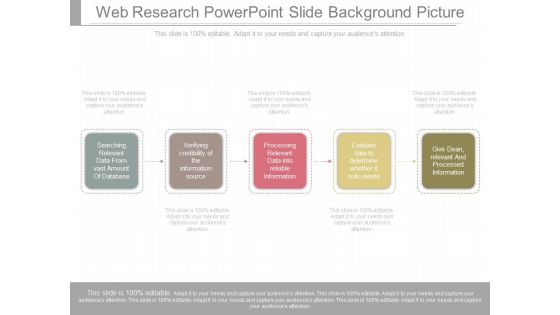
Web Research Powerpoint Slide Background Picture
This is a web research powerpoint slide background picture. This is a five stage process. The stages in this process are searching relevant data from vast amount of database, verifying credibility of the information source, processing relevant data into reliable information, evaluate data to determine whether it suits needs, give dean relevant and processed information.
Data And Scientific Capability Management Six Months Roadmap Icons
We present our data and scientific capability management six months roadmap icons. This PowerPoint layout is easy to edit so you can change the font size, font type, color, and shape conveniently. In addition to this, the PowerPoint layout is Google Slides compatible, so you can share it with your audience and give them access to edit it. Therefore, download and save this well researched data and scientific capability management six months roadmap icons in different formats like PDF, PNG, and JPG to smoothly execute your business plan.

Our Research Results Ppt PowerPoint Presentation Model
This is a our research results ppt powerpoint presentation model. This is a four stage process. The stages in this process are research, financials, business, marketing, management, success.

Creating Positioning Techniques For Market Research Best Tools To Conduct Market Research Social Media Research Icons PDF
The following slide outlines comparative assessment of various online survey tools through which researchers can gather data in real time. The comparison is drawn on basis of features such as online polling, net promoter score NPS survey structure, question branching, poll management, etc.Coming up with a presentation necessitates that the majority of the effort goes into the content and the message you intend to convey. The visuals of a PowerPoint presentation can only be effective if it supplements and supports the story that is being told. Keeping this in mind our experts created Creating Positioning Techniques For Market Research Best Tools To Conduct Market Research Social Media Research Icons PDF to reduce the time that goes into designing the presentation. This way, you can concentrate on the message while our designers take care of providing you with the right template for the situation.

Scope Of Services Research Infographics PDF
Presenting this set of slides with name scope of services research infographics pdf. This is a three stage process. The stages in this process are competitor analysis, research, depth analysis of companys website and online presence. This is a completely editable PowerPoint presentation and is available for immediate download. Download now and impress your audience.

Business Research Process Diagram Ppt Example
This is a business research process diagram ppt example. This is a five stage process. The stages in this process are business issues decision, analysis and reporting, data collection, questionnaire development, research objectives methodology.

Market Research And Analysis Diagram Ppt Sample
This is a market research and analysis diagram ppt sample. This is a five stage process. The stages in this process are location analysis, data mining, sowt analysis, market research and analysis, competition analysis, marketing potential.

Choosing An Area Of Research Powerpoint Show
This is a choosing an area of research powerpoint show. This is a five stage process. The stages in this process are choosing an area of research, review of studies, sources of feedback, complete proposal, choosing method of data collection.

Investment Research Example Diagram Ppt Example File
This is a investment research example diagram ppt example file. This is a four stage process. The stages in this process are research reports, data and pricing, education, investment tools.
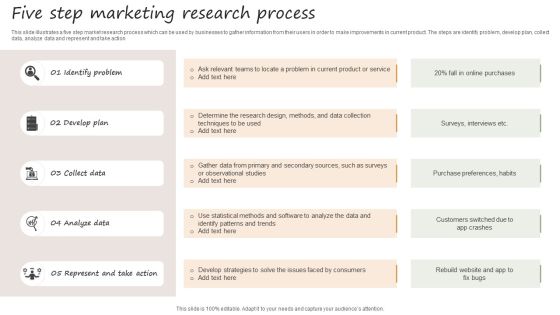
Five Step Marketing Research Process Formats PDF
This slide illustrates a five step market research process which can be used by businesses to gather information from their users in order to make improvements in current product. The steps are identify problem, develop plan, collect data, analyze data and represent and take action. Persuade your audience using this Five Step Marketing Research Process Formats PDF. This PPT design covers five stages, thus making it a great tool to use. It also caters to a variety of topics including Identify Problem, Develop Plan, Collect Data. Download this PPT design now to present a convincing pitch that not only emphasizes the topic but also showcases your presentation skills.

Business Accounting Research Topics Ppt Presentation
This is a business accounting research topics ppt presentation. This is a six stage process. The stages in this process are management information systems, finance, multidisciplinary majors, management, accounting, marketing, business majors.
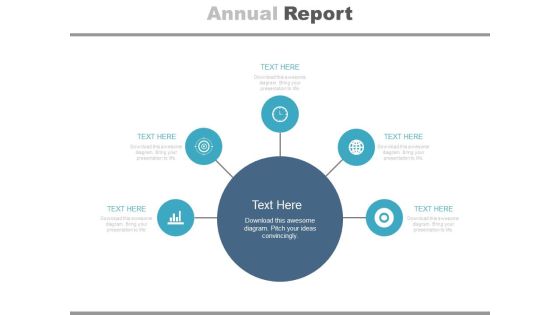
Diagram For Market Research Analysis Powerpoint Slides
This PowerPoint template has been designed with circular infographic diagram. It can be used to display steps for market research and also for financial data analysis. You can download finance PowerPoint template to prepare awesome presentations.

Research Business Intelligence Ppt Powerpoint Templates
This is a research business intelligence ppt powerpoint templates. This is a seven stage process. The stages in this process are data warehousing, reporting, analytics, datamining, qap, epr, benchmarking.

Qualitative Market Research Diagram Ppt Presentation
This is a qualitative market research diagram ppt presentation. This is a five stage process. The stages in this process are qualitative, data collection tools, online communities, web survey chat, online forums, focus groups, depth interviews triads dyads.

Market Research Growth Reporting Workflow Infographics PDF
This slide shows market research development workflow for identifying new areas of . It include phases such as data collection, pre-processing data and analyzing date etc. Showcasing this set of slides titled Market Research Growth Reporting Workflow Infographics PDF. The topics addressed in these templates are Processing Cleaning, Language Filtration, Information Database. All the content presented in this PPT design is completely editable. Download it and make adjustments in color, background, font etc. as per your unique business setting.
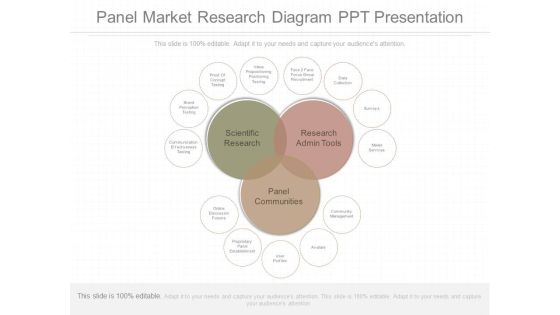
Panel Market Research Diagram Ppt Presentation
This is a panel market research diagram ppt presentation. This is a three stage process. The stages in this process are scientific research, research admin tools, panel communities, online discussion forums, proprietary panel establishment, user profiles, avatars, community management, communication effectiveness testing, brand perception testing, proof of concept testing, value propositioning positioning testing, face two face focus group recruitment, data collection, surveys, mailer services.

Worldwide Market Research Process Framework Diagrams PDF
This slide shows global market research framework for initiating the process and evaluating findings of problem. It include steps like setting research objectives, finalizing research design and specifying data collection tools etc Persuade your audience using this Worldwide Market Research Process Framework Diagrams PDF. This PPT design covers four stages, thus making it a great tool to use. It also caters to a variety of topics including Research Design, Collection Tools, Data Analysis. Download this PPT design now to present a convincing pitch that not only emphasizes the topic but also showcases your presentation skills.

Quantitative Market Research Survey Results Structure PDF
This slide showcases market survey conducted and data gathered by various people to know the topics that drive better customer engagement. It also covers the location of the users. Pitch your topic with ease and precision using this Quantitative Market Research Survey Results Structure PDF. This layout presents information on Marketing Manager, Customer Support, Data Analyst. It is also available for immediate download and adjustment. So, changes can be made in the color, design, graphics or any other component to create a unique layout.
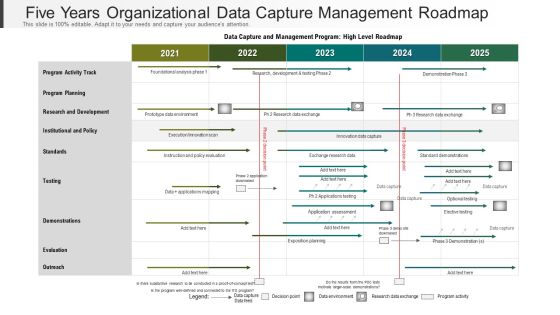
Five Years Organizational Data Capture Management Roadmap Portrait
We present our five years organizational data capture management roadmap portrait. This PowerPoint layout is easy to edit so you can change the font size, font type, color, and shape conveniently. In addition to this, the PowerPoint layout is Google Slides compatible, so you can share it with your audience and give them access to edit it. Therefore, download and save this well researched five years organizational data capture management roadmap portrait in different formats like PDF, PNG, and JPG to smoothly execute your business plan.

Half Yearly Organizational Data Capture Management Roadmap Infographics
We present our half yearly organizational data capture management roadmap infographics. This PowerPoint layout is easy to edit so you can change the font size, font type, color, and shape conveniently. In addition to this, the PowerPoint layout is Google Slides compatible, so you can share it with your audience and give them access to edit it. Therefore, download and save this well researched half yearly organizational data capture management roadmap infographics in different formats like PDF, PNG, and JPG to smoothly execute your business plan.

Six Months Organizational Data Capture Management Roadmap Mockup
We present our six months organizational data capture management roadmap mockup. This PowerPoint layout is easy to edit so you can change the font size, font type, color, and shape conveniently. In addition to this, the PowerPoint layout is Google Slides compatible, so you can share it with your audience and give them access to edit it. Therefore, download and save this well researched six months organizational data capture management roadmap mockup in different formats like PDF, PNG, and JPG to smoothly execute your business plan.
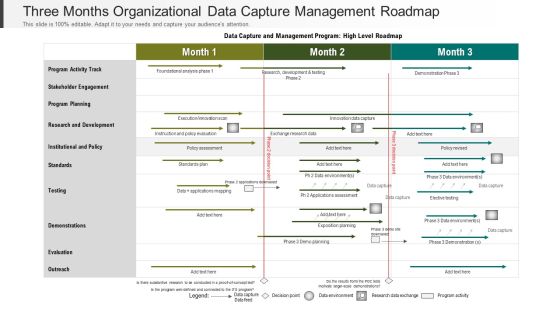
Three Months Organizational Data Capture Management Roadmap Themes
We present our three months organizational data capture management roadmap themes. This PowerPoint layout is easy to edit so you can change the font size, font type, color, and shape conveniently. In addition to this, the PowerPoint layout is Google Slides compatible, so you can share it with your audience and give them access to edit it. Therefore, download and save this well researched three months organizational data capture management roadmap themes in different formats like PDF, PNG, and JPG to smoothly execute your business plan.

Market Research Databases Example Diagram Ppt Samples
This is a market research databases example diagram ppt samples. This is a four stage process. The stages in this process are survey data plus rich engagement, excellent use of emails from a database, focus groups that transcend geography, market research databases, enables repeat conversations and inquiries.

Observation Methods In Research Methodology Ppt Samples
This is a observation methods in research methodology ppt samples. This is a five stage process. The stages in this process are industry events, industry expertise, proprietary contents, surveys, management assess.

Tableau As Visualization Research Tool Inspiration PDF
This slide shows the tableau visualization research tool in which users can construct and share interactive and editable dashboards that represent data in charts. Find highly impressive Tableau As Visualization Research Tool Inspiration PDF on Slidegeeks to deliver a meaningful presentation. You can save an ample amount of time using these presentation templates. No need to worry to prepare everything from scratch because Slidegeeks experts have already done a huge research and work for you. You need to download Tableau As Visualization Research Tool Inspiration PDF for your upcoming presentation. All the presentation templates are 100 percent editable and you can change the color and personalize the content accordingly. Download now.
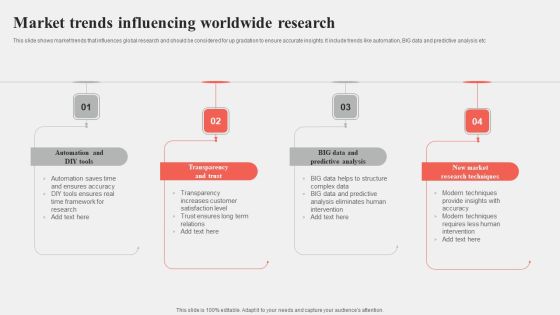
Market Trends Influencing Worldwide Research Themes PDF
This slide shows market trends that influences global research and should be considered for up gradation to ensure accurate insights. It include trends like automation, BIG data and predictive analysis etc Persuade your audience using this Market Trends Influencing Worldwide Research Themes PDF. This PPT design covers four stages, thus making it a great tool to use. It also caters to a variety of topics including Transparency, Predictive Analysis, Research Techniques. Download this PPT design now to present a convincing pitch that not only emphasizes the topic but also showcases your presentation skills.

Business Research Study Design Powerpoint Slides
This is a business research study design powerpoint slides. This is a six stage process. The stages in this process are customer base management and development, financial and economic analysis in communities, government based planning and development analysis, market segmentation and analysis, scientific research study design and analysis, real estate development and analysis.
Grid Computing In Scientific Research Icons PDF
This slide represents the application of grid computing in scientific research collaboration, which requires enormous storage space as they generate massive amounts of data regularly. Grid computing enables resource sharing by joining a single virtual organization. Retrieve professionally designed Grid Computing In Scientific Research Icons PDF to effectively convey your message and captivate your listeners. Save time by selecting pre made slideshows that are appropriate for various topics, from business to educational purposes. These themes come in many different styles, from creative to corporate, and all of them are easily adjustable and can be edited quickly. Access them as PowerPoint templates or as Google Slides themes. You do not have to go on a hunt for the perfect presentation because Slidegeeks got you covered from everywhere.
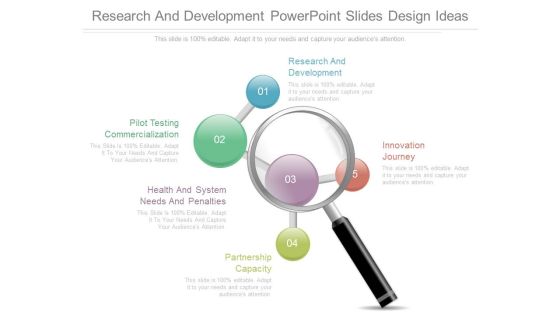
Research And Development Powerpoint Slides Design Ideas
This is a research and development powerpoint slides design ideas. This is a five stage process. The stages in this process are research and development, innovation journey, pilot testing commercialization, health and system needs and penalties, partnership capacity.

Custom Market Research Format Diagram Presentation Ideas
This is a custom market research format diagram presentation ideas. This is a six stage process. The stages in this process are markets, products, industries, customers, vendors, competitors, custom market research.
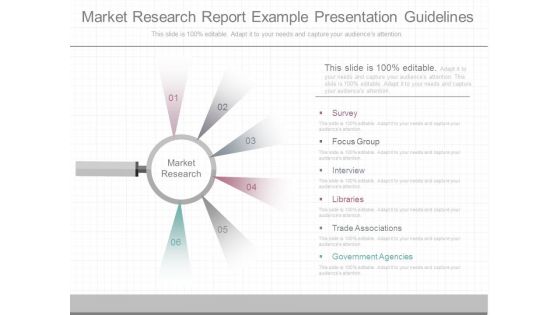
Market Research Report Example Presentation Guidelines
This is a market research report example presentation guidelines. This is a six stage process. The stages in this process are market research, survey, focus group, interview, libraries, trade associations, government agencies.
Global Market Research Layout Ppt Slides
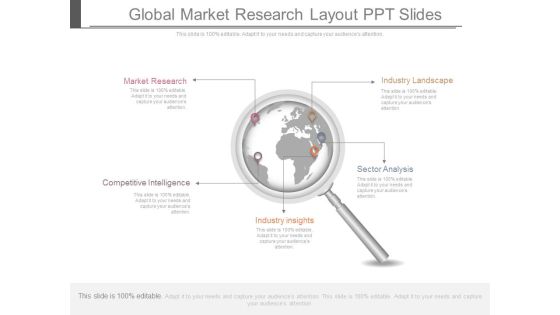
This is a global market research layout ppt slides. This is a five stage process. The stages in this process are market research, industry landscape, competitive intelligence, sector analysis, industry insights.

Market Research Steps Diagram Ppt Example File
This is a market research steps diagram ppt example file. This is a four stage process. The stages in this process are define the problem, establish research objective, collect data, analyze data.
Limitations Of Research Study Powerpoint Slide
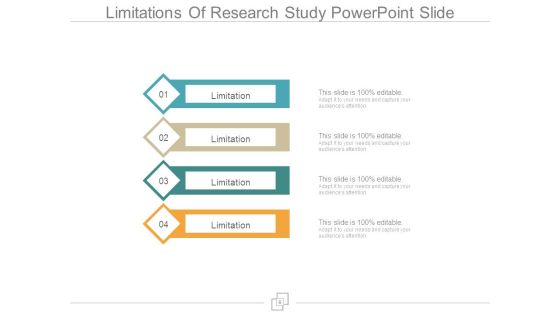
This is a limitations of research study powerpoint slide. This is a four stage process. The stages in this process are business, marketing, research, technology, management.

Market Research Analyst Layout Ppt Templates
This is a market research analyst layout ppt templates. This is a five stage process. The stages in this process are problem definition, specifying research objectives, creating the research design, collect the data, analyze and evaluate result.
Market Intelligence Versus Marketing Research Ppt Slides
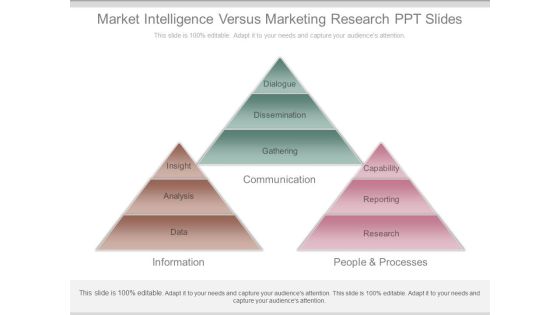
This is a market intelligence versus marketing research ppt slides. This is a three stage process. The stages in this process are dialogue, dissemination, gathering, communication, insight, analysis, data, information, capability, reporting, research, people and processes.
Web Business Market Research Example Powerpoint Slides
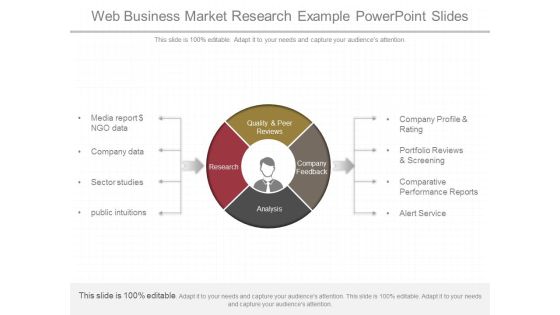
This is a web business market research example powerpoint slides. This is a four stage process. The stages in this process are company profile and rating, portfolio reviews and screening, comparative performance reports, alert service, public intuitions, sector studies, company data, media report dollar ngo data, quality and peer reviews, company feedback, analysis, research.

Market Research Applications Ppt Background Designs
This is a market research applications ppt background designs. This is a six stage process. The stages in this process are market and customer analysis, product research, pricing research, promotional research, location research.

5 Step Market Research Steps Download PDF
This slide highlights the five-step marketing research process to supervise and conduct a reasonably satisfactory search for the information needed. It includes steps such as problem definition, specifying research objectives, creating the research design, collecting the data, and evaluating results. Showcasing this set of slides titled 5 Step Market Research Steps Download PDF. The topics addressed in these templates are Problem Definition, Data, Design. All the content presented in this PPT design is completely editable. Download it and make adjustments in color, background, font etc. as per your unique business setting.

Internet Market Research Layout Ppt Slides
This is a internet market research layout ppt slides. This is a five stage process. The stages in this process are pestle analysis, competitor analysis, usage analysis, cookie data, online questionnaires.
Focus Groups Market Research Diagram Ppt Slides
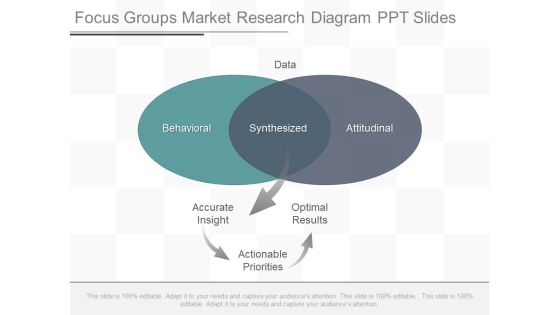
This is a focus groups market research diagram ppt slides. This is a two stage process. The stages in this process are data, behavioral, synthesized, attitudinal, accurate insight, optimal results, actionable priorities.
Net Income And Profit Marketing Research Services Management Business Information Pdf
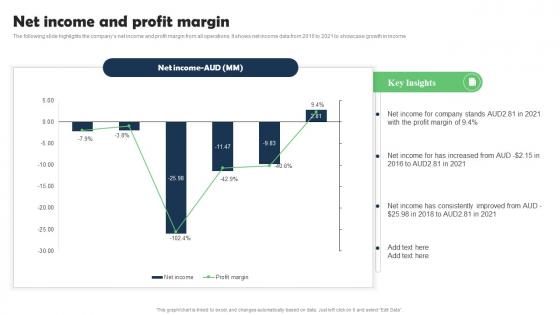
The following slide highlights the companys net income and profit margin from all operations. It shows net income data from 2016 to 2021 to showcase growth in income. Explore a selection of the finest Net Income And Profit Marketing Research Services Management Business Information Pdf here. With a plethora of professionally designed and pre-made slide templates, you can quickly and easily find the right one for your upcoming presentation. You can use our Net Income And Profit Marketing Research Services Management Business Information Pdf to effectively convey your message to a wider audience. Slidegeeks has done a lot of research before preparing these presentation templates. The content can be personalized and the slides are highly editable. Grab templates today from Slidegeeks.

Channel Research And Analysis Power Point Layout
This is a channel research and analysis power point layout. This is a six stage process. The stages in this process are channel research and analysis, channel and partner programs, framework and methodologies, program and asset development, program management, channel optimization.
Market Research And Statistics Ppt Sample Presentations
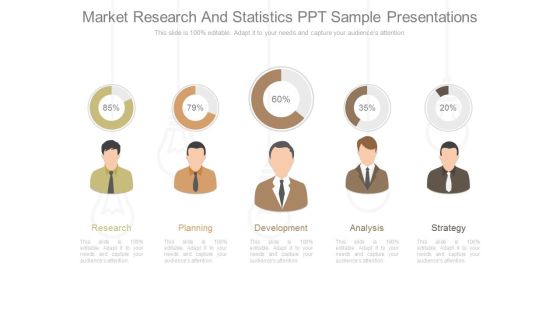
This is a market research and statistics ppt sample presentations. This is a five stage process. The stages in this process are research, planning, development, analysis, strategy.
Secondary Research Powerpoint Slide Background Designs
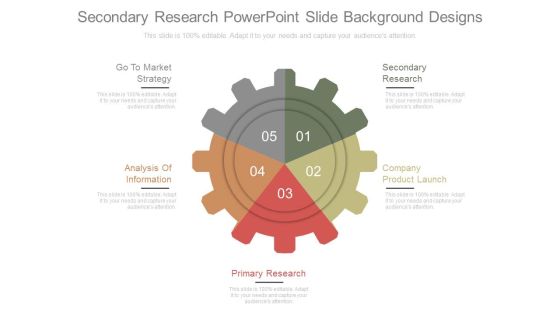
This is a secondary research powerpoint slide background designs. This is a five stage process. The stages in this process are go to market strategy, analysis of information, secondary research, company product launch, primary research.
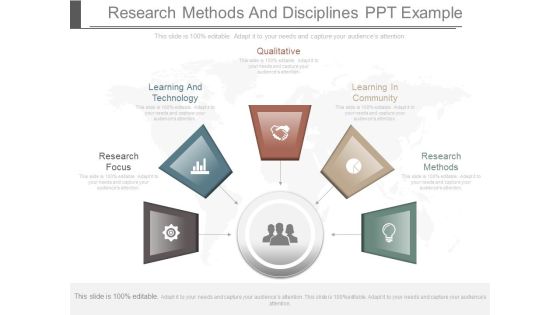
Research Methods And Disciplines Ppt Example
This is a research methods and disciplines ppt example. This is a five stage process. The stages in this process are research focus, learning and technology, qualitative, learning in community, research methods.

Research Methods And Disciplines Presentation Slides
This is a research methods and disciplines presentation slides. This is a five stage process. The stages in this process are qualitative, research focus, learning in community, learning and technology, research methods.

Analytical Research Report Ppt Background Designs
This is a analytical research report ppt background designs. This is a six stage process. The stages in this process are reflection and implementation, act to implement your plan, devise a plan, reflect and share, observe collect and analyze your data, identify the problem.
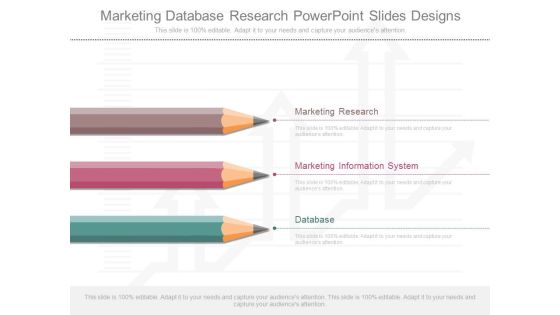
Marketing Database Research Powerpoint Slides Designs
This is a marketing database research powerpoint slides designs. This is a three stage process. The stages in this process are marketing research, marketing information system, database.
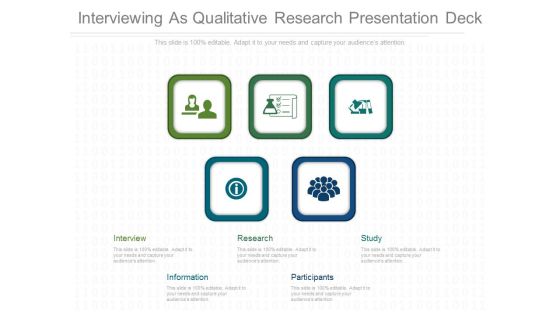
Interviewing As Qualitative Research Presentation Deck
This is a interviewing as qualitative research presentation deck. This is a five stage process. The stages in this process are interview, information, research, participants, study.

 Home
Home