Real Estate Dashboard
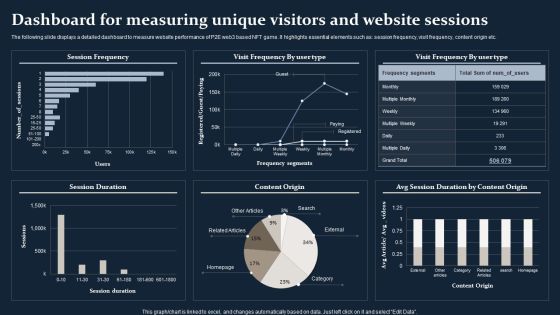
Smartphone Game Development And Advertising Technique Dashboard For Measuring Unique Visitors Brochure PDF
Crafting an eye catching presentation has never been more straightforward. Let your presentation shine with this tasteful yet straightforward Smartphone Game Development And Advertising Technique Dashboard For Measuring Unique Visitors Brochure PDF template. It offers a minimalistic and classy look that is great for making a statement. The colors have been employed intelligently to add a bit of playfulness while still remaining professional. Construct the ideal Smartphone Game Development And Advertising Technique Dashboard For Measuring Unique Visitors Brochure PDF that effortlessly grabs the attention of your audience. Begin now and be certain to wow your customers.

IT System Risk Management Guide IT Risk Management Dashboard Highlighting Network Devices Server Status Elements PDF
The following slide highlights the information technology dashboard for risk management which includes devices, workstations status, unmonitored devices, last reboot time and problem servers. If you are looking for a format to display your unique thoughts, then the professionally designed IT System Risk Management Guide IT Risk Management Dashboard Highlighting Network Devices Server Status Elements PDF is the one for you. You can use it as a Google Slides template or a PowerPoint template. Incorporate impressive visuals, symbols, images, and other charts. Modify or reorganize the text boxes as you desire. Experiment with shade schemes and font pairings. Alter, share or cooperate with other people on your work. Download IT System Risk Management Guide IT Risk Management Dashboard Highlighting Network Devices Server Status Elements PDF and find out how to give a successful presentation. Present a perfect display to your team and make your presentation unforgettable.

Cios Guide To Optimize Determine IT Spending Management Dashboard Portrait PDF
This slide provides information regarding IT spending management dashboard for tracking parameters such as asset controller, cost by service, potential savings, etc. If you are looking for a format to display your unique thoughts, then the professionally designed Cios Guide To Optimize Determine IT Spending Management Dashboard Portrait PDF is the one for you. You can use it as a Google Slides template or a PowerPoint template. Incorporate impressive visuals, symbols, images, and other charts. Modify or reorganize the text boxes as you desire. Experiment with shade schemes and font pairings. Alter, share or cooperate with other people on your work. Download Cios Guide To Optimize Determine IT Spending Management Dashboard Portrait PDF and find out how to give a successful presentation. Present a perfect display to your team and make your presentation unforgettable.
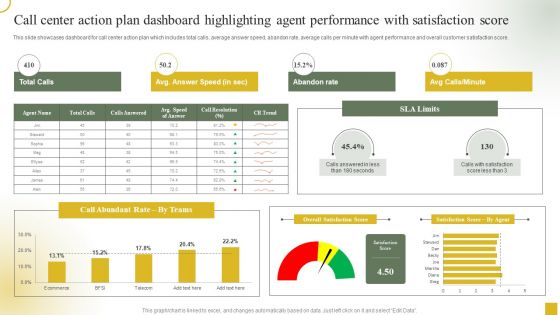
Call Center Action Plan Dashboard Highlighting Agent Performance With Satisfaction Score Information PDF
This slide showcases dashboard for call center action plan which includes total calls, average answer speed, abandon rate, average calls per minute with agent performance and overall customer satisfaction score. If you are looking for a format to display your unique thoughts, then the professionally designed Call Center Action Plan Dashboard Highlighting Agent Performance With Satisfaction Score Information PDF is the one for you. You can use it as a Google Slides template or a PowerPoint template. Incorporate impressive visuals, symbols, images, and other charts. Modify or reorganize the text boxes as you desire. Experiment with shade schemes and font pairings. Alter, share or cooperate with other people on your work. Download Call Center Action Plan Dashboard Highlighting Agent Performance With Satisfaction Score Information PDF and find out how to give a successful presentation. Present a perfect display to your team and make your presentation unforgettable.
Efficient Administration Of Product Business And Umbrella Branding Activity Tracking Dashboard For Umbrella Brand Icons PDF
This slide provides information regarding activities tracking dashboard for umbrella brand in terms of customer retention, market share, etc. If you are looking for a format to display your unique thoughts, then the professionally designed Efficient Administration Of Product Business And Umbrella Branding Activity Tracking Dashboard For Umbrella Brand Icons PDF is the one for you. You can use it as a Google Slides template or a PowerPoint template. Incorporate impressive visuals, symbols, images, and other charts. Modify or reorganize the text boxes as you desire. Experiment with shade schemes and font pairings. Alter, share or cooperate with other people on your work. Download Efficient Administration Of Product Business And Umbrella Branding Activity Tracking Dashboard For Umbrella Brand Icons PDF and find out how to give a successful presentation. Present a perfect display to your team and make your presentation unforgettable.

Collaborative Robots IT Dashboard To Track Cobot Performance Ppt Slides Guidelines PDF
This slide represents the cobots performance dashboard by covering details of battery level, performance, total hours, average time, time to return, energy consumption, and so on. If you are looking for a format to display your unique thoughts, then the professionally designed Collaborative Robots IT Dashboard To Track Cobot Performance Ppt Slides Guidelines PDF is the one for you. You can use it as a Google Slides template or a PowerPoint template. Incorporate impressive visuals, symbols, images, and other charts. Modify or reorganize the text boxes as you desire. Experiment with shade schemes and font pairings. Alter, share or cooperate with other people on your work. Download Collaborative Robots IT Dashboard To Track Cobot Performance Ppt Slides Guidelines PDF and find out how to give a successful presentation. Present a perfect display to your team and make your presentation unforgettable.
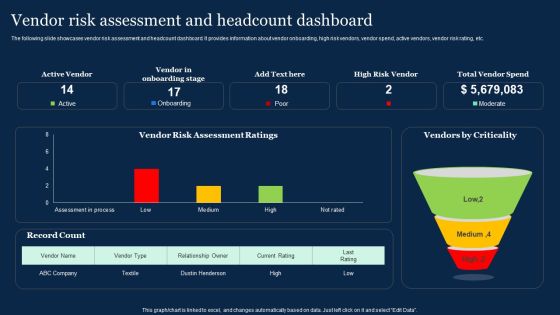
Vendor Risk Assessment And Headcount Dashboard Effective Vendor Management For Enhancing Elements PDF
The following slide showcases vendor risk assessment and headcount dashboard. It provides information about vendor onboarding, high risk vendors, vendor spend, active vendors, vendor risk rating, etc. If you are looking for a format to display your unique thoughts, then the professionally designed Vendor Risk Assessment And Headcount Dashboard Effective Vendor Management For Enhancing Elements PDF is the one for you. You can use it as a Google Slides template or a PowerPoint template. Incorporate impressive visuals, symbols, images, and other charts. Modify or reorganize the text boxes as you desire. Experiment with shade schemes and font pairings. Alter, share or cooperate with other people on your work. Download Vendor Risk Assessment And Headcount Dashboard Effective Vendor Management For Enhancing Elements PDF and find out how to give a successful presentation. Present a perfect display to your team and make your presentation unforgettable.

Agile Playbook For Program Designers Software Development Dashboard Ppt Infographics Brochure PDF
This slide covers software evaluation dashboard including spring details, team details to evaluate the project while proceeding to closure. If you are looking for a format to display your unique thoughts, then the professionally designed Agile Playbook For Program Designers Software Development Dashboard Ppt Infographics Brochure PDF is the one for you. You can use it as a Google Slides template or a PowerPoint template. Incorporate impressive visuals, symbols, images, and other charts. Modify or reorganize the text boxes as you desire. Experiment with shade schemes and font pairings. Alter, share or cooperate with other people on your work. Download Agile Playbook For Program Designers Software Development Dashboard Ppt Infographics Brochure PDF and find out how to give a successful presentation. Present a perfect display to your team and make your presentation unforgettable.

Using Social Media Platforms To Enhance Dashboard For Monitoring Social Media Traffic Structure PDF
This slide shows dashboard for tracking social media traffic. It provides details about sessions, bounce rate, average time on platform, pages per visit, clicks, goals, goal conversion rate, Facebook, Instagram, YouTube, Snapchat, etc. If you are looking for a format to display your unique thoughts, then the professionally designed Using Social Media Platforms To Enhance Dashboard For Monitoring Social Media Traffic Structure PDF is the one for you. You can use it as a Google Slides template or a PowerPoint template. Incorporate impressive visuals, symbols, images, and other charts. Modify or reorganize the text boxes as you desire. Experiment with shade schemes and font pairings. Alter, share or cooperate with other people on your work. Download Using Social Media Platforms To Enhance Dashboard For Monitoring Social Media Traffic Structure PDF and find out how to give a successful presentation. Present a perfect display to your team and make your presentation unforgettable.

Dashboard For Cloud Storage Tracking Ppt PowerPoint Presentation File Layouts PDF
This slide represents the dashboard for cloud storage tracking by covering details of users, available workspaces, shared files, downloads, uploads, and moves. If you are looking for a format to display your unique thoughts, then the professionally designed Dashboard For Cloud Storage Tracking Ppt PowerPoint Presentation File Layouts PDF is the one for you. You can use it as a Google Slides template or a PowerPoint template. Incorporate impressive visuals, symbols, images, and other charts. Modify or reorganize the text boxes as you desire. Experiment with shade schemes and font pairings. Alter, share or cooperate with other people on your work. Download Dashboard For Cloud Storage Tracking Ppt PowerPoint Presentation File Layouts PDF and find out how to give a successful presentation. Present a perfect display to your team and make your presentation unforgettable.

Key CIO Initiatives CIO Dashboard To Track Essential Activities Associated With IT Portrait PDF
This slide provides information regarding dashboard to track various activities related to IT in terms of incident management, continuous improvement management, etc. If you are looking for a format to display your unique thoughts, then the professionally designed Key CIO Initiatives CIO Dashboard To Track Essential Activities Associated With IT Portrait PDF is the one for you. You can use it as a Google Slides template or a PowerPoint template. Incorporate impressive visuals, symbols, images, and other charts. Modify or reorganize the text boxes as you desire. Experiment with shade schemes and font pairings. Alter, share or cooperate with other people on your work. Download Key CIO Initiatives CIO Dashboard To Track Essential Activities Associated With IT Portrait PDF and find out how to give a successful presentation. Present a perfect display to your team and make your presentation unforgettable.

Cloud Dashboard For Tracking Project Sprints Ppt PowerPoint Presentation File Layouts PDF
The following slide depicts cloud dashboard for monitoring project sprints. It provides information about sprint blockers, resolved issues, under performers, sprint health, releases, sprint burndown, etc. If you are looking for a format to display your unique thoughts, then the professionally designed Cloud Dashboard For Tracking Project Sprints Ppt PowerPoint Presentation File Layouts PDF is the one for you. You can use it as a Google Slides template or a PowerPoint template. Incorporate impressive visuals, symbols, images, and other charts. Modify or reorganize the text boxes as you desire. Experiment with shade schemes and font pairings. Alter, share or cooperate with other people on your work. Download Cloud Dashboard For Tracking Project Sprints Ppt PowerPoint Presentation File Layouts PDF and find out how to give a successful presentation. Present a perfect display to your team and make your presentation unforgettable.

Brand Marketing Strategy Dashboard To Track Online Brand Marketing Campaigns Template PDF
This slide showcases dashboard that can help organization to track the results of online brand marketing campaigns. Its key elements are leads breakdown,web traffic, lead to trial, organic search, website traffic, web users etc. If you are looking for a format to display your unique thoughts, then the professionally designed Brand Marketing Strategy Dashboard To Track Online Brand Marketing Campaigns Template PDF is the one for you. You can use it as a Google Slides template or a PowerPoint template. Incorporate impressive visuals, symbols, images, and other charts. Modify or reorganize the text boxes as you desire. Experiment with shade schemes and font pairings. Alter, share or cooperate with other people on your work. Download Brand Marketing Strategy Dashboard To Track Online Brand Marketing Campaigns Template PDF and find out how to give a successful presentation. Present a perfect display to your team and make your presentation unforgettable.

Brand Marketing Strategy Dashboard To Track Traffic On Brand Website Template PDF
This slide showcases dashboard that can help organization to analyze and evaluate the website traffic after new brand launch. Its key elements are unique page views, average time on page, channel sessions, page views, bounce rate etc. If you are looking for a format to display your unique thoughts, then the professionally designed Brand Marketing Strategy Dashboard To Track Traffic On Brand Website Template PDF is the one for you. You can use it as a Google Slides template or a PowerPoint template. Incorporate impressive visuals, symbols, images, and other charts. Modify or reorganize the text boxes as you desire. Experiment with shade schemes and font pairings. Alter, share or cooperate with other people on your work. Download Brand Marketing Strategy Dashboard To Track Traffic On Brand Website Template PDF and find out how to give a successful presentation. Present a perfect display to your team and make your presentation unforgettable.

Corporate Branding Performance Tracking Dashboard Corporate Branding Strategy To Revitalize Business Identity Slides PDF
This slide provides information regarding corporate branding performance tracking dashboard in terms of leads, conversion metrics, web traffic, etc. If you are looking for a format to display your unique thoughts, then the professionally designed Corporate Branding Performance Tracking Dashboard Corporate Branding Strategy To Revitalize Business Identity Slides PDF is the one for you. You can use it as a Google Slides template or a PowerPoint template. Incorporate impressive visuals, symbols, images, and other charts. Modify or reorganize the text boxes as you desire. Experiment with shade schemes and font pairings. Alter, share or cooperate with other people on your work. Download Corporate Branding Performance Tracking Dashboard Corporate Branding Strategy To Revitalize Business Identity Slides PDF and find out how to give a successful presentation. Present a perfect display to your team and make your presentation unforgettable.

Top SEO Techniques Seo Reporting Dashboard To Evaluate Website Rank Ideas PDF
The purpose of this slide is to outline mobile search engine optimization SEO reporting dashboard. It covers different metrics such as web traffic overview, total views, content overview, goal value and conversion etc. If you are looking for a format to display your unique thoughts, then the professionally designed Top SEO Techniques Seo Reporting Dashboard To Evaluate Website Rank Ideas PDF is the one for you. You can use it as a Google Slides template or a PowerPoint template. Incorporate impressive visuals, symbols, images, and other charts. Modify or reorganize the text boxes as you desire. Experiment with shade schemes and font pairings. Alter, share or cooperate with other people on your work. Download Top SEO Techniques Seo Reporting Dashboard To Evaluate Website Rank Ideas PDF and find out how to give a successful presentation. Present a perfect display to your team and make your presentation unforgettable.

Customer Service Plan To Improve Sales Dashboard Depicting Customer Service Insights Inspiration PDF
This slide shows the dashboard that depicts customer service insights which includes number of solved tickets, average resolution and response time, customer feedback, total visitors and chats. If you are looking for a format to display your unique thoughts, then the professionally designed Customer Service Plan To Improve Sales Dashboard Depicting Customer Service Insights Inspiration PDF is the one for you. You can use it as a Google Slides template or a PowerPoint template. Incorporate impressive visuals, symbols, images, and other charts. Modify or reorganize the text boxes as you desire. Experiment with shade schemes and font pairings. Alter, share or cooperate with other people on your work. Download Customer Service Plan To Improve Sales Dashboard Depicting Customer Service Insights Inspiration PDF and find out how to give a successful presentation. Present a perfect display to your team and make your presentation unforgettable.

Optimizing Production Process Smart Manufacturing Dashboard To Track Production Diagrams PDF
This slide represents smart manufacturing dashboard. It covers production volume, downtime causes, top product sold item, sales revenue, active machinery etc. If you are looking for a format to display your unique thoughts, then the professionally designed Optimizing Production Process Smart Manufacturing Dashboard To Track Production Diagrams PDF is the one for you. You can use it as a Google Slides template or a PowerPoint template. Incorporate impressive visuals, symbols, images, and other charts. Modify or reorganize the text boxes as you desire. Experiment with shade schemes and font pairings. Alter, share or cooperate with other people on your work. Download Optimizing Production Process Smart Manufacturing Dashboard To Track Production Diagrams PDF and find out how to give a successful presentation. Present a perfect display to your team and make your presentation unforgettable.

Analyzing The Economic Project Management Dashboard With Budget And Upcoming Graphics PDF
The following slide shows a project management dashboard with information related to project planning, project design, projected launch date, overdue tasks, workload distribution, upcoming deadlines etc. If you are looking for a format to display your unique thoughts, then the professionally designed Analyzing The Economic Project Management Dashboard With Budget And Upcoming Graphics PDF is the one for you. You can use it as a Google Slides template or a PowerPoint template. Incorporate impressive visuals, symbols, images, and other charts. Modify or reorganize the text boxes as you desire. Experiment with shade schemes and font pairings. Alter, share or cooperate with other people on your work. Download Analyzing The Economic Project Management Dashboard With Budget And Upcoming Graphics PDF and find out how to give a successful presentation. Present a perfect display to your team and make your presentation unforgettable.
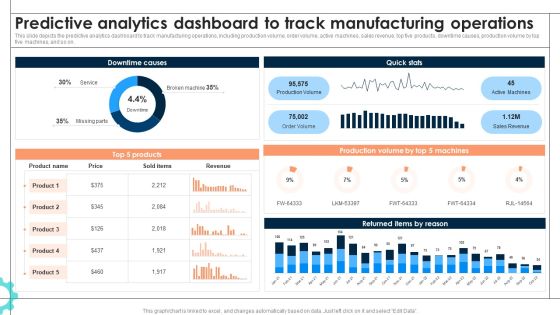
Intelligent Manufacturing Predictive Analytics Dashboard To Track Manufacturing Operations Information PDF
This slide depicts the predictive analytics dashboard to track manufacturing operations, including production volume, order volume, active machines, sales revenue, top five products, downtime causes, production volume by top five machines, and so on. If you are looking for a format to display your unique thoughts, then the professionally designed Intelligent Manufacturing Predictive Analytics Dashboard To Track Manufacturing Operations Information PDF is the one for you. You can use it as a Google Slides template or a PowerPoint template. Incorporate impressive visuals, symbols, images, and other charts. Modify or reorganize the text boxes as you desire. Experiment with shade schemes and font pairings. Alter, share or cooperate with other people on your work. Download Intelligent Manufacturing Predictive Analytics Dashboard To Track Manufacturing Operations Information PDF and find out how to give a successful presentation. Present a perfect display to your team and make your presentation unforgettable.
Product Branding To Enhance Product Branding Performance Tracking Dashboard Graphics PDF
This slide provides information regarding product branding performance tracking dashboard in terms of revenues, new customers, customer satisfaction rate. If you are looking for a format to display your unique thoughts, then the professionally designed Product Branding To Enhance Product Branding Performance Tracking Dashboard Graphics PDF is the one for you. You can use it as a Google Slides template or a PowerPoint template. Incorporate impressive visuals, symbols, images, and other charts. Modify or reorganize the text boxes as you desire. Experiment with shade schemes and font pairings. Alter, share or cooperate with other people on your work. Download Product Branding To Enhance Product Branding Performance Tracking Dashboard Graphics PDF and find out how to give a successful presentation. Present a perfect display to your team and make your presentation unforgettable.
Maximizing Brand Growth With Umbrella Branding Activities Corporate Branding Performance Tracking Dashboard Summary PDF
This slide provides information regarding corporate branding performance tracking dashboard in terms of leads, conversion metrics, web traffic, etc. If you are looking for a format to display your unique thoughts, then the professionally designed Maximizing Brand Growth With Umbrella Branding Activities Corporate Branding Performance Tracking Dashboard Summary PDF is the one for you. You can use it as a Google Slides template or a PowerPoint template. Incorporate impressive visuals, symbols, images, and other charts. Modify or reorganize the text boxes as you desire. Experiment with shade schemes and font pairings. Alter, share or cooperate with other people on your work. Download Maximizing Brand Growth With Umbrella Branding Activities Corporate Branding Performance Tracking Dashboard Summary PDF and find out how to give a successful presentation. Present a perfect display to your team and make your presentation unforgettable.

Agriculture Marketing Strategy To Improve Revenue Performance Dashboard Depicting Production Global Food Market Brochure PDF
This slide provides an overview of the dashboard that exhibits the situation of the global food market. It includes production, import, exports information for wheat, maize, rice and soybean. If you are looking for a format to display your unique thoughts, then the professionally designed Agriculture Marketing Strategy To Improve Revenue Performance Dashboard Depicting Production Global Food Market Brochure PDF is the one for you. You can use it as a Google Slides template or a PowerPoint template. Incorporate impressive visuals, symbols, images, and other charts. Modify or reorganize the text boxes as you desire. Experiment with shade schemes and font pairings. Alter, share or cooperate with other people on your work. Download Agriculture Marketing Strategy To Improve Revenue Performance Dashboard Depicting Production Global Food Market Brochure PDF and find out how to give a successful presentation. Present a perfect display to your team and make your presentation unforgettable.
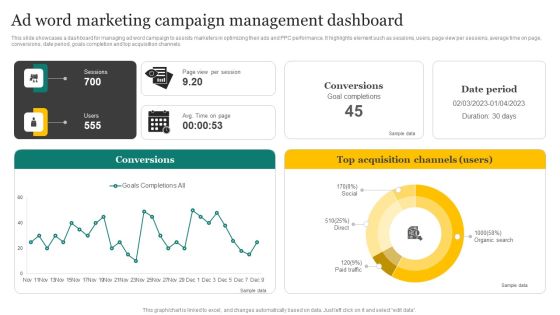
Strategic Promotion Plan Development Stages Ad Word Marketing Campaign Management Dashboard Template PDF
This slide showcases a dashboard for managing ad word campaign to assists marketers in optimizing their ads and PPC performance. It highlights element such as sessions, users, page view per sessions, average time on page, conversions, date period, goals completion and top acquisition channels. If you are looking for a format to display your unique thoughts, then the professionally designed Strategic Promotion Plan Development Stages Ad Word Marketing Campaign Management Dashboard Template PDF is the one for you. You can use it as a Google Slides template or a PowerPoint template. Incorporate impressive visuals, symbols, images, and other charts. Modify or reorganize the text boxes as you desire. Experiment with shade schemes and font pairings. Alter, share or cooperate with other people on your work. Download Strategic Promotion Plan Development Stages Ad Word Marketing Campaign Management Dashboard Template PDF and find out how to give a successful presentation. Present a perfect display to your team and make your presentation unforgettable.

Categories Of Segmenting And Profiling Customers Customer Demographics Segmentation Dashboard Guidelines PDF
This slide showcases a dashboard for segmenting customers based on demographics factors. It includes key components such as make population by age, female population by age, number of male customers and number of female customers. If you are looking for a format to display your unique thoughts, then the professionally designed Categories Of Segmenting And Profiling Customers Customer Demographics Segmentation Dashboard Guidelines PDF is the one for you. You can use it as a Google Slides template or a PowerPoint template. Incorporate impressive visuals, symbols, images, and other charts. Modify or reorganize the text boxes as you desire. Experiment with shade schemes and font pairings. Alter, share or cooperate with other people on your work. Download Categories Of Segmenting And Profiling Customers Customer Demographics Segmentation Dashboard Guidelines PDF and find out how to give a successful presentation. Present a perfect display to your team and make your presentation unforgettable.

Vendor Performance Analysis And Administration Supplier Performance And Order Cycle Time Monitoring Dashboard Themes PDF
The following slide showcases a dashboard to supervise and manage procurement order cycle time an supplier performance. It includes key elements such as defect rate, on time supplies, supplier availability, lead time, supplier defect rate, defect type and delivery time. If you are looking for a format to display your unique thoughts, then the professionally designed Vendor Performance Analysis And Administration Supplier Performance And Order Cycle Time Monitoring Dashboard Themes PDF is the one for you. You can use it as a Google Slides template or a PowerPoint template. Incorporate impressive visuals, symbols, images, and other charts. Modify or reorganize the text boxes as you desire. Experiment with shade schemes and font pairings. Alter, share or cooperate with other people on your work. Download Vendor Performance Analysis And Administration Supplier Performance And Order Cycle Time Monitoring Dashboard Themes PDF and find out how to give a successful presentation. Present a perfect display to your team and make your presentation unforgettable.
Effective Lead Generation For Higher Conversion Rates Dashboard For Tracking Leads Generated From Various Guidelines PDF
This slide covers the KPI dashboard for tracking metrics such as leads, ACV wins, customer acquisition cost, click-through rate, and cost per conversion. It also includes leads per various campaigns such as social media, paid marketing, email marketing, etc. If you are looking for a format to display your unique thoughts, then the professionally designed Effective Lead Generation For Higher Conversion Rates Dashboard For Tracking Leads Generated From Various Guidelines PDF is the one for you. You can use it as a Google Slides template or a PowerPoint template. Incorporate impressive visuals, symbols, images, and other charts. Modify or reorganize the text boxes as you desire. Experiment with shade schemes and font pairings. Alter, share or cooperate with other people on your work. Download Effective Lead Generation For Higher Conversion Rates Dashboard For Tracking Leads Generated From Various Guidelines PDF and find out how to give a successful presentation. Present a perfect display to your team and make your presentation unforgettable.

Dashboard To Identify Brand At Declining Stage With Low Sales Demonstration PDF
This slide covers dashboard to track brand with lowest sales. The purpose of this template is to provide information based on revenue generated annually along with total units sold. It includes tracking based on monthly revenue, unit sales, etc. If you are looking for a format to display your unique thoughts, then the professionally designed Dashboard To Identify Brand At Declining Stage With Low Sales Demonstration PDF is the one for you. You can use it as a Google Slides template or a PowerPoint template. Incorporate impressive visuals, symbols, images, and other charts. Modify or reorganize the text boxes as you desire. Experiment with shade schemes and font pairings. Alter, share or cooperate with other people on your work. Download Dashboard To Identify Brand At Declining Stage With Low Sales Demonstration PDF and find out how to give a successful presentation. Present a perfect display to your team and make your presentation unforgettable.
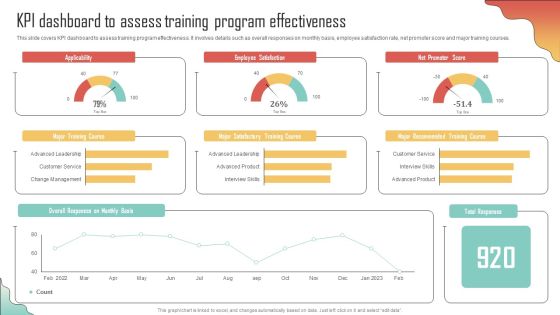
KPI Dashboard Assess Training Program Effectiveness Enhancing Organization Productivity By Implementing Graphics PDF
This slide covers KPI dashboard to assess training program effectiveness. It involves details such as overall responses on monthly basis, employee satisfaction rate, net promoter score and major training courses. If you are looking for a format to display your unique thoughts, then the professionally designed KPI Dashboard Assess Training Program Effectiveness Enhancing Organization Productivity By Implementing Graphics PDF is the one for you. You can use it as a Google Slides template or a PowerPoint template. Incorporate impressive visuals, symbols, images, and other charts. Modify or reorganize the text boxes as you desire. Experiment with shade schemes and font pairings. Alter, share or cooperate with other people on your work. Download KPI Dashboard Assess Training Program Effectiveness Enhancing Organization Productivity By Implementing Graphics PDF and find out how to give a successful presentation. Present a perfect display to your team and make your presentation unforgettable.

Iot Integration In Manufacturing Predictive Analytics Dashboard To Track Manufacturing Operations Background PDF
This slide depicts the predictive analytics dashboard to track manufacturing operations, including production volume, order volume, active machines, sales revenue, top five products, downtime causes, production volume by top five machines, and so on. If you are looking for a format to display your unique thoughts, then the professionally designed Iot Integration In Manufacturing Predictive Analytics Dashboard To Track Manufacturing Operations Background PDF is the one for you. You can use it as a Google Slides template or a PowerPoint template. Incorporate impressive visuals, symbols, images, and other charts. Modify or reorganize the text boxes as you desire. Experiment with shade schemes and font pairings. Alter, share or cooperate with other people on your work. Download Iot Integration In Manufacturing Predictive Analytics Dashboard To Track Manufacturing Operations Background PDF and find out how to give a successful presentation. Present a perfect display to your team and make your presentation unforgettable.
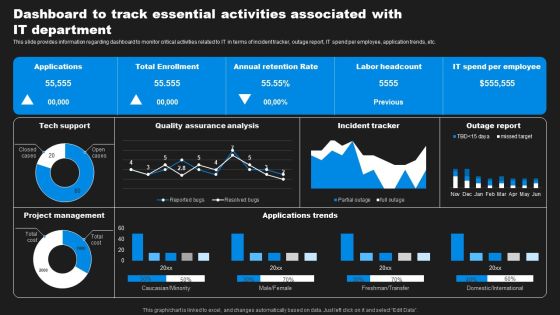
Enhancing Information Technology With Strategic Dashboard To Track Essential Activities Formats PDF
This slide provides information regarding dashboard to monitor critical activities related to IT in terms of incident tracker, outage report, IT spend per employee, application trends, etc. If you are looking for a format to display your unique thoughts, then the professionally designed Enhancing Information Technology With Strategic Dashboard To Track Essential Activities Formats PDF is the one for you. You can use it as a Google Slides template or a PowerPoint template. Incorporate impressive visuals, symbols, images, and other charts. Modify or reorganize the text boxes as you desire. Experiment with shade schemes and font pairings. Alter, share or cooperate with other people on your work. Download Enhancing Information Technology With Strategic Dashboard To Track Essential Activities Formats PDF and find out how to give a successful presentation. Present a perfect display to your team and make your presentation unforgettable.
Executing Online Solution In Banking Dashboard Tracking Customer Activities And Revenue Generated Information PDF
This slide contains dashboard that will allow bank to track the customer activities in terms of new customer acquired, customer acquisition cost and overall revenue generated. Deliver and pitch your topic in the best possible manner with this executing online solution in banking dashboard tracking customer activities and revenue generated information pdf. Use them to share invaluable insights on compared to previous year, target achievement, customers acquisition, actual revenue and impress your audience. This template can be altered and modified as per your expectations. So, grab it now.

Coordinating Distinct Activities For Effective Project Time Management Dashboard To Monitor Project Portrait PDF
This slide focuses on dashboard to monitor project status and performance which includes estimated budget, actual cost, time taken by project team to complete phases, completion percentage of project, etc.Deliver and pitch your topic in the best possible manner with this Coordinating Distinct Activities For Effective Project Time Management Dashboard To Monitor Project Portrait PDF Use them to share invaluable insights on Project Performance, Cost Performance, Completing Project and impress your audience. This template can be altered and modified as per your expectations. So, grab it now.

Techniques For Timely Project Dashboard To Monitor Project Status And Performance Microsoft PDF
This slide focuses on dashboard to monitor project status and performance which includes estimated budget, actual cost, time taken by project team to complete phases, completion percentage of project, etc. Deliver and pitch your topic in the best possible manner with this Techniques For Timely Project Dashboard To Monitor Project Status And Performance Microsoft PDF. Use them to share invaluable insights on Timeline vs, Resource Capacity, Project Phase, Time Involved and impress your audience. This template can be altered and modified as per your expectations. So, grab it now.
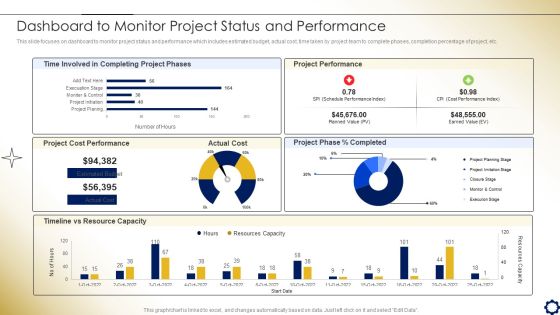
Project Time Management To Enhance Productivity Dashboard To Monitor Project Status And Performance Background PDF
This slide focuses on dashboard to monitor project status and performance which includes estimated budget, actual cost, time taken by project team to complete phases, completion percentage of project, etc.Deliver and pitch your topic in the best possible manner with this Project Time Management To Enhance Productivity Dashboard To Monitor Project Status And Performance Background PDF. Use them to share invaluable insights on Time Involved, Completing Project, Project Performance and impress your audience. This template can be altered and modified as per your expectations. So, grab it now.
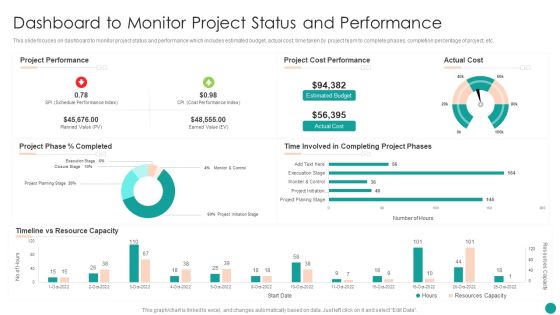
Time Management Techniques For Successful Project Dashboard To Monitor Project Status And Performance Brochure PDF
This slide focuses on dashboard to monitor project status and performance which includes estimated budget, actual cost, time taken by project team to complete phases, completion percentage of project, etc.Deliver and pitch your topic in the best possible manner with this Time Management Techniques For Successful Project Dashboard To Monitor Project Status And Performance Brochure PDF. Use them to share invaluable insights on Project Performance, Cost Performance, Completing Project and impress your audience. This template can be altered and modified as per your expectations. So, grab it now.

Organic Business Growth Strategies Dashboard To Analyse Organic Growth Post Global Expansion Background PDF
Purpose of the following slide is to display a dashboard to help analyze the organic growth through essential metrics such as actual vs. target sales, gross profit, sales growth etc. Deliver and pitch your topic in the best possible manner with this Organic Business Growth Strategies Dashboard To Analyse Organic Growth Post Global Expansion Background PDF. Use them to share invaluable insights on Sales, Product, Target and impress your audience. This template can be altered and modified as per your expectations. So, grab it now.

Strategies To Enhance Project Management Process Dashboard Depicting Project Associated Risks And Issues Background PDF
This slide focuses on project management dashboard which covers the project name, status date overall status, monthly schedule such as analysis, development, quality assurance, user acceptance, pre production and support with actual and planned budget, pending decisions and actions, etc. Deliver and pitch your topic in the best possible manner with this Strategies To Enhance Project Management Process Dashboard Depicting Project Associated Risks And Issues Background PDF. Use them to share invaluable insights on Quality Assurance, Development, Analysis and impress your audience. This template can be altered and modified as per your expectations. So, grab it now.
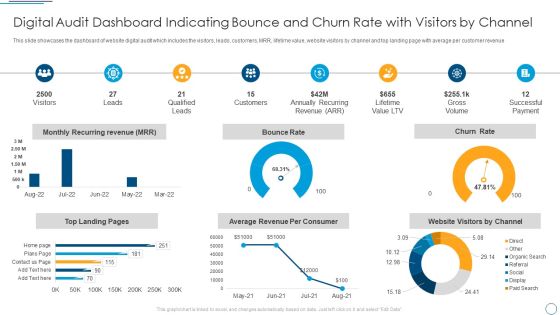
Digital Audit Dashboard Indicating Bounce And Churn Rate With Visitors By Channel Demonstration PDF
This slide showcases the dashboard of website digital audit which includes the visitors, leads, customers, MRR, lifetime value, website visitors by channel and top landing page with average per customer revenue.Deliver and pitch your topic in the best possible manner with this Digital Audit Dashboard Indicating Bounce And Churn Rate With Visitors By Channel Demonstration PDF. Use them to share invaluable insights on Qualified Leads, Annually Recurring, Successful Payment and impress your audience. This template can be altered and modified as per your expectations. So, grab it now.
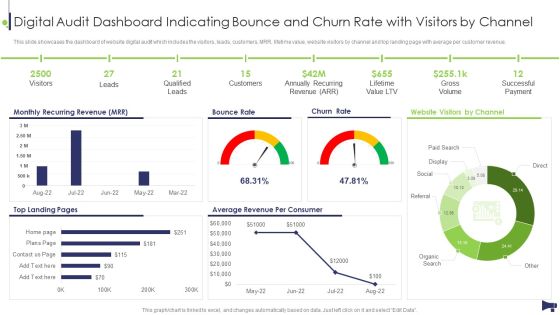
Website And Social Media Digital Audit Dashboard Indicating Bounce And Churn Rate Template PDF
This slide showcases the dashboard of website digital audit which includes the visitors, leads, customers, MRR, lifetime value, website visitors by channel and top landing page with average per customer revenue. Deliver and pitch your topic in the best possible manner with this Website And Social Media Digital Audit Dashboard Indicating Bounce And Churn Rate Template PDF. Use them to share invaluable insights on Monthly Recurring Revenue, Bounce Rate, Churn Rate and impress your audience. This template can be altered and modified as per your expectations. So, grab it now.
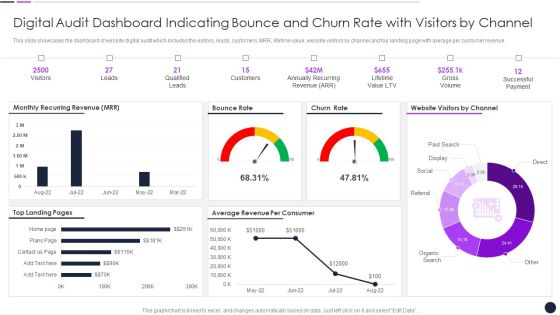
Digital Audit Dashboard Indicating Bounce And Churn Rate With Visitors By Channel Inspiration PDF
This slide showcases the dashboard of website digital audit which includes the visitors, leads, customers, MRR, lifetime value, website visitors by channel and top landing page with average per customer revenue.Deliver and pitch your topic in the best possible manner with this Digital Audit Dashboard Indicating Bounce And Churn Rate With Visitors By Channel Inspiration PDF. Use them to share invaluable insights on Qualified Leads, Annually Recurring, Lifetime Value and impress your audience. This template can be altered and modified as per your expectations. So, grab it now.

Omnichannel Banking Services Platform Dashboard To Track Performance Of Digital Loan Applications Background PDF
This slide covers dashboard to assess outcomes for loan applications applied by customer through various omnichannel banking services. It includes results based on elements such as debt restructuring, commercial property loans, credit card along with branch based loans, approval rates, etc. There are so many reasons you need a Omnichannel Banking Services Platform Dashboard To Track Performance Of Digital Loan Applications Background PDF. The first reason is you can not spend time making everything from scratch, Thus, Slidegeeks has made presentation templates for you too. You can easily download these templates from our website easily.

Deployment Of Omnichannel Banking Solutions Dashboard To Track Performance Of Digital Loan Applications Pictures PDF
This slide covers dashboard to assess outcomes for loan applications applied by customer through various omnichannel banking services. It includes results based on elements such as debt restructuring, commercial property loans, credit card along with branch based loans, approval rates, etc. From laying roadmaps to briefing everything in detail, our templates are perfect for you. You can set the stage with your presentation slides. All you have to do is download these easy to edit and customizable templates. Deployment Of Omnichannel Banking Solutions Dashboard To Track Performance Of Digital Loan Applications Pictures PDF will help you deliver an outstanding performance that everyone would remember and praise you for. Do download this presentation today.
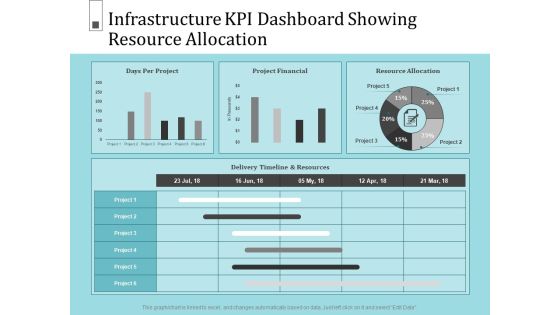
Infrastructure Project Management In Construction Infrastructure KPI Dashboard Showing Resource Allocation Pictures PDF
Deliver and pitch your topic in the best possible manner with this infrastructure project management in construction infrastructure kpi dashboard showing resource allocation pictures pdf. Use them to share invaluable insights on project, resource allocation, project financial, days per project and impress your audience. This template can be altered and modified as per your expectations. So, grab it now.

Infrastructure Project Management In Construction KPI Dashboard Showing Cost Reduction And Procurement Introduction PDF
Deliver and pitch your topic in the best possible manner with this infrastructure project management in construction kpi dashboard showing cost reduction and procurement introduction pdf. Use them to share invaluable insights on cost reduction, transistors, sensors, supplier and impress your audience. This template can be altered and modified as per your expectations. So, grab it now.

Construction Engineering And Industrial Facility Management Infrastructure KPI Dashboard Showing Project Revenue Formats PDF
Deliver and pitch your topic in the best possible manner with this construction engineering and industrial facility management infrastructure kpi dashboard showing project revenue formats pdf. Use them to share invaluable insights on all other materials, 15percent, household, asphalt and impress your audience. This template can be altered and modified as per your expectations. So, grab it now.

KPI Dashboard To Measure Performance Of B2B Promotional Communication Strategy Mockup PDF
The following slides outline the key performance indicator dashboard to track performance of B2B marketing communication approach. It covers information about pipeline deals, revenue by campaign, email engagement and landing page completion. Pitch your topic with ease and precision using this KPI Dashboard To Measure Performance Of B2B Promotional Communication Strategy Mockup PDF. This layout presents information on Pipeline Deals, Engagement Health, Email Engagement. It is also available for immediate download and adjustment. So, changes can be made in the color, design, graphics or any other component to create a unique layout.

KPI Dashboard To Track Risk Events Ppt Infographic Template Layout Ideas PDF
This slide displays KPI dashboard that can be used by a firm to track multiple risk events. Metrics covered in the dashboard are residual risks by period and risk category by total risk rating. Are you in need of a template that can accommodate all of your creative concepts This one is crafted professionally and can be altered to fit any style. Use it with Google Slides or PowerPoint. Include striking photographs, symbols, depictions, and other visuals. Fill, move around, or remove text boxes as desired. Test out color palettes and font mixtures. Edit and save your work, or work with colleagues. Download KPI Dashboard To Track Risk Events Ppt Infographic Template Layout Ideas PDF and observe how to make your presentation outstanding. Give an impeccable presentation to your group and make your presentation unforgettable.

Digital Audit Dashboard Indicating Bounce And Churn Rate With Visitors By Channel Information PDF
This slide showcases the dashboard of website digital audit which includes the visitors, leads, customers, MRR, lifetime value, website visitors by channel and top landing page with average per customer revenue. Deliver an awe inspiring pitch with this creative Digital Audit Dashboard Indicating Bounce And Churn Rate With Visitors By Channel Information PDF bundle. Topics like Monthly Recurring Revenue, Bounce Rate, Churn Rate can be discussed with this completely editable template. It is available for immediate download depending on the needs and requirements of the user.
Sustainable Energy Dashboard For Our Green Energy Projects Ppt PowerPoint Presentation Show Icons PDF
This slide depicts the dashboard for our green energy projects by covering details of total projects, projects by sector, energy sources, the contribution of green energy projects in households, industry, etc.Deliver and pitch your topic in the best possible manner with this Sustainable Energy Dashboard For Our Green Energy Projects Ppt PowerPoint Presentation Show Icons PDF. Use them to share invaluable insights on Production Coasts, Total Sales, Under Construction and impress your audience. This template can be altered and modified as per your expectations. So, grab it now.
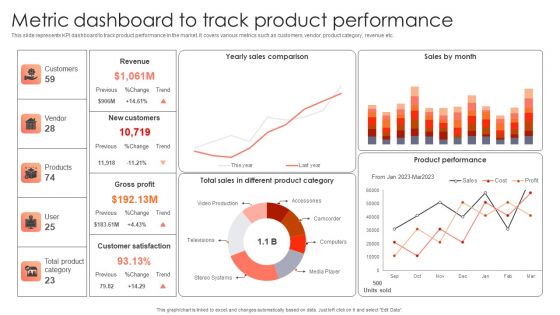
Management Plan For Product Life Cycle Metric Dashboard To Track Product Performance Infographics PDF
This slide represents KPI dashboard to track product performance in the market. It covers various metrics such as customers, vendor, product category, revenue etc. Slidegeeks has constructed Management Plan For Product Life Cycle Metric Dashboard To Track Product Performance Infographics PDF after conducting extensive research and examination. These presentation templates are constantly being generated and modified based on user preferences and critiques from editors. Here, you will find the most attractive templates for a range of purposes while taking into account ratings and remarks from users regarding the content. This is an excellent jumping-off point to explore our content and will give new users an insight into our top-notch PowerPoint Templates.
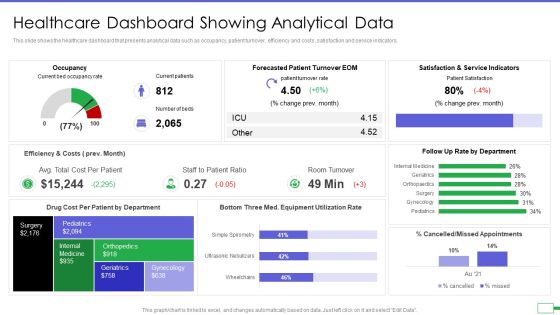
Iot And Digital Twin To Reduce Costs Post Covid Healthcare Dashboard Showing Analytical Data Elements PDF
This slide shows the healthcare dashboard that presents analytical data such as occupancy, patient turnover, efficiency and costs, satisfaction and service indicators. Deliver and pitch your topic in the best possible manner with this iot and digital twin to reduce costs post covid healthcare dashboard showing analytical data elements pdf. Use them to share invaluable insights on occupancy, patient turnover, efficiency and costs, satisfaction and service indicators and impress your audience. This template can be altered and modified as per your expectations. So, grab it now.

Construction Production Facilities Infrastructure KPI Dashboard Showing Project Revenue Elements PDF
Presenting this set of slides with name construction production facilities infrastructure kpi dashboard showing project revenue elements pdf. The topics discussed in these slides are net project revenue per employee, construction and demolition west recycled. This is a completely editable PowerPoint presentation and is available for immediate download. Download now and impress your audience.
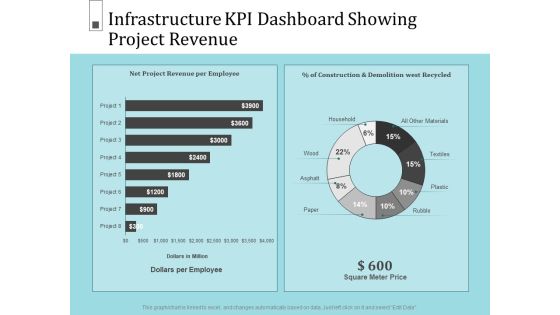
Infrastructure Project Management In Construction Infrastructure KPI Dashboard Showing Project Revenue Portrait PDF
Deliver an awe inspiring pitch with this creativeinfrastructure project management in construction infrastructure kpi dashboard showing project revenue portrait pdf. bundle. Topics like net project revenue per employee, construction and demolition west recycled, project can be discussed with this completely editable template. It is available for immediate download depending on the needs and requirements of the user.

Construction Management Services And Action Plan Infrastructure KPI Dashboard Showing Project Revenue Graphics PDF
Deliver an awe inspiring pitch with this creative construction management services and action plan infrastructure kpi dashboard showing project revenue graphics pdf bundle. Topics like construction and demolition west recycled, net project revenue per employee can be discussed with this completely editable template. It is available for immediate download depending on the needs and requirements of the user.
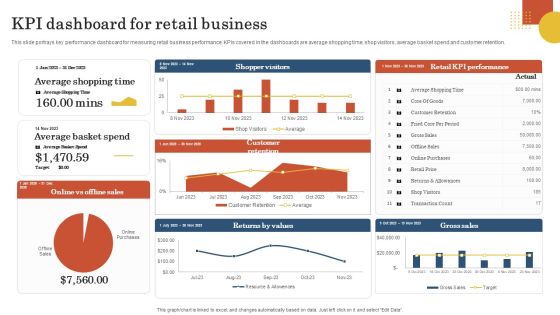
Retail Business Operation Management To Optimize Customer Experience KPI Dashboard For Retail Business Download PDF
This slide portrays key performance dashboard for measuring retail business performance. KPIs covered in the dashboards are average shopping time, shop visitors, average basket spend and customer retention. Are you in need of a template that can accommodate all of your creative concepts This one is crafted professionally and can be altered to fit any style. Use it with Google Slides or PowerPoint. Include striking photographs, symbols, depictions, and other visuals. Fill, move around, or remove text boxes as desired. Test out color palettes and font mixtures. Edit and save your work, or work with colleagues. Download Retail Business Operation Management To Optimize Customer Experience KPI Dashboard For Retail Business Download PDF and observe how to make your presentation outstanding. Give an impeccable presentation to your group and make your presentation unforgettable.

Construction Production Facilities Infrastructure KPI Dashboard Showing Cost Reduction And Procurement Microsoft PDF
Presenting this set of slides with name construction production facilities infrastructure kpi dashboard showing cost reduction and procurement microsoft pdf. The topics discussed in these slides are cost reduction, procurement roi, cost reduction, cost savings, cost avoidance, cost of purchase order. This is a completely editable PowerPoint presentation and is available for immediate download. Download now and impress your audience.

Construction Production Facilities Infrastructure KPI Dashboard Showing Resource Allocation Designs PDF
Presenting this set of slides with name construction production facilities infrastructure kpi dashboard showing resource allocation designs pdf. The topics discussed in these slides are delivery timeline and resources, project financially, resource allocation, days per project. This is a completely editable PowerPoint presentation and is available for immediate download. Download now and impress your audience.

Construction Management Services And Action Plan Infrastructure KPI Dashboard Showing Resource Allocation Ideas PDF
Deliver an awe inspiring pitch with this creative construction management services and action plan infrastructure kpi dashboard showing resource allocation ideas pdf bundle. Topics like days per project, resource allocation, project financial can be discussed with this completely editable template. It is available for immediate download depending on the needs and requirements of the user.

Construction Engineering And Industrial Facility Management Infrastructure KPI Dashboard Showing Cost Reduction And Procurement Demonstration PDF
Deliver an awe-inspiring pitch with this creative construction engineering and industrial facility management infrastructure kpi dashboard showing cost reduction and procurement demonstration pdf bundle. Topics like cost of purchase, cost of reduction, cost savings, cost avoidance, procurement roi can be discussed with this completely editable template. It is available for immediate download depending on the needs and requirements of the user.

 Home
Home