Rationalization
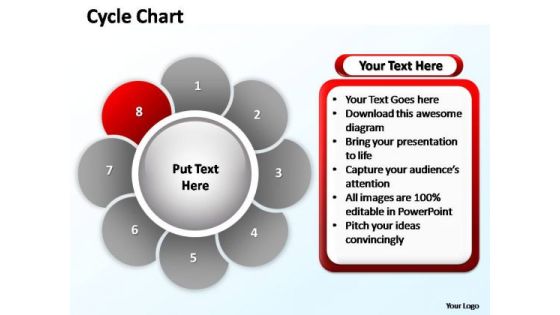
PowerPoint Design Image Cycle Chart Ppt Templates
PowerPoint Design Image Cycle Chart PPT Templates-Cycle Diagrams are a type of graphics that shows how items are related to one another in a repeating cycle. In a cycle diagram, you can explain the main events in the cycle, how they interact, and how the cycle repeats. These Diagrams can be used to interact visually and logically with audiences.-PowerPoint Design Image Cycle Chart PPT Templates

PowerPoint Design Image Cycle Process Ppt Template
PowerPoint Design Image Cycle Process PPT Template-Cycle Diagrams are a type of graphics that shows how items are related to one another in a repeating cycle. In a cycle diagram, you can explain the main events in the cycle, how they interact, and how the cycle repeats. These Diagrams can be used to interact visually and logically with audiences.-PowerPoint Design Image Cycle Process PPT Template

PowerPoint Designs Business Cycle Chart Ppt Slides
PowerPoint Designs Business Cycle Chart PPT Slides-Cycle Diagrams are a type of graphics that shows how items are related to one another in a repeating cycle. In a cycle diagram, you can explain the main events in the cycle, how they interact, and how the cycle repeats. These Diagrams can be used to interact visually and logically with audiences. -PowerPoint Designs Business Cycle Chart PPT Slides

PowerPoint Designs Company Cycle Chart Ppt Process
PowerPoint Designs Company Cycle Chart PPT Process-Cycle Diagrams are a type of graphics that shows how items are related to one another in a repeating cycle. In a cycle diagram, you can explain the main events in the cycle, how they interact, and how the cycle repeats. These Diagrams can be used to interact visually and logically with audiences. -PowerPoint Designs Company Cycle Chart PPT Process
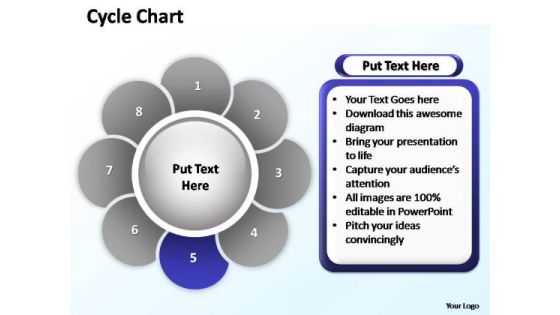
PowerPoint Designs Image Cycle Chart Ppt Layout
PowerPoint Designs Image Cycle Chart PPT Layout-Cycle Diagrams are a type of graphics that shows how items are related to one another in a repeating cycle. In a cycle diagram, you can explain the main events in the cycle, how they interact, and how the cycle repeats. These Diagrams can be used to interact visually and logically with audiences. -PowerPoint Designs Image Cycle Chart PPT Layout
PowerPoint Designs Company Cycle Process Ppt Templates
PowerPoint Designs Company Cycle Process PPT Templates-Cycle Diagrams are a type of graphics that shows how items are related to one another in a repeating cycle. In a cycle diagram, you can explain the main events in the cycle, how they interact, and how the cycle repeats. These Diagrams can be used to interact visually and logically with audiences. -PowerPoint Designs Company Cycle Process PPT Templates
PowerPoint Designs Editable Cycle Process Ppt Backgrounds
PowerPoint Designs Editable Cycle Process PPT Backgrounds-Cycle Diagrams are a type of graphics that shows how items are related to one another in a repeating cycle. In a cycle diagram, you can explain the main events in the cycle, how they interact, and how the cycle repeats. These Diagrams can be used to interact visually and logically with audiences. -PowerPoint Designs Editable Cycle Process PPT Backgrounds

PowerPoint Designs Image Cycle Process Ppt Process
PowerPoint Designs Image Cycle Process PPT Process-Cycle Diagrams are a type of graphics that shows how items are related to one another in a repeating cycle. In a cycle diagram, you can explain the main events in the cycle, how they interact, and how the cycle repeats. These Diagrams can be used to interact visually and logically with audiences. -PowerPoint Designs Image Cycle Process PPT Process
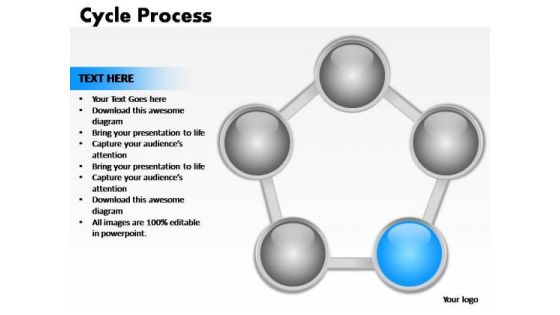
PowerPoint Designs Marketing Cycle Process Ppt Templates
PowerPoint Designs Marketing Cycle Process PPT Templates-Cycle Diagrams are a type of graphics that shows how items are related to one another in a repeating cycle. In a cycle diagram, you can explain the main events in the cycle, how they interact, and how the cycle repeats. These Diagrams can be used to interact visually and logically with audiences. -PowerPoint Designs Marketing Cycle Process PPT Templates
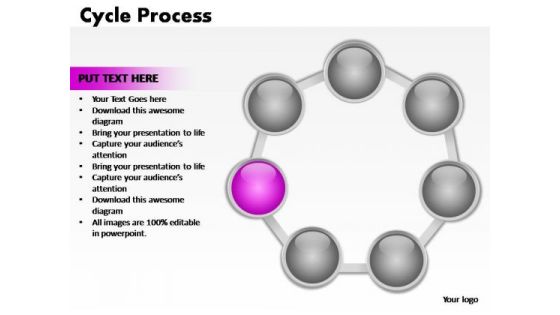
PowerPoint Slides Company Cycle Process Ppt Design
PowerPoint Slides Company Cycle Process PPT Design-Cycle Diagrams are a type of graphics that shows how items are related to one another in a repeating cycle. In a cycle diagram, you can explain the main events in the cycle, how they interact, and how the cycle repeats. These Diagrams can be used to interact visually and logically with audiences. -PowerPoint Slides Company Cycle Process PPT Design
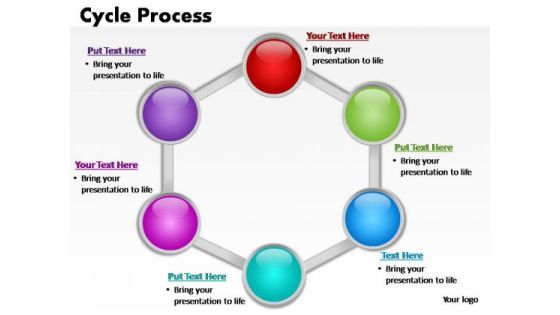
PowerPoint Slides Company Cycle Process Ppt Slide
PowerPoint Slides Company Cycle Process PPT Slide-Cycle Diagrams are a type of graphics that shows how items are related to one another in a repeating cycle. In a cycle diagram, you can explain the main events in the cycle, how they interact, and how the cycle repeats. These Diagrams can be used to interact visually and logically with audiences. -PowerPoint Slides Company Cycle Process PPT Slide
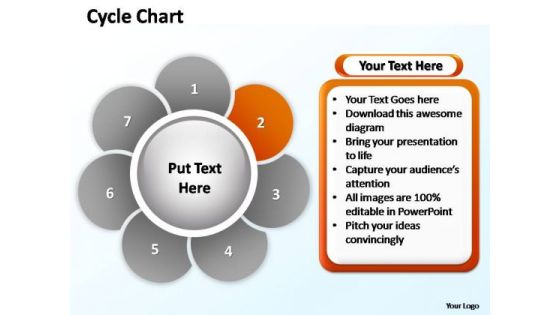
PowerPoint Slides Growth Cycle Chart Ppt Presentation
PowerPoint Slides Growth Cycle Chart PPT Presentation-Cycle Diagrams are a type of graphics that shows how items are related to one another in a repeating cycle. In a cycle diagram, you can explain the main events in the cycle, how they interact, and how the cycle repeats. These Diagrams can be used to interact visually and logically with audiences. -PowerPoint Slides Growth Cycle Chart PPT Presentation
PowerPoint Slides Sales Cycle Process Ppt Designs
PowerPoint Slides Sales Cycle Process PPT Designs-Cycle Diagrams are a type of graphics that shows how items are related to one another in a repeating cycle. In a cycle diagram, you can explain the main events in the cycle, how they interact, and how the cycle repeats. These Diagrams can be used to interact visually and logically with audiences. -PowerPoint Slides Sales Cycle Process PPT Designs

PowerPoint Slides Strategy Cycle Chart Ppt Layouts
PowerPoint Slides Strategy Cycle Chart PPT Layouts-Cycle Diagrams are a type of graphics that shows how items are related to one another in a repeating cycle. In a cycle diagram, you can explain the main events in the cycle, how they interact, and how the cycle repeats. These Diagrams can be used to interact visually and logically with audiences. -PowerPoint Slides Strategy Cycle Chart PPT Layouts

PowerPoint Template Chart Cycle Process Ppt Theme
PowerPoint Template Chart Cycle Process PPT Theme-Cycle Diagrams are a type of graphics that shows how items are related to one another in a repeating cycle. In a cycle diagram, you can explain the main events in the cycle, how they interact, and how the cycle repeats. These Diagrams can be used to interact visually and logically with audiences. -PowerPoint Template Chart Cycle Process PPT Theme
PowerPoint Template Company Cycle Process Ppt Slides
PowerPoint Template Company Cycle Process PPT Slides-Cycle Diagrams are a type of graphics that shows how items are related to one another in a repeating cycle. In a cycle diagram, you can explain the main events in the cycle, how they interact, and how the cycle repeats. These Diagrams can be used to interact visually and logically with audiences. -PowerPoint Template Company Cycle Process PPT Slides
PowerPoint Template Diagram Cycle Process Ppt Presentation
PowerPoint Template Diagram Cycle Process PPT Presentation-Cycle Diagrams are a type of graphics that shows how items are related to one another in a repeating cycle. In a cycle diagram, you can explain the main events in the cycle, how they interact, and how the cycle repeats. These Diagrams can be used to interact visually and logically with audiences. -PowerPoint Template Diagram Cycle Process PPT Presentation
PowerPoint Theme Editable Cycle Chart Ppt Backgrounds
PowerPoint Theme Editable Cycle Chart PPT Backgrounds-Cycle Diagrams are a type of graphics that shows how items are related to one another in a repeating cycle. In a cycle diagram, you can explain the main events in the cycle, how they interact, and how the cycle repeats. These Diagrams can be used to interact visually and logically with audiences. -PowerPoint Theme Editable Cycle Chart PPT Backgrounds

PowerPoint Theme Leadership Cycle Chart Ppt Layout
PowerPoint Theme Leadership Cycle Chart PPT Layout-Cycle Diagrams are a type of graphics that shows how items are related to one another in a repeating cycle. In a cycle diagram, you can explain the main events in the cycle, how they interact, and how the cycle repeats. These Diagrams can be used to interact visually and logically with audiences. -PowerPoint Theme Leadership Cycle Chart PPT Layout
PowerPoint Theme Marketing Cycle Chart Ppt Templates
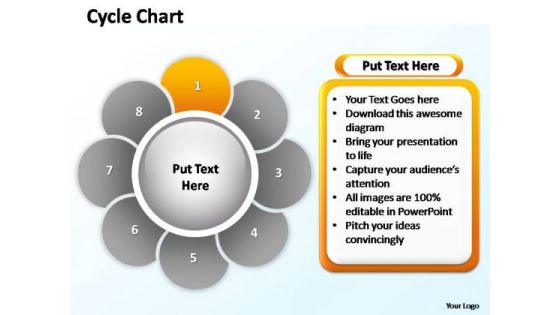
PowerPoint Theme Marketing Cycle Chart PPT Templates-Cycle Diagrams are a type of graphics that shows how items are related to one another in a repeating cycle. In a cycle diagram, you can explain the main events in the cycle, how they interact, and how the cycle repeats. These Diagrams can be used to interact visually and logically with audiences. -PowerPoint Theme Marketing Cycle Chart PPT Templates

PowerPoint Theme Process Cycle Process Ppt Designs
PowerPoint Theme Process Cycle Process PPT Designs-Cycle Diagrams are a type of graphics that shows how items are related to one another in a repeating cycle. In a cycle diagram, you can explain the main events in the cycle, how they interact, and how the cycle repeats. These Diagrams can be used to interact visually and logically with audiences. -PowerPoint Theme Process Cycle Process PPT Designs

PowerPoint Themes Marketing Cycle Chart Ppt Designs
PowerPoint Themes Marketing Cycle Chart PPT Designs-Cycle Diagrams are a type of graphics that shows how items are related to one another in a repeating cycle. In a cycle diagram, you can explain the main events in the cycle, how they interact, and how the cycle repeats. These Diagrams can be used to interact visually and logically with audiences. -PowerPoint Themes Marketing Cycle Chart PPT Designs

PowerPoint Themes Teamwork Cycle Chart Ppt Template
PowerPoint Themes Teamwork Cycle Chart PPT Template-Cycle Diagrams are a type of graphics that shows how items are related to one another in a repeating cycle. In a cycle diagram, you can explain the main events in the cycle, how they interact, and how the cycle repeats. These Diagrams can be used to interact visually and logically with audiences. -PowerPoint Themes Teamwork Cycle Chart PPT Template

PowerPoint Themes Teamwork Cycle Process Ppt Design
PowerPoint Themes Teamwork Cycle Process PPT Design-Cycle Diagrams are a type of graphics that shows how items are related to one another in a repeating cycle. In a cycle diagram, you can explain the main events in the cycle, how they interact, and how the cycle repeats. These Diagrams can be used to interact visually and logically with audiences. -PowerPoint Themes Teamwork Cycle Process PPT Design

PowerPoint Themes Teamwork Cycle Process Ppt Process
PowerPoint Themes Teamwork Cycle Process PPT Process-Cycle Diagrams are a type of graphics that shows how items are related to one another in a repeating cycle. In a cycle diagram, you can explain the main events in the cycle, how they interact, and how the cycle repeats. These Diagrams can be used to interact visually and logically with audiences. -PowerPoint Themes Teamwork Cycle Process PPT Process

PowerPoint Slide Designs Success Business Cycle Ppt Design
PowerPoint Slide Designs Success Business Cycle PPT Design-In a cycle diagram, you can explain the main events in the cycle, how they interact, and how the cycle repeats. These Diagrams can be used to interact visually and logically with audiences. Use this graphic to represent a continuing sequence of stages, tasks, or events in a circular flow and emphasize the connection between all components.-PowerPoint Slide Designs Success Business Cycle PPT Design

PowerPoint Slide Growth Business Cycle Ppt Design
PowerPoint Slide Growth Business Cycle PPT Design-In a cycle diagram, you can explain the main events in the cycle, how they interact, and how the cycle repeats. These Diagrams can be used to interact visually and logically with audiences. Use this graphic to represent a continuing sequence of stages, tasks, or events in a circular flow and emphasize the connection between all components.-PowerPoint Slide Growth Business Cycle PPT Design

Business Cubes Lego PowerPoint Templates Business Blocks Flowchart Ppt Slides
Business Cubes Lego PowerPoint Templates Business Blocks Flowchart PPT Slides-This Business Block Flowchart can help you see whether the steps of a process are logical, define the boundaries of a process, and develop a common base of knowledge about a process.-Business Cubes Lego PowerPoint Templates Business Blocks Flowchart PPT Slides-This template can be used for presentations relating to Activity, Background, Block, Box, Brick, Build, Buildings, Child, Childhood, Colourful, Concept, Connect, Connection, Construction, Cube, Design, Development, Education, Element, Fun, Game, Geometric
Ppt Diamond Military Decision Making Process PowerPoint Presentation 3 Stages Templates
PPT diamond military decision making process powerpoint presentation 3 stages Templates-The theme of this PowerPoint template is Green Diamonds. This diagram can be used to interact visually and logically with your audiences.-PPT diamond military decision making process powerpoint presentation 3 stages Templates-Business, Button, Card, Chart, Chrome, Diamond, Figure, Graph, Graphic, Green, Label, Man, Medal, Money, Page, Podium, Presentation, Red, Round, Set, Shape, Shield, Sign, Speech, Stick, Success, Suit, Symbol, Tag, Tie, Vector

Ppt Diamond Process 6 Power Point Stage PowerPoint Templates
PPT diamond process 6 power point stage PowerPoint Templates-The theme of this PowerPoint template is Purple Diamonds. This diagram can be used to interact visually and logically with your audiences.-PPT diamond process 6 power point stage PowerPoint Templates-Business, Button, Card, Chart, Chrome, Diamond, Figure, Graph, Graphic, Green, Label, Man, Medal, Money, Page, Podium, Presentation, Red, Round, Set, Shape, Shield, Sign, Speech, Stick, Success, Suit, Symbol, Tag, Tie, Vector
Ppt Diamond Writing Process PowerPoint Presentation 4 Stage Templates
PPT diamond writing process powerpoint presentation 4 stage Templates-The theme of this PowerPoint template is Red Diamonds. This diagram can be used to interact visually and logically with your audiences.-PPT diamond writing process powerpoint presentation 4 stage Templates-Business, Button, Card, Chart, Chrome, Diamond, Figure, Graph, Graphic, Green, Label, Man, Medal, Money, Page, Podium, Presentation, Red, Round, Set, Shape, Shield, Sign, Speech, Stick, Success, Suit, Symbol, Tag, Tie, Vector
Ppt Three Verticals Of Concept Download PowerPoint 2007 Templates
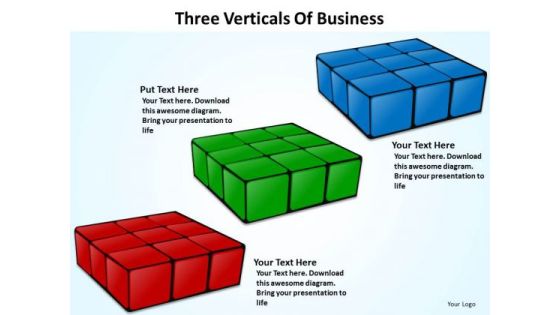
PPT three verticals of concept download powerpoint 2007 Templates-This PowerPoint Diagram shows Three Transparent and Colorful layers of a 3D Cube. These PowerPoint Diagram Signify three layers to be used in some process or an activity related to Business purposes.-PPT three verticals of concept download powerpoint 2007 Templates-Assemble, Assembly, Block, Clean, Construct, Create, Cubes, Learn, Logic, Nobody, Pattern, Piece, Concepts, Verticals, Shape, Simple, Single Object, Smooth, Solution, Sparse
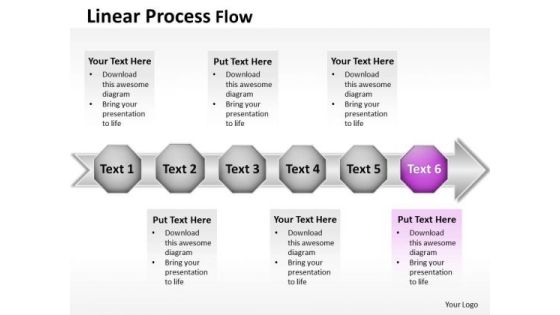
Ppt Linear Flow PowerPoint Theme Actions Process Templates
PPT linear flow powerpoint theme actions process Templates-This Linear flow diagram is a simple mapping tool that shows the sequence of actions within a process. Use this to help you organize the logic of your views.-PPT linear flow powerpoint theme actions process Templates-3d, Advertisement, Advertising, Arrow, Border, Business, Circles, Collection, Customer, Design, Element, Icon, Idea, Illustration, Info, Information, Isolated, Label, Light, Location, Needle, New, Notification, Notify, Point, Pointer, Promotion, Role, Rounded
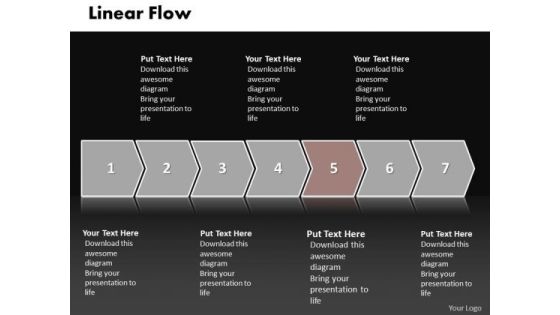
Ppt Linear Work Flow Chart PowerPoint Illustration Track Of Process Templates
PPT linear work flow chart powerpoint illustration track of process Templates-Use this diagram to keep track of business activities. It helps you to organize the logic of your views. This Diagram is designed to attract the attention of your audience.-PPT linear work flow chart powerpoint illustration track of process Templates-3d, Arrow, Background, Banner, Business, Chart, Colorful, Diagram, Direction, Element, Financial, Flow, Gradient, Illustration, Isolated, Mirrored, Placeholder, Presentation, Process, Steps
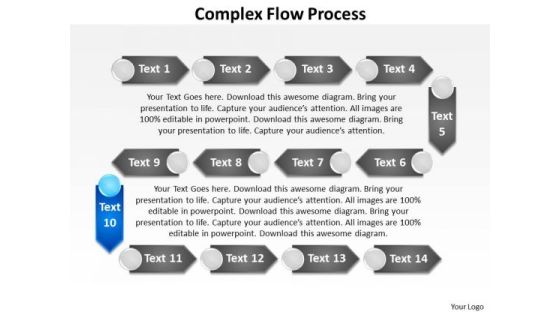
Ppt Circuitous Flow Data Mining Process PowerPoint Presentation Templates
PPT circuitous flow data mining process powerpoint presentation Templates-Use this data flow diagram to show the logical flow of data through a set of processes or procedures. It represents processing requirements of a program and the information flows. It helps to focus the minds of your team-PPT circuitous flow data mining process powerpoint presentation Templates-Advice, Analyze, Arrow, Background, Business, Chart, Concept, Creativity, Decision, Design, Determination, Diagram, Draw, Education, Flowchart, Graphic, Idea, Means, Method, Office, Plan, Pointing, Presentation, Process, Sign, Strategy, Technology
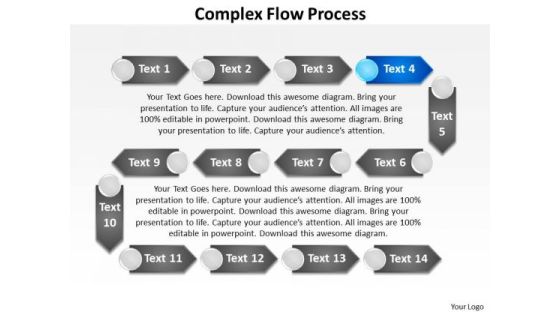
Ppt Complex Flow Process Design PowerPoint Presentation Templates
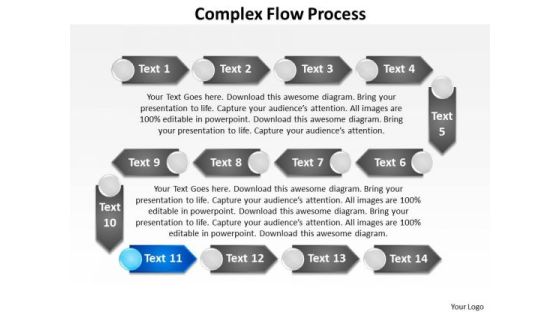
PPT complex flow process design powerpoint presentation Templates-This PowerPoint slide is type of unified modeling diagram used to illustrate the logical path or system. Educate your team and the attention you have paid will surely see the all making the grade.-PPT complex flow process design powerpoint presentation Templates-Advice, Analyze, Arrow, Background, Business, Chart, Concept, Creativity, Decision, Design, Determination, Diagram, Draw, Education, Flowchart, Graphic, Idea, Means, Method, Office, Plan, Pointing, Presentation, Process, Sign, Strategy, Technology
Ppt Multiplex Flow Process PowerPoint Presentation Templates
PPT multiplex flow process powerpoint presentation Templates-This diagram can help you see whether the steps of a process are logical, define the boundaries of a process, and develop a common base of knowledge about a process.-PPT multiplex flow process powerpoint presentation Templates-Advice, Analyze, Arrow, Background, Business, Chart, Concept, Creativity, Decision, Design, Determination, Diagram, Draw, Education, Flowchart, Graphic, Idea, Means, Method, Office, Plan, Pointing, Presentation, Process, Sign, Strategy, Technology
Ppt Direct Points Of Banking Process Using 6 Stages PowerPoint Templates
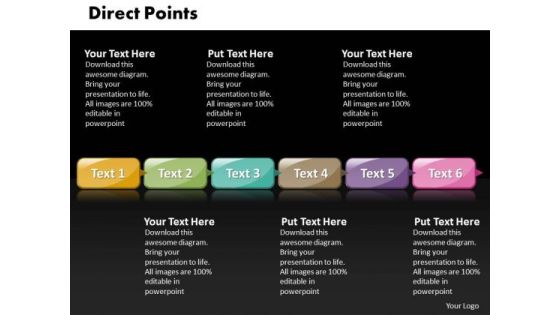
PPT direct points of banking process using 6 stages PowerPoint Templates-The above template displays a diagram of unified Boxes. This is a type of modeling diagrams used to illustrate the logical path or system. Explain the specific subject matter to inspire your team.-PPT direct points of banking process using 6 stages PowerPoint Templates-Accent, Advertisement, Arrow, Badge, Banner, Blank, Business, Collection, Decoration, Design, Direction, Element, Empty, Financial, Flow, Graph, Horizontal, Instruction, Isolated, Label, Manual, Menu, Message, Placard, Process, Promo, Promotion, Sale, Set, Shape
Ppt Animate Text PowerPoint 2003 Circle Arrow Process Slide Numbers Templates
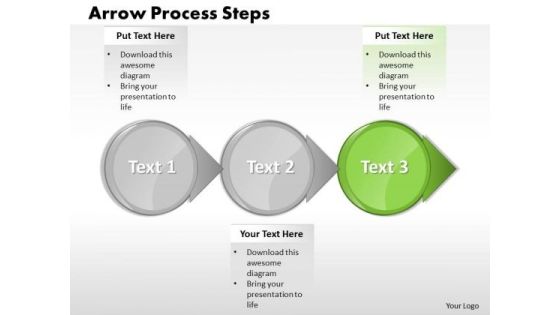
PPT animate text powerpoint 2003 circle arrow process slide numbers Templates-Your quicksilver ideas are the arrows in your quiver. They are logical, accurate and to the point. Use our appropriate templates to get them across to your target audience. -PPT animate text powerpoint 2003 circle arrow process slide numbers Templates-Abstract, Access, Arrow, Background, Business, Chart, Circle, Concept, Conceptual, Connection, Corporate, Creative, Cycle, Design, Different, Element, Empty, Form, Frame, Graphic, Group, Idea, Illustration, Part, Piece, Place, Process, Red, Shapes, Solution, Special, Speech, Strategy, Symbol
Ppt Consistent Flow Of 3 Phase Diagram PowerPoint Templates
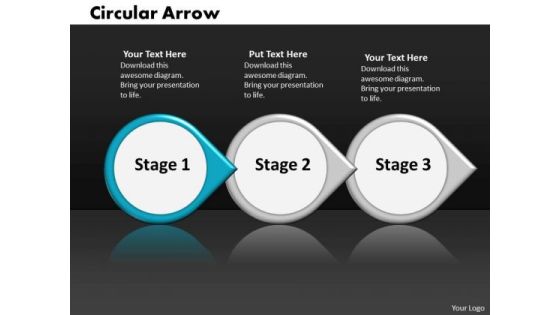
PPT consistent flow of 3 phase diagram PowerPoint Templates-Business ethics is an essential element in your growth. Now you have to coordinate and motivate your team. Use this diagram to organize the logic of your views.-PPT consistent flow of 3 phase diagram PowerPoint Templates-3d, Abstract, Advertisement, Aim, Arrow, Business, Circular, Cursor, Direction, Down, Environment, Form, Glossy, Graphic, Icon, Illustration, Information, Mark, Motion, Perspective, Point, Sale, Shadow, Shape, Shiny, Sign
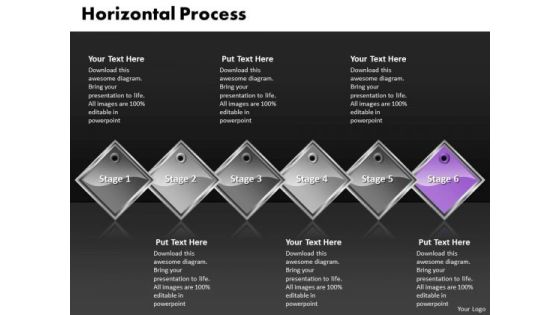
Ppt Diamond Horizontal Process 6 PowerPoint Slide Numbers 7 Templates
PPT diamond horizontal process 6 powerpoint slide numbers 7 Templates-Highlight the anticipation of your audience with this colorful diamond diagram. Colors generate instant reactions in our brains. Educate your team with your thoughts and logic.-PPT diamond horizontal process 6 powerpoint slide numbers 7 Templates-Advertise, Advertisement, Badge, Box, Business, Card, Collection, Column, Corporate, Costing, Counting, Design, Discount, Element, Featured, Finance, Grid, Hosting, Information, List, Message, Placard, Plan, Price, Pricing, Rectangle, Report, Round

Editable PowerPoint Template Arrow Process 6 Stages Business Plan Image
editable PowerPoint template arrow process 6 stages business plan Image-Stable ideas are the building blocks of a successful structure. This template helps expound on the logic of your detailed thought process to take your company forward.-editable PowerPoint template arrow process 6 stages business plan Image-Arrow, Buttons, Design, Download, Element, Icon, Illustration, Internet, Menu, Modern, Object, Push, Set, Shape, Shiny, Sign, Site, Style, Symbol, Vector, Web

Editable Ppt Background Arrow Process 6 Stages Project Management PowerPoint 5 Image
editable PPT Background arrow Process 6 stages project management powerpoint 5 Image-These Segmented arrows are useful to represent process flows. Pinpoint the critical paths and areas in your process and set the timelines for their completion. Use them to help you organize the logic of your views-editable PPT Background arrow Process 6 stages project management powerpoint 5 Image-Arrow, Buttons, Design, Download, Element, Icon, Illustration, Internet, Menu, Modern, Object, Push, Set, Shape, Shiny, Sign, Site, Style, Symbol, Vector, Web
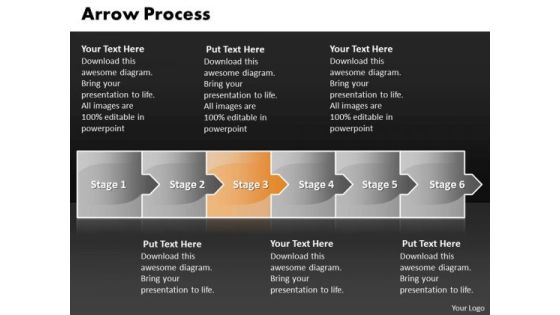
Editable Ppt Theme Arrow Process 6 Stages Business Management PowerPoint 4 Graphic
editable PPT Theme arrow process 6 stages business management powerpoint 4 Graphic-This is a unified modeling diagram used to illustrate the logical path or system. Enlighten others on the process with this innovative graphic to authenticate your plan of achieving the goal of added value.-editable PPT Theme arrow process 6 stages business management powerpoint 4 Graphic-Advertising, Arrow, Concept, Corporate, Creative, Design, Direction, Flow, Illustration, Info, Graphic, Instruction, Label, Layout, Manual, Modern, Number, Offer, Order, Pointer, Product, Progress, Promotion, Sequence, Special, Step, Symbol
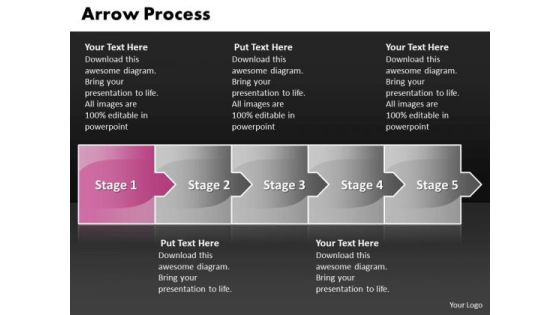
Process Ppt Background Arrow 5 Stages Business Plan PowerPoint 2 Image
process PPT Background arrow 5 stages business plan powerpoint 2 Image-This diagram can be used to illustrate the logical path or system. Shower them with the wisdom of your words. Adjust the above image into your Presentations to visually support your contents.-process PPT Background arrow 5 stages business plan powerpoint 2 Image-Advertising, Arrow, Concept, Corporate, Creative, Design, Direction, Flow, Illustration, Info, Graphic, Instruction, Label, Layout, Manual, Modern, Number, Offer, Order, Pointer, Product, Progress, Promotion, Sequence, Special, Step, Symbol

Building Blocks International Marketing Concepts Ppt Write Business Plan PowerPoint Slides
We present our building_blocks_international_marketing_concepts_ppt_write_business_plan_PowerPoint_Slides.Download and present our Flow Charts PowerPoint Templates because Our PowerPoint Templates and Slides offer you the needful to organise your thoughts. Use them to list out your views in a logical sequence. Present our Business PowerPoint Templates because our PowerPoint Templates and Slides will give your ideas the shape. Present our Marketing PowerPoint Templates because You will get more than you ever bargained for.

1 Osi Reference Model With 7 Layers Showing Components Of A Computer Network Ppt Slides
This conceptual image displays OSI reference model. This image has been designed with graphic of computer networks, wireless computer network, TCP IP reference model and OSI reference model. The networking model groups communication functions of networking into logical layers. This image depicts networking. Use this image, in your presentations to explain standards and protocol of networking. This image may also be used in computer education related presentations. This image will impart professional appearance to your presentations.

1 Seven Layers Of The Osi Stack Showing Data Transfer Ppt Slides
This conceptual image displays seven layers of OSI stack with data transfer. This image has been designed with graphic of OSI reference model for both transmitter and receiver device. The OSI model groups communication functions of networking into seven logical layers. This image depicts networking. Use this image, in your presentations to explain standards and protocol of networking. This image may also be used in computer education related presentations. This image will impart professional appearance to your presentations.

Artificial Intelligence Tools Expert System Limitations Of The Expert System Ppt File Diagrams PDF
Presenting this set of slides with name artificial intelligence tools expert system limitations of the expert system ppt file diagrams pdf. This is a eight stage process. The stages in this process are decision making power like humans, its developed for a specific domain, explain logic behind decision, development cost high, difficult maintain, expert system widely tested, it deal mixed knowledge. This is a completely editable PowerPoint presentation and is available for immediate download. Download now and impress your audience.
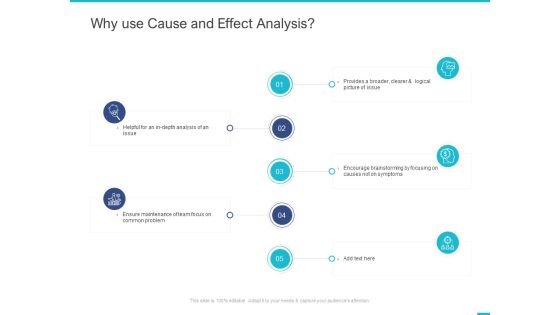
Fishbone Ishikawa Cause And Effect Analysis Why Use Cause And Effect Analysis Ppt PowerPoint Presentation Infographics Graphics Design PDF
Presenting this set of slides with name fishbone ishikawa cause and effect analysis why use cause and effect analysis ppt powerpoint presentation infographics graphics design pdf. This is a five stage process. The stages in this process are provides broader, clearer and logical picture, encourage brainstorming, focusing causes, symptoms, ensure maintenance, team focus, common problem, helpful depth analysis. This is a completely editable PowerPoint presentation and is available for immediate download. Download now and impress your audience.

Multi Level Cloud Based Support Structure Framework Ppt PowerPoint Presentation Model Graphics Pictures PDF
Presenting this set of slides with name multi level cloud based support structure framework ppt powerpoint presentation model graphics pictures pdf. This is a one stage process. The stages in this process are presentation tier, business logic tier, data tier, number of queued messages, elastic load balancer, elastic queue, scale, load balancer. This is a completely editable PowerPoint presentation and is available for immediate download. Download now and impress your audience.
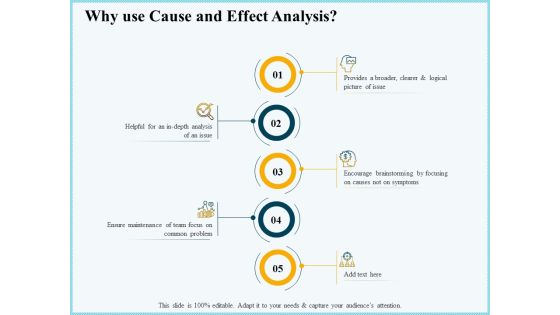
Vicious Circle Effect On Quality Assurance Why Use Cause And Effect Analysis Ppt Outline Backgrounds PDF
Presenting vicious circle effect on quality assurance why use cause and effect analysis ppt outline backgrounds pdf to provide visual cues and insights. Share and navigate important information on five stages that need your due attention. This template can be used to pitch topics like provides broader, clearer and logical, picture issue, helpful depth analysis, encourage brainstorming focusing, ensure maintenance, team focus, common problem. In addtion, this PPT design contains high-resolution images, graphics, etc, that are easily editable and available for immediate download.

Key Stages Of IT Security Systems Development Process Ppt PowerPoint Presentation Slides Display PDF
Presenting key stages of it security systems development process ppt powerpoint presentation slides display pdf to dispense important information. This template comprises six stages. It also presents valuable insights into the topics including investigation, analysis, logical design, physical design, implementation, maintenance and change. This is a completely customizable PowerPoint theme that can be put to use immediately. So, download it and address the topic impactfully.
Structure Of BI Semantic Framework Ppt PowerPoint Presentation Icon Example PDF
Pitch your topic with ease and precision using this structure of bi semantic framework ppt powerpoint presentation icon example pdf. This layout presents information on data model, data access, business logic and queries, multi dimensional, relational, data sources, bi applications. It is also available for immediate download and adjustment. So, changes can be made in the color, design, graphics or any other component to create a unique layout.
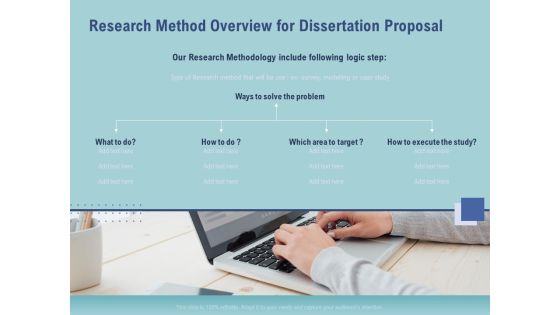
Thesis Research Method Overview For Dissertation Proposal Ppt Summary Visuals PDF
Our Research Methodology include following logic step. Presenting thesis research method overview for dissertation proposal ppt summary visuals pdf. to provide visual cues and insights. Share and navigate important information on one stages that need your due attention. This template can be used to pitch topics like target, execute study, solve problem. In addtion, this PPT design contains high resolution images, graphics, etc, that are easily editable and available for immediate download.

Back Propagation Program AI Limitations Of The Expert System Ppt Styles Gallery PDF
This is a back propagation program ai limitations of the expert system ppt styles gallery pdf template with various stages. Focus and dispense information on eight stages using this creative set, that comes with editable features. It contains large content boxes to add your information on topics like development cost high, difficult maintain, specific domain, logic decision, expert system not widely used or tested. You can also showcase facts, figures, and other relevant content using this PPT layout. Grab it now.
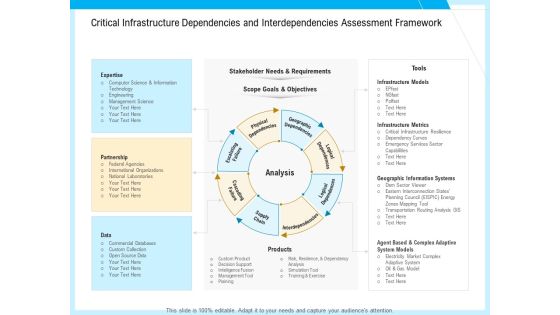
IT And Cloud Facilities Management Critical Infrastructure Dependencies And Interdependencies Assessment Framework Professional PDF
Presenting it and cloud facilities management critical infrastructure dependencies and interdependencies assessment framework professional pdf to provide visual cues and insights. Share and navigate important information on eight stages that need your due attention. This template can be used to pitch topics like stakeholder needs and requirements, scope goals and objectives, physical dependencies, geographic dependencies, logical dependences, interdependencies, supply chain, cascading failure, escalating failure. In addition, this PPT design contains high-resolution images, graphics, etc, that are easily editable and available for immediate download.
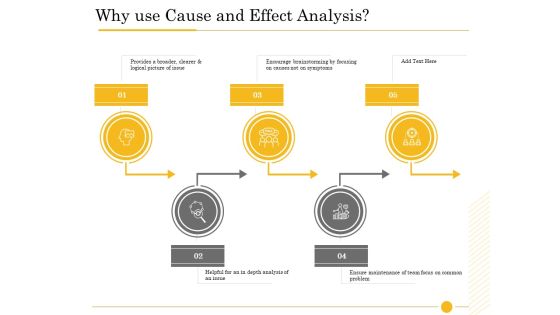
The Fishbone Analysis Tool Why Use Cause And Effect Analysis Template PDF
Presenting the fishbone analysis tool why use cause and effect analysis template pdf to provide visual cues and insights. Share and navigate important information on five stages that need your due attention. This template can be used to pitch topics like depth analysis, ensure maintenance, encourage brainstorming focusing, logical picture issue, why use cause effect analysis. In addtion, this PPT design contains high-resolution images, graphics, etc, that are easily editable and available for immediate download.

Corporate Intelligence Business Analysis Data Integration Model Retail Ppt Pictures Visuals PDF
This is a corporate intelligence business analysis data integration model retail ppt pictures visuals pdf template with various stages. Focus and dispense information on three stages using this creative set, that comes with editable features. It contains large content boxes to add your information on topics like conceptual data integration modelling, logical data integration modelling, physical data integration modelling. You can also showcase facts, figures, and other relevant content using this PPT layout. Grab it now.

Configuration Management With Puppet Puppet Decision Tree For An Organisation Ppt Portfolio Topics PDF
The slide highlights about the Puppet decision tree for an organisation. This is a configuration management with puppet puppet decision tree for an organisation ppt portfolio topics pdf template with various stages. Focus and dispense information on five stages using this creative set, that comes with editable features. It contains large content boxes to add your information on topics like parameter, variable, value, conditional logic. You can also showcase facts, figures, and other relevant content using this PPT layout. Grab it now.
 Home
Home