Quotation Templates/icons/appstore.png
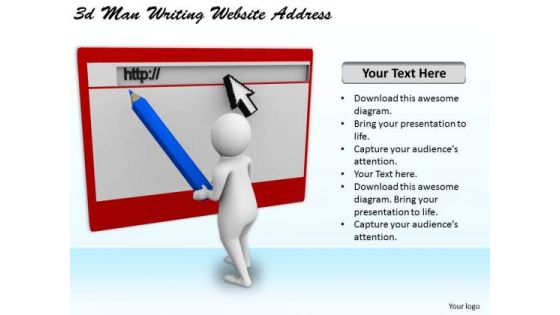
Business Strategy Model 3d Man Writing Website Address Character Models
Land The Idea With Our Businessstrategymodel3dmanwritingwebsiteaddresscharactermodelspowerpoint Templates. Help It Grow With Your Thoughts.

Business Strategy Plan 3d Render Team Unity Basic Concepts
Put Them On The Same Page With Our Businessstrategyplan3drenderteamunitybasicconcepts Powerpoint Templates. Your Team Will Sing From The Same Sheet.

Business Strategy Process 3d Men With Browser Window Concept Statement
Make Some Dough With Our Businessstrategyprocess3dmenwithbrowserwindowconceptstatement Powerpoint Templates. Your Assets Will Rise Significantly.

Company Business Strategy 3d Global Population Illustration Concept
Add Some Dramatization To Your Thoughts. Our Companybusinessstrategy3dglobalpopulationillustrationconcept Powerpoint Templates Make Useful Props.
Internet Business Strategy 3d Pyramid Made Of Human Icons Concept
Dreams Generate Thoughts, Thoughts Generate Ideas. Give Them Life With Our Internetbusinessstrategy3dpyramidmadeofhumaniconsconcept Powerpoint Templates.

Internet Business Strategy 3d Render Of Leadership And Followers Concept
Your Thoughts Will Be The Main Course. Provide The Dressing With Our Internetbusinessstrategy3drenderofleadershipandfollowersconcept Powerpoint Templates.

Internet Business Strategy 3d Render Of Red Leader Concept
Dribble Away With Our Internetbusinessstrategy3drenderofredleaderconcept Powerpoint Templates. Score A Goal With Your Ideas.
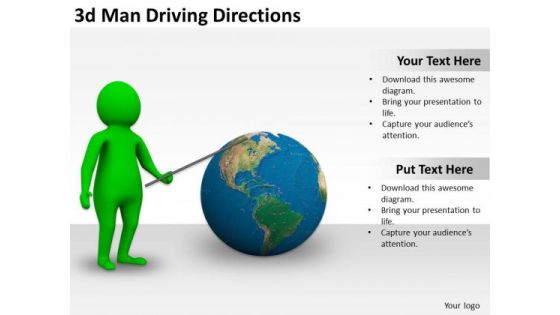
New Business Strategy 3d Man Driving Directions Adaptable Concepts
Place The Orders With Your Thoughts. Our Newbusinessstrategy3dmandrivingdirectionsadaptableconcepts Powerpoint Templates Know The Drill.
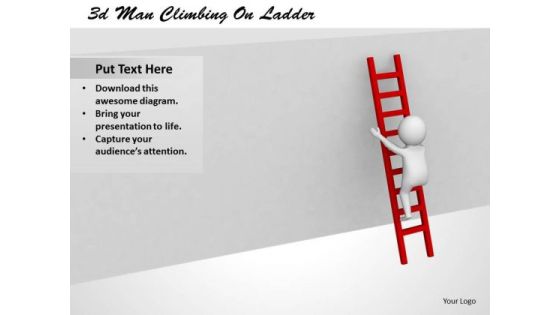
Business Strategy Execution 3d Man Climbing Ladder Characters
Rake In The Dough With
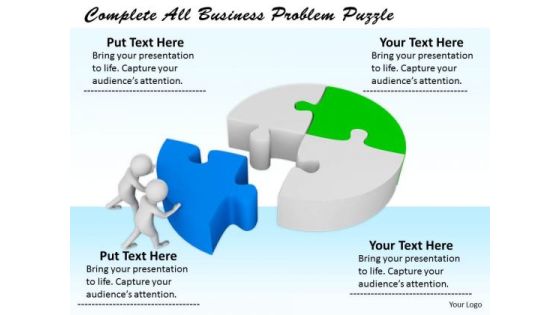
Business Strategy Formulation Complete All Problem Puzzle Concept Statement
Rake In The Dough With
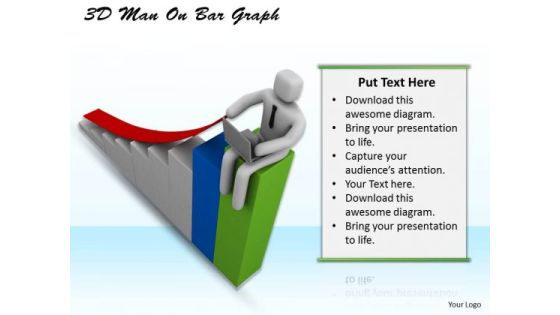
Modern Marketing Concepts 3d Man Bar Graph Business Statement
Rake In The Dough With

Stock Photo Golden Gears For Business Process Flow PowerPoint Slide
This unique image has backdrop of golden batch with 24 hours online text. This image displays the concept of 24 hours service. Define the concept 24 hours online supports with this suitable image. Use this image to make outstanding presentations.

Stock Photo Globe With Bar Graph For Business PowerPoint Slide
This image slide displays globe with bar graph. This image has been designed with graphic of bar graph, pie char, globe and growth arrow. Use this image slide, in your presentations to express views on finance, global growth and success. This image slide may also be used to exhibit any information which requires visual presentation in your presentations. This image slide will enhance the quality of your presentations.

Consulting Slides Increasing Percentage Growth Of Sales Business Presentation
This diagram is designed with graphics of text boxes showing percentage growth. Use this diagram in presentations to display growth in sales or profit. This diagram is editable and can be easily adjusted.
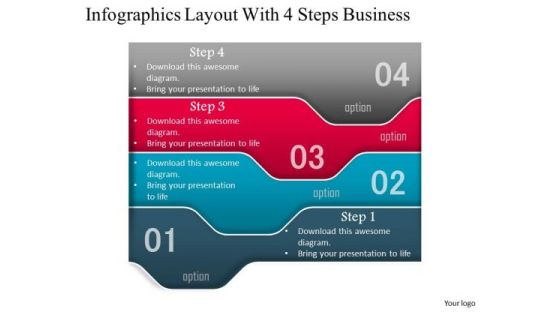
Consulting Slides Infographics Layout With 4 Steps Business Presentation
Infographics are visual representations of lengthy data or sets of information. This diagram displays infographic layout with four steps. Use this professional diagram to capture audiences attention.

Consulting Slides Man Pushing Puzzle In Its Place Business Presentation
This diagram has graphics of 3d man fixing puzzle piece in its place. This image portrays the concepts of solution, strategy etc. Use this good quality diagram to make professional presentations.

Consulting Slides Marketing Process Of Three Steps Business Presentation
This PowerPoint layout helps to describe the ordered set of steps required to complete a task. You can download this diagram to make awesome presentations in PowerPoint.

Consulting Slides Sales Process Of Four Steps Business Presentation
Highlight your presentation with this dynamically designed graphics. All text fields of this diagram are editable to present process sections more effectively. Use our diagram to illustrate your ability.

Consulting Slides Semi Circle Of Five Steps Business Presentation
This diagram is designed with graphics of semicircle of five steps. Present your views using this innovative slide and be assured of leaving a lasting impression. Use our diagram to illustrate your ability.

Consulting Slides Semi Circle Of Four Steps Business Presentation
This diagram is designed with graphics of semicircle of four steps. This PowerPoint layout will be ideal choice for illustrate four steps in presentations on product development, development process, process management, project management, etc.
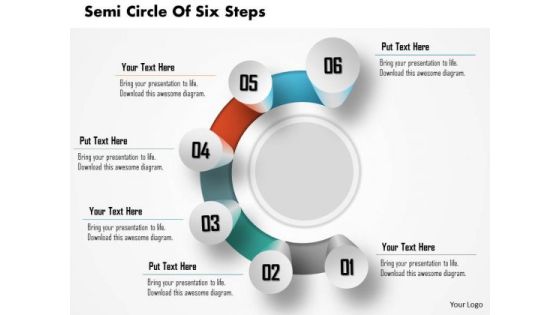
Consulting Slides Semi Circle Of Six Steps Business Presentation
This diagram is designed with graphics of semicircle of six steps. This PowerPoint layout will be ideal choice for illustrate six steps in presentations on product development, development process, process management, project management, etc.

Consulting Slides Semi Circle Of Three Steps Business Presentation
This diagram is designed with graphics of semicircle of three steps. This PowerPoint layout will be ideal choice for illustrate three steps in presentations on product development, development process, process management, project management, etc.

Consulting Slides Smart Phone Diagram With Signals Business Presentation
Create visually striking presentations with our above diagram of smart phone with wi-fi signals. This image relates to concepts of technology network and internet. Go ahead and add charm with this diagram.
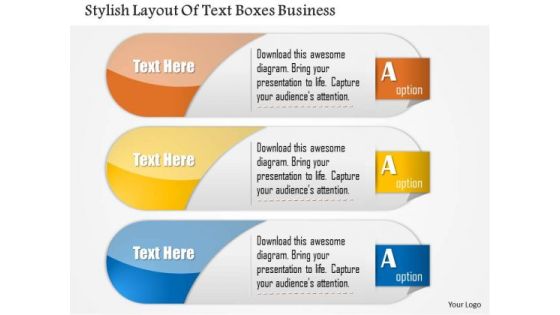
Consulting Slides Stylish Layout Of Text Boxes Business Presentation
Our awesome diagram consists with stylish text boxes. You can add text to text placeholders. This diagram is designed to help bullet-point your views and thoughts.
Consulting Slides Target Board With Arrow And Icons Business Presentation
Use this diagram to assign the targets to your team. You can use this diagram to provide information for target achievement. It helps you to make interactive presentations.

Consulting Slides Two Men Climbing On Mountain Business Presentation
This diagram is designed with graphics of two men trying to climb over the mountain. Concept of competition and meeting goals can be described with this image.
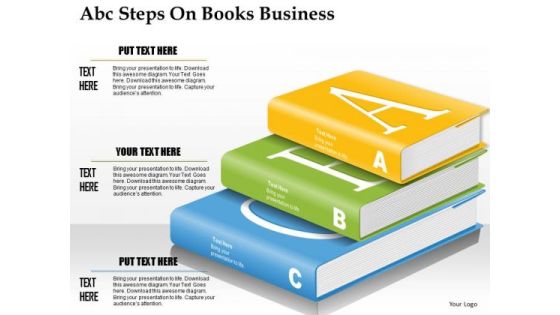
Consulting Slides Abc Steps On Books Business Presentation
Emphatically define your message with our above diagram for PowerPoint. This diagram displays ABC steps on books graphics. This unique PPT diagram makes your presentations more professional.
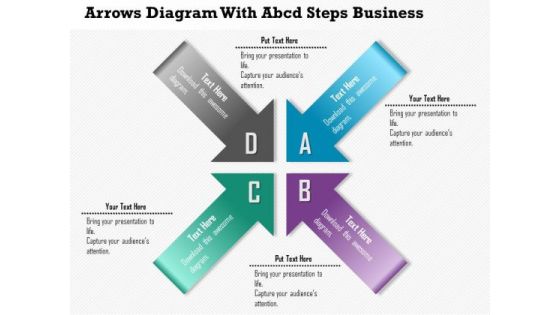
Consulting Slides Arrows Diagram With Abcd Steps Business Presentation
Use this Arrow diagram to integrate the principles of design thinking in your innovation processes. You can download this diagram to illustrate the sequence of steps required to complete a particular process.
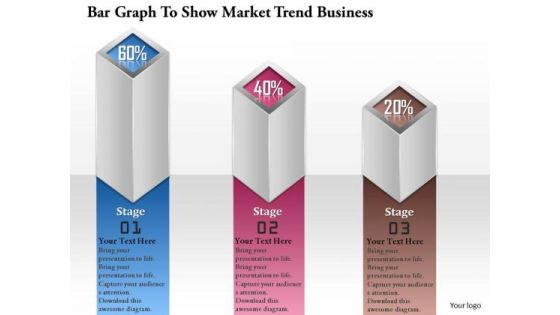
Consulting Slides Bar Graph To Show Market Trend Business Presentation
This bar graph can be very useful in presentations where you need to market trend. This can be used as a visualization tool because the audience can get a better view about what you want to show.
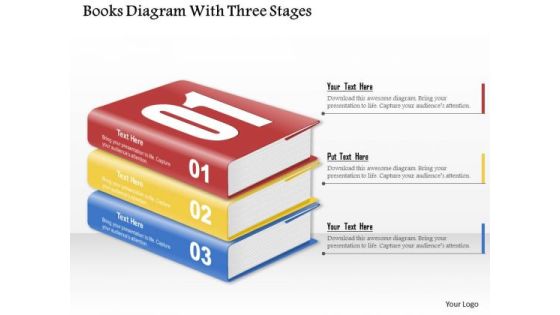
Consulting Slides Books Diagram With Three Stages Business Presentation
Emphatically define your message with our above diagram for PowerPoint. This diagram displays three steps on books graphics. This unique PPT diagram makes your presentations more professional.
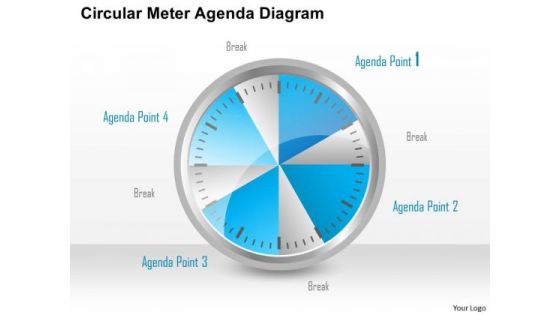
Consulting Slides Circular Meter Agenda Diagram Business Presentation
This circular process layout helps to describe the ordered set of steps required to complete a task. You can download this diagram to make awesome presentations in PowerPoint.

Consulting Slides Colorful Books With 4 Steps Business Presentation
Emphatically define your message with our above diagram for PowerPoint. This diagram displays four steps with books graphics. This unique PPT diagram makes your presentations more professional.

Consulting Slides Colorful Design Of Four Steps Business Presentation
This is an amazing diagram to explain process by dissolving the stages of a process, or by depicting how process works. It is capable of conveying the important characteristics more plainly than what words are capable of doing.

Consulting Slides Colorful Pencils Design With 6 Steps Business Presentation
This PPT layout will be ideal choice for illustrate six steps in presentations on product development, development process, process management, project management, etc.
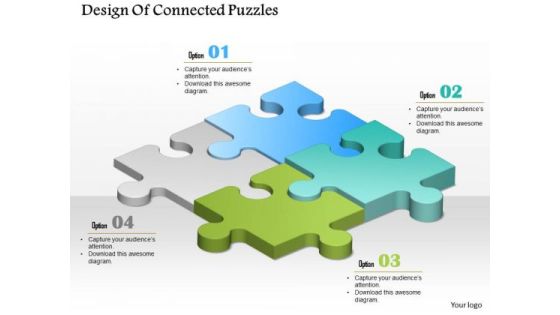
Consulting Slides Design Of Connected Puzzles Business Presentation
Highlight your presentation with this dynamically designed graphics. All text fields of our diagram can be individually edited to present process sections more effectively.

Business Framework Cultural Dimensions Theory Hofstede PowerPoint Presentation
This image slide displays Hofstede's cultural dimensions theory. Hofstede's cultural dimensions theory is a framework for cross-cultural communication, developed by Geert Hofstede. It describes the effects of a society's culture on the values of its members, and how these values relate to behavior, using a structure derived from factor analysis. this image slide will give edge to your presentations.
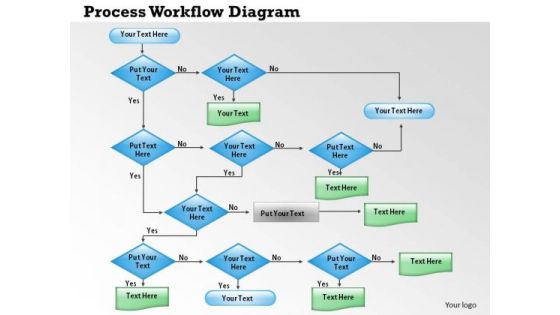
Business Framework Process Workflow Diagram PowerPoint PowerPoint Presentation
This image slide has been designed to displays process workflow diagram template. This image slide may be used in your presentations to depict workflow for a process. Create interesting presentations using this image slide.
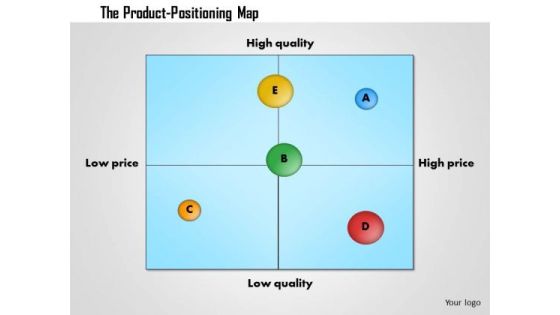
Business Framework Product Positioning Map Template PowerPoint Presentation
This image slide displays product positioning map template. This image slide has been designed with colorful dotes representing products on quality and price template. This image slide will make your presentations interesting.
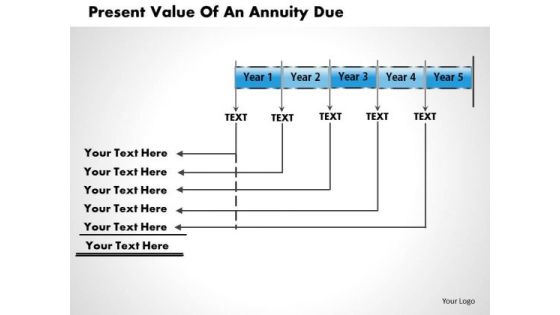
Business Framework Present Value Of An Annuity Due PowerPoint Presentation
This image slide displays present value foe annuity due template. This image slide may be in your presentations to express views on finance and accounting. This image slide will impart professional appearance to your presentations.

Business Framework Garbage Can Model Of Decision Making PowerPoint Presentation
This image slide has been designed to display garbage can model of decision making. This image slide has been designed with text boxes diagram having garbage line to calculate maturity. Use this image slide to express views on problems and solutions in management presentations. This image slide will enhance the quality of your presentations.

Business Framework Grand Strategy Selection Matrix PowerPoint Presentation
This image slide displays grand strategy selection matrix. This image slide has been designed with selection matrix with internal, maximize strength, overcome weakness and external attributes Use this image slide, in your presentations to express views on strategies, strengths, challenges and solutions. This image slide will help you express your views to target audience.
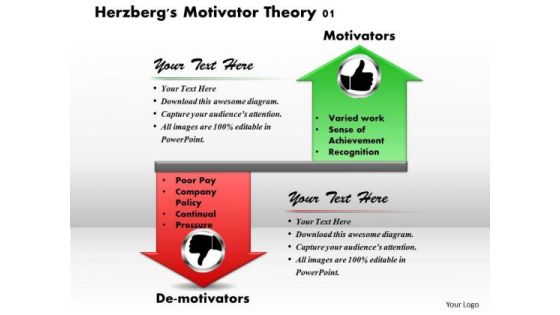
Business Framework Herzberg Motivator Theory PowerPoint Presentation 1
This image slide has been designed to display Herzberg's motivator theory innovative diagram. This image slide displays the concept of motivators and de-motivators in job satisfaction. Use this image slide to enhance the quality of your presentations.

Business Framework Raising Venture Capital Leap PowerPoint Presentation
Download this professional diagram to explain procedure for raising venture capital. Venture capital is raised in a series of stages or rounds. This diagram is perfect to make professional presentations.
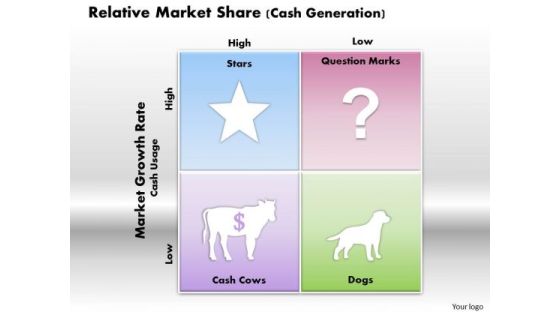
Business Framework Relative Market Share Cash Generation PowerPoint Presentation
Our above diagram is designed with concept of relative market share. Relative market share is comparing market shares of companies. This diagram also helps to explain concepts of market growth rate and cash generation.
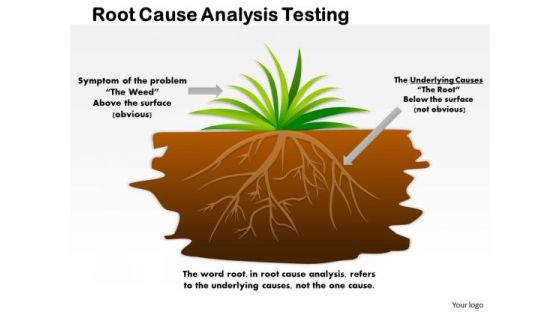
Business Framework Root Cause Analysis Testing PowerPoint Presentation
The purpose of root cause analysis is to strike at the root of a problem by finding and resolving its root causes. This diagram provides framework of root cause analysis. This template helps you to grab the attention of your listener.
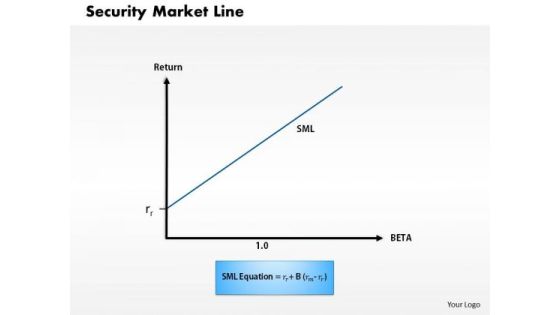
Business Framework Security Market Line 1 PowerPoint Presentation
This diagram displays graph of security market line. You can use line graph to plot changes in data over time, such as monthly revenue and earnings changes or daily changes in stock market prices.

Business Framework Security Market Line 11 PowerPoint Presentation
This diagram displays graph of security market line. You can use line graph to plot changes in data over time, such as monthly revenue and earnings changes or daily changes in stock market prices.
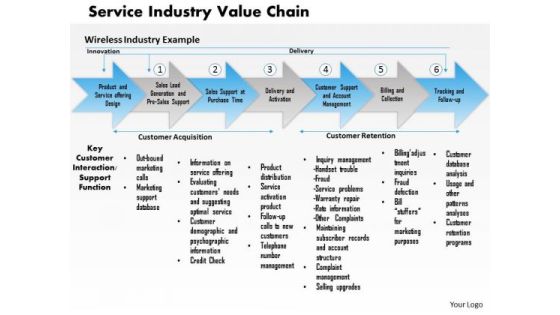
Business Framework Service Industry Value Chain PowerPoint Presentation
Value Chain Analysis helps you identify the ways in which you create value for your customers. Use this service industry value chain diagram to make professional presentations.

Business Diagram Key Performance Indicators Customer Service PowerPoint Ppt Presentation
Our above diagram provides framework of key performance indicators for customer service. It contains circular diagram in four segments depicting concepts of delivery problems, customer care training. Download this diagram to make professional presentations on customer service.
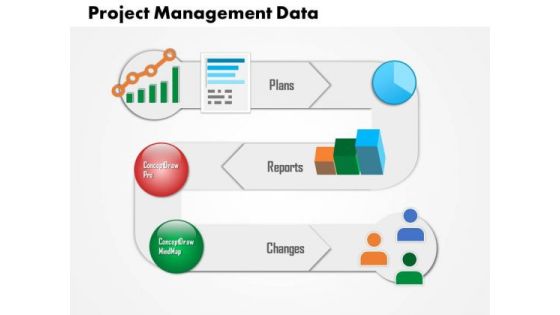
Business Diagram Project Management Data PowerPoint Ppt Presentation
This slide provides diagram for project management data. It contains spiral diagram with icons depicting plans reports and changes. Download this awesome diagram to capture your audiences attention.

Business Diagram Root Cause Failure PowerPoint Ppt Presentation
This diagram provides framework for root cause failure. It contains fish bone diagram. The purpose of root cause analysis is to strike at the root of a problem by finding and resolving its root causes. This template helps you to grab the attention of your listener.

Business Diagram Smart Goals Acronym PowerPoint Ppt Presentation
This slide displays smart goals acronym. This diagram provides details explanation of smart goals. Smart goals are specific, measurable, assignable, and realistic and time based. This template helps you to grab the attention of your listener.
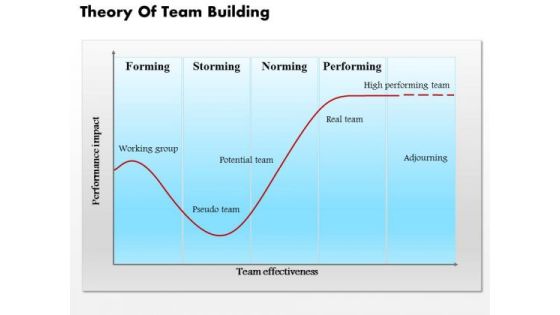
Business Diagram Theory Of Team Building PowerPoint Ppt Presentation
This slide depicts theory of tem building. It contains graph of performance impact and team effectiveness. It reflects steps of team building forming, storming, norming and performing. Download this awesome diagram to capture your audience

Business Diagram What Is Brand Value PowerPoint Ppt Presentation
This diagram is based on concept of brand value. Use this diagram to measure brand value. Economic profits and brand earnings measures brand value. This template helps you to grab the attention of your listener.
Business Diagram Illustration Of Different Smiley Icons Presentation Template
This image slide displays graphic of different smiley icons. This image slide depicts diversity. Use this PowerPoint template, in your presentations to express views on teamwork and management or global views. This image slide will make your presentations colorful.
Business Diagram Illustration Of Green Energy Icons Presentation Slide Template
This power point diagram template has been crafted with graphic of green energy icons. This diagram slide contains the concept of green energy production. Use this diagram slide in your presentation and display energy related topics.
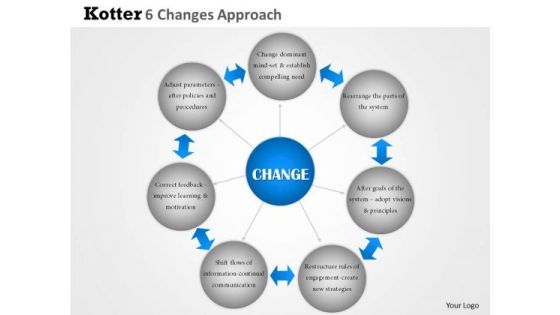
Business Framework Kotter 6 Changes Approach PowerPoint Presentation
This diagram displays framework for Kotters 6 changes approach. It contains graphics of interconnected circles. The diagram illustrates change approaches like change dominant mind-set and establish compelling need, rearrange the parts of the system, adopt visions and principles, restructure rules of engagement to create new strategies, shift flows of information for continual communication, correct feedback to improve learning and motivation, adjust parameters after policies and procedures.

Business Framework Lean Manufacturing Tools And Techniques PowerPoint Presentation
This diagram displays framework for lean manufacturing tools and techniques. This professional slide contains circular diagram. This diagram defines basic steps of manufacturing process like identify exploit, subordinate, elevate and repeat. Use this diagram to describe various lean tools and techniques in more detail.
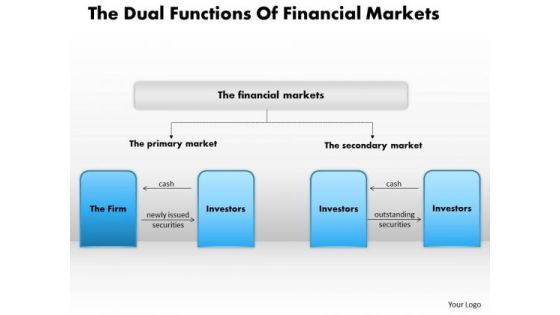
Business Framework The Dual Functions Of Financial Markets PowerPoint Presentation
Above slide displays framework for dual functions of financial markets. It contains chart for financial markets depicting primary market and secondary market. Make interactive presentations with this slide.


 Continue with Email

 Home
Home


