AI PPT Maker
Templates
PPT Bundles
Design Services
Business PPTs
Business Plan
Management
Strategy
Introduction PPT
Roadmap
Self Introduction
Timelines
Process
Marketing
Agenda
Technology
Medical
Startup Business Plan
Cyber Security
Dashboards
SWOT
Proposals
Education
Pitch Deck
Digital Marketing
KPIs
Project Management
Product Management
Artificial Intelligence
Target Market
Communication
Supply Chain
Google Slides
Research Services
 One Pagers
All Categories
-
Home
- Customer Favorites
- Questionnaire Survey
Questionnaire Survey
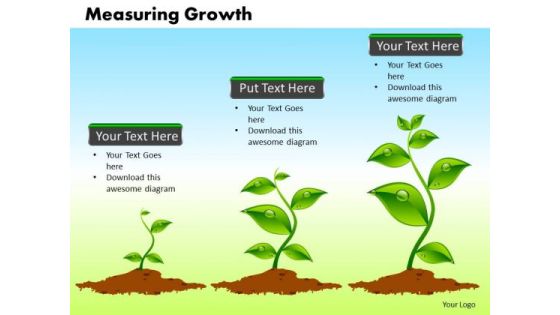
Business Process PowerPoint Templates Business Measuring Growth Ppt Slides
Business Process PowerPoint Templates Business Measuring Growth PPT Slides-This Diagram shows growing plants that is a conceptual representation for measuring growth -Business Process PowerPoint Templates Business Measuring Growth PPT Slides-This template can be used for presentations relating to Accounting, Accounts, Analysis, Business, Capital, Cash, Coins, Concept, Conceptual, Corporate, Data, Detail, Earnings, Evaluate, Finance, Financial, Gains, Golden, Green, Growing, Growth, Hand, Income, Increasing, Indicator, Measuring

Business Process PowerPoint Templates Sales Measuring Growth Ppt Slides
Business Process PowerPoint Templates Sales Measuring Growth PPT Slides-This Diagram shows growing plants that is a conceptual representation for measuring growth -Business Process PowerPoint Templates Sales Measuring Growth PPT Slides-This template can be used for presentations relating to Accounting, Accounts, Analysis, Business, Capital, Cash, Coins, Concept, Conceptual, Corporate, Data, Detail, Earnings, Evaluate, Finance, Financial, Gains, Golden, Green, Growing, Growth, Hand, Income, Increasing, Indicator, Measuring
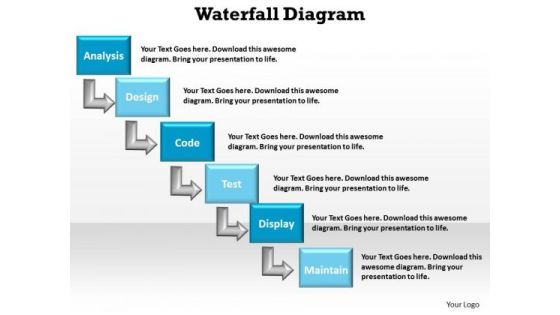
Business Editable PowerPoint Templates Business Waterfall Diagram Ppt Slides
Business Editable PowerPoint Templates Business waterfall diagram PPT Slides-The waterfall model is a sequential design process, in which progress is seen as flowing steadily downwards (like a waterfall) This ppt can be used for concepts relating to-Conception, Initiation, Analysis, Design, Construction, Testing, Production/Implementation, and Maintenance.
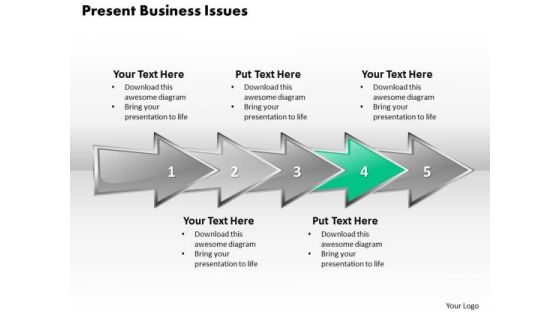
Ppt 3d Horizontal Abstraction To Present Business Issues Six Steps PowerPoint Templates
PPT 3d horizontal abstraction to present business issues six steps PowerPoint Templates-Use this 3D Arrow Diagram to Illustrate Processes Step by Step in PowerPoint Presentations -PPT 3d horizontal abstraction to present business issues six steps PowerPoint Templates-analysis, arrow, background, business, chart, communication, concept, construction, delivery, design, development, engineering, fabrication, feasibiliti, generated, growth, idea, industry, making, production, products, science, sequence, shape
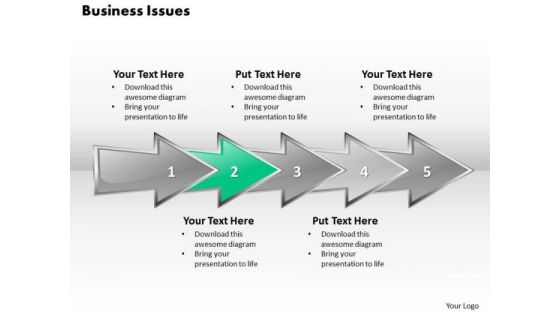
Ppt 3d Linear Abstraction To Demonstrate Business Issues Six Steps PowerPoint Templates
PPT 3d linear abstraction to demonstrate business issues six steps PowerPoint Templates-Use this 3D Arrow Diagram to Illustrate Processes Step by Step in PowerPoint Presentations -PPT 3d linear abstraction to demonstrate business issues six steps PowerPoint Templates-analysis, arrow, background, business, chart, communication, concept, construction, delivery, design, development, engineering, fabrication, feasibiliti, generated, growth, idea, industry, making, production, products, science, sequence, shape
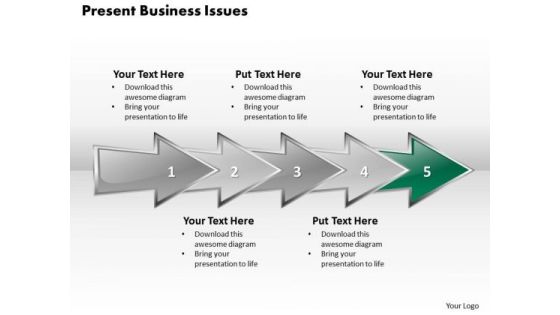
Ppt 3d Linear Abstraction To Present Business Issues Six Steps PowerPoint Templates
PPT 3d linear abstraction to present business issues six steps PowerPoint Templates-Use this 3D Arrow Diagram to Illustrate Processes Step by Step in PowerPoint Presentations -PPT 3d linear abstraction to present business issues six steps PowerPoint Templates-analysis, arrow, background, business, chart, communication, concept, construction, delivery, design, development, engineering, fabrication, feasibiliti, generated, growth, idea, industry, making, production, products, science, sequence, shape
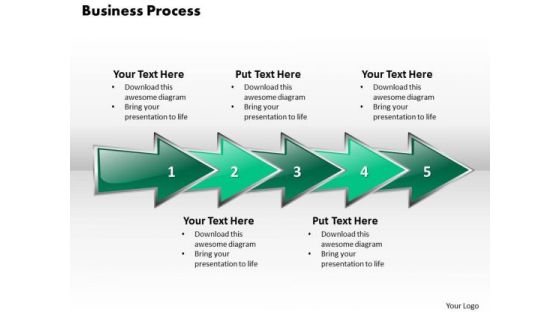
Ppt 3d Linear Abstraction To Show Business Issues Six Steps PowerPoint Templates
PPT 3d linear abstraction to show business issues six steps PowerPoint Templates-Use this 3D Arrow Diagram to Illustrate Processes Step by Step in PowerPoint Presentations -PPT 3d linear abstraction to show business issues six steps PowerPoint Templates-analysis, arrow, background, business, chart, communication, concept, construction, delivery, design, development, engineering, fabrication, feasibiliti, generated, growth, idea, industry, making, production, products, science, sequence, shape

Ppt Colorful Arrows PowerPoint 2010 Describing Seven Stage Templates
PPT colorful arrows powerpoint 2010 describing seven stage Templates-This PowerPoint Diagram shows you the Successive Representation of Management Procedures using Circular arrows. It consists of Seven stages or approaches or factors or components.-PPT colorful arrows powerpoint 2010 describing seven stage Templates-analysis, arrow, background, business, chart, communication, concept, construction, delivery, design, development, engineering, fabrication, feasibiliti, generated, growth, idea, industry, making, production, products, science, sequence, shape

Business Diagram With Dollars Money PowerPoint Templates And PowerPoint Themes 1012
Visually support your Microsoft office PPT Presentation with our above template illustrating a business diagram on stack of dollars. This image represents the concept of financial analysis. This image has been conceived to enable you to emphatically communicate your ideas in your Business PPT presentations on finance, market, investment and success. Create captivating presentations to deliver comparative and weighted arguments.
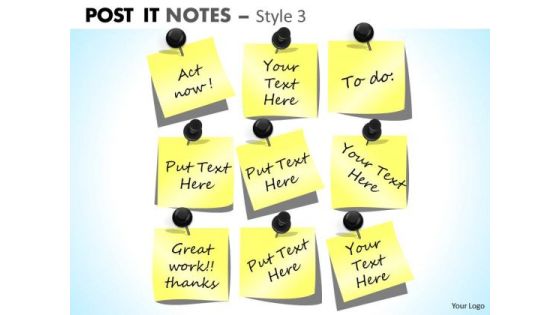
Mba Models And Frameworks Post It Notes Style 3 Consulting Diagram
Light The Fuse With Our MBA Models And Frameworks post it notes style 3 Consulting Diagram Powerpoint Templates. Blast The Audience With The Force Of Your Ideas. In Depth Analysis Of Situations Is Your Forte. Use Our MBA Models And Frameworks post it notes style 3 Consulting Diagram Powerpoint Templates To Acquaint Your Listeners With Your Results.

Business Framework Decision Matrix PowerPoint Presentation
This image slide displays decision matrix business framework. Use this image slide to express views on marketing research and analysis. You may change color size and orientation of any icon to your liking. This image slide will impart professional appearance to your presentations.
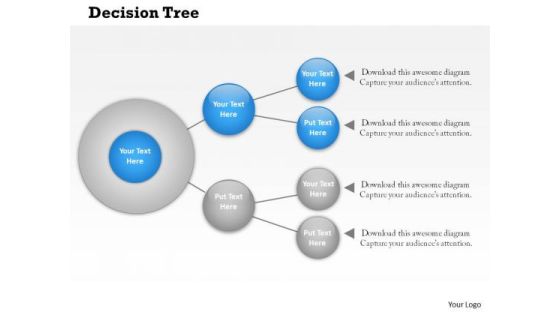
Business Framework Decision Tree In PowerPoint Presentation
This image slide displays decision tree business framework. Use this image slide to express views on marketing research and analysis. You may change color size and orientation of any icon to your liking. This image slide will impart professional appearance to your presentations.
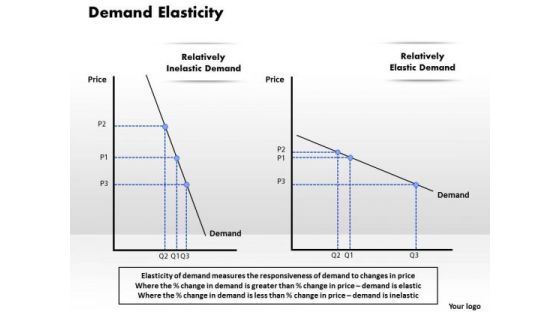
Business Framework Demand Elasticity PowerPoint Presentation
This image slide displays demand elasticity business framework. Use this image slide to express views on marketing mix analysis. You may change color size and orientation of any icon to your liking. This image slide will impart professional appearance to your presentations.

Business Framework Demand Generation PowerPoint Presentation
This image slide displays demand generation business framework. Use this image slide to express views on marketing research and analysis. You may change color size and orientation of any icon to your liking. This image slide will impart professional appearance to your presentations.
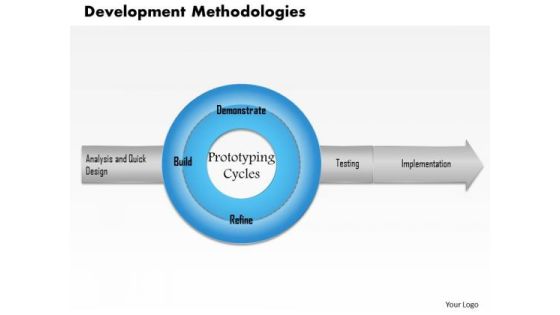
Business Framework Development Methodologies PowerPoint Presentation
This image slide displays business framework for development methodologies. This image slide may be used in your presentations to express views on business, marketing, research and analysis. You may change color, size and orientation of any icon to your liking. Create professional presentations using this image slide.

Business Framework Diminishing Marginal Returns PowerPoint Presentation
This image slide displays business framework for diminishing marginal returns. This image slide may be used in your presentations to depict business planning and market analysis. You may change color, size and orientation of any icon to your liking. Create wonderful presentations using this image slide.
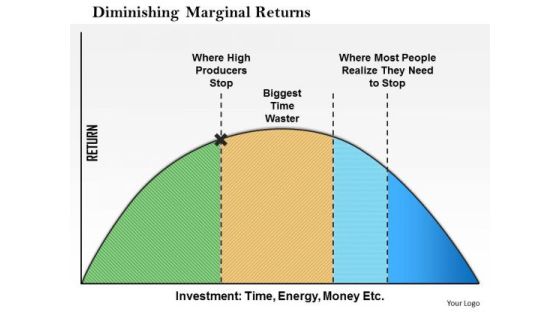
Business Framework Diminishing Marginal Returns PowerPoint Presentation 1
This image slide displays business framework for diminishing marginal returns. This image slide may be used in your presentations to depict business planning and market analysis. You may change color, size and orientation of any icon to your liking. Create wonderful presentations using this image slide.
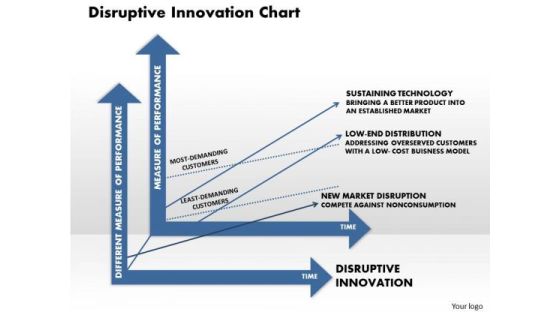
Business Framework Disruptive Innovation Chart PowerPoint Presentation
This image slide displays business framework for diminishing marginal returns. This image slide may be used in your presentations to depict analysis in marketing and business. You may change color, size and orientation of any icon to your liking. Create wonderful presentations using this image slide.
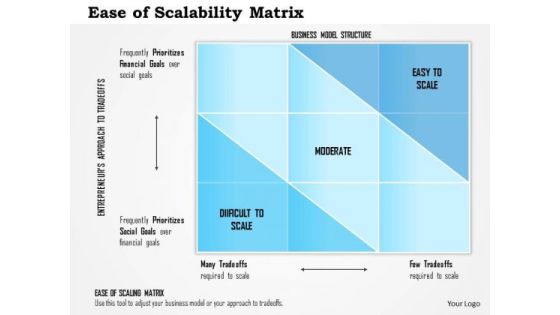
Business Framework Ease Of Scalability Matrix PowerPoint Presentation
This image slide displays ease of scalability matrix business framework. Use this image slide to express views on business structure model and business environment analysis. You may change color size and orientation of any icon to your liking. This image slide will impart professional appearance to your presentations.
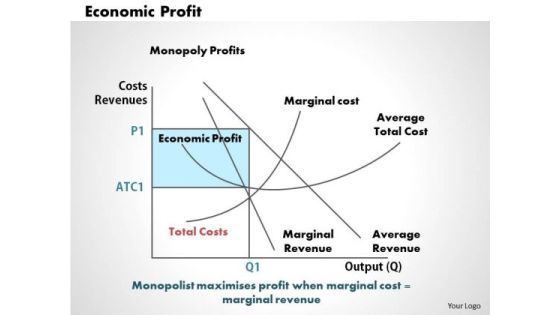
Business Framework Economic Profit PowerPoint Presentation
This image slide displays business framework for economic profit. This image slide may be used in your presentations to depict analysis in marketing profits and accounting business management. You may change color, size and orientation of any icon to your liking. Create wonderful presentations using this image slide.

Business Framework Efficiency Ratio PowerPoint Presentation
This image slide has been designed to depict efficiency ratio. This image slide displays formulas to calculate asset turnover ratio and NWC ratio. This image slide may be used to exhibit business marketing analysis in your presentations. This image slide will give edge to your presentations.
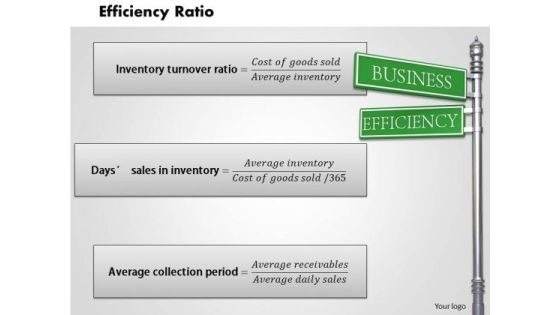
Business Framework Efficiency Ratio PowerPoint Presentation 1
This image slide has been designed to depict efficiency ratio. This image slide displays formulas to calculate average collection period, days sales in inventory, inventory turnover ratio. This image slide may be used to exhibit business marketing analysis in your presentations. This image slide will give edge to your presentations.
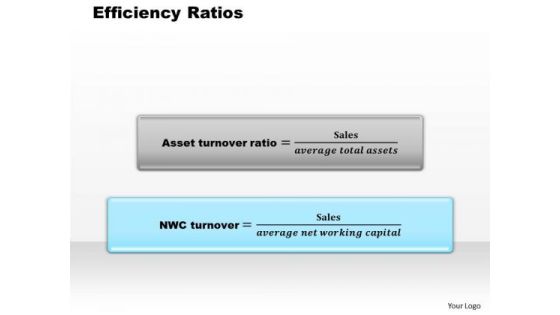
Business Framework Efficiency Ratios PowerPoint Presentation
This image slide has been designed to depict efficiency ratio. This image slide displays formulas to calculate asset turnover ratio and NWC ratio. This image slide may be used to exhibit business marketing analysis in your presentations. This image slide will give edge to your presentations.
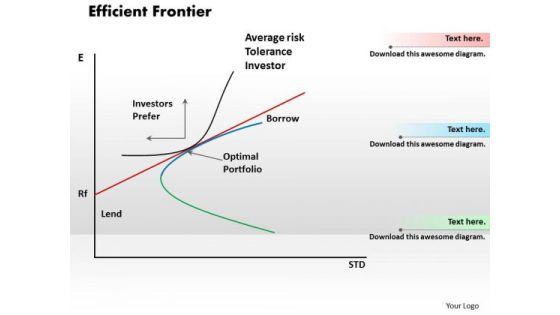
Business Framework Efficient Frontier PowerPoint Presentation
This image slide has been designed to depict efficient frontier diagram. This image slide display graph to show expected level of return for its level of risk. This image slide may be used to exhibit business marketing analysis in your presentations. This image slide will give edge to your presentations.
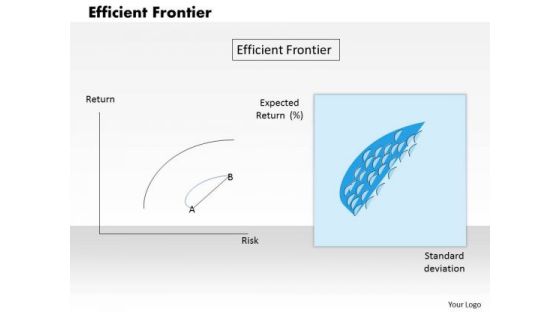
Business Framework Efficient Frontier PowerPoint Presentation 1
This image slide has been designed to depict efficiency ratio. This image slide displays formulas to calculate asset ratio and NWC ratio. This image slide may be used to exhibit business marketing analysis in your presentations. This image slide will give edge to your presentations.
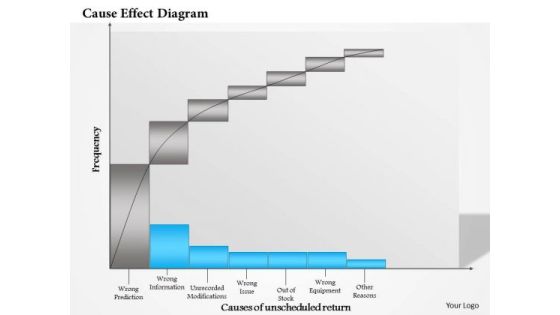
Business Framework Cause Effect PowerPoint Presentation
Discuss the process of root cause analysis with this exclusive PPT. This diagram PPT has been crafted with cause effect or fishbone diagram. This is a Japanese practice for finding the root cause of problem. Use this PPT in your business and production related presentations.
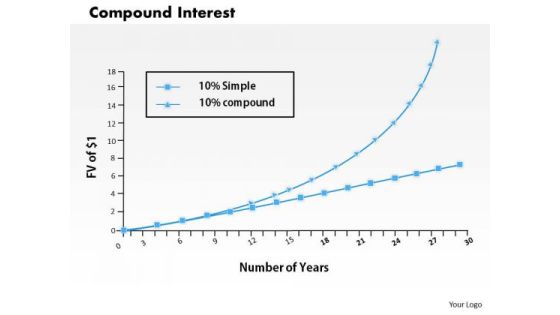
Business Framework Compound Interest PowerPoint Presentation
This business framework template displays compound interest graph. This image slide has been crafted to depict financial ratio analysis. Use this image slide, in your presentations to express views on business and marketing management. This image slide will enhance the quality of your presentations.

Business Framework Cultural Dimensions Theory Hofstede PowerPoint Presentation
This image slide displays Hofstede's cultural dimensions theory. Hofstede's cultural dimensions theory is a framework for cross-cultural communication, developed by Geert Hofstede. It describes the effects of a society's culture on the values of its members, and how these values relate to behavior, using a structure derived from factor analysis. this image slide will give edge to your presentations.
Business Framework Porters Five Forces PowerPoint Presentation
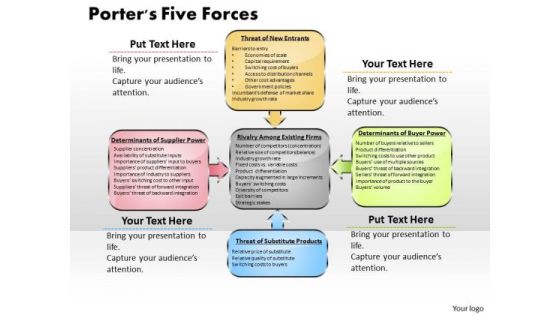
This image slide has been designed to displays Porter's five forces analysis model diagram. This conceptual image slide is a framework to analyze level of competition within an industry and business strategy development. This image slide will help you make professional presentations.
Business Framework Functional Performance PowerPoint Presentation
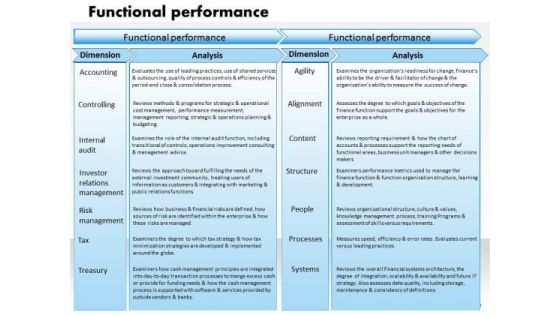
This image slide has been designed to displays functional performance diagram. This image slide has been designed with textboxes horizontal process diagram with functional performance, dimensions and analysis attributes. Use this image slide in business and marketing presentations to depict accounting, risk management, tax and various dimensions of business. This image slide will enhance the quality of your presentations.

Business Diagram Root Cause Failure PowerPoint Ppt Presentation
This diagram provides framework for root cause failure. It contains fish bone diagram. The purpose of root cause analysis is to strike at the root of a problem by finding and resolving its root causes. This template helps you to grab the attention of your listener.

Business Diagram Pie Chart Showing Percentages Presentation Slide Template
This power point diagram template has been designed with graphic of pie chart with percentage values. Use this pie chart for result analysis display in any business presentation. Build an exclusive presentation for your viewers by using this professional diagram template.

Business Framework Kaizen Event Process PowerPoint Presentation
This slide displays framework of kaizen event process. It contains rectangle with five sections and one arrow in center. This diagram depicts sequence of events like plan and create charter, train and process walk, root cause analysis and future state plan, improve process, sustain process, report out and follow-up. Download this diagram as a tool for business presentations.

Business Framework Lead Management Strategies PowerPoint Presentation
The above template displays diagram of lead management strategies. It contains funnel diagram depicting solution for selling process. It defines lead management strategies like lead generation; qualify lead and discovery, meeting opportunity, analysis needs, assessment solution design and presentation, negotiation. Use this funnel diagram for sales presentations.\n\n\n\n\n Use this business diagram to more effectively track progress to goal during the lead generation process.

Business Framework The Kaizen Event Process PowerPoint Presentation
This slide displays framework of kaizen event process. It five sections on an arrow. This diagram depicts sequence of events like plan and create charter, train and process walk, root cause analysis and future state plan, improve process, sustain process, report out and follow-up. Download this diagram as a tool for business presentations.
Business Framework Brand Image Theory PowerPoint Presentation
Colored chart graphic with multiple milestones has been used to decorate this Power Point template slide. This PPT slide contains the concept of data prediction. This slide shows big data from descriptive to predictive way. Use this PPT slide for business data analysis related presentation.

Business Framework Gears Business Timeline Roadmap PowerPoint Presentation PowerPoint Presentation
Display GAP analysis in your business presentation by using this exclusive PPT slide. This slide template has been crafted with graphic of graph for execution plan and strategy plan. Make an innovative presentation for planning related topics by using this PPT slide.
Business Framework Six Sigma Methodology Framework Lean Techniques PowerPoint Presentation
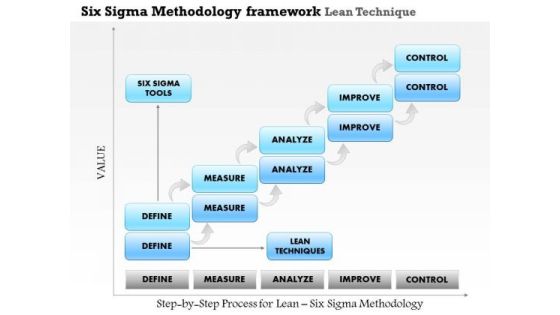
This business framework power point template has been crafted with concept of lean techniques and six sigma methodology. You can also explain the six sigma tools with analysis and control. Use this diagram PPT and build an exclusive presentation for business management and strategy related topics.

Business Framework Predictive Analytics PowerPoint Presentation
Explain the concept of predictive analytics in any presentation with this unique PPT slide. This PPT diagram slide contains the graphic of arrow diagram with three text boxes on a graph. This PPT slide shows the growth analysis an make a professional presentation.
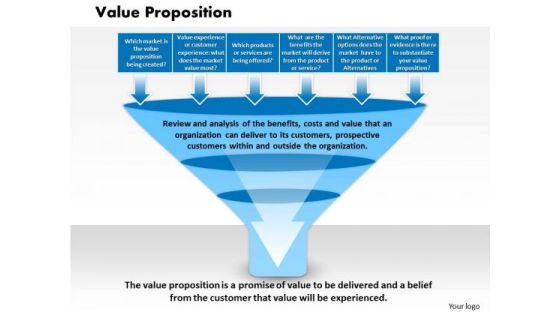
Business Framework Value Proposition PowerPoint Presentation
This diagram provides business framework for value proposition. It contains graphics of funnel diagram. Use this diagram to review and analysis of the benefits, costs and value that an organization can deliver to its customers, prospective customers within and outside the organization.

Stock Photo Pie And Bar Graph With 2015 PowerPoint Slide
This Power Point image template slide has been crafted with graphic of pie and bar graph and 2015 year text. This PPT slide contains the concept of business and financial analysis. Use this image slide and build quality presentation for your viewers.

Business Diagram Agenda Five Points Timeline Infographic Presentation Template
This PowerPoint template displays agenda five points timeline Infographic. This business diagram has been designed with graphic of timeline with five points and text space. Use this diagram, in your presentations to display timeline, strategy, icons and business analysis. Make professional presentations using this business slide

Business Diagram Agenda Four Points Vertical Textboxes Diagram Presentation Template
This PowerPoint template displays agenda four Points vertical textboxes diagram. This business diagram has been designed with four vertical text boxes with icons. Use this diagram, in your presentations to display timeline, strategy, icons and business analysis. Create professional presentations using this diagram slide.
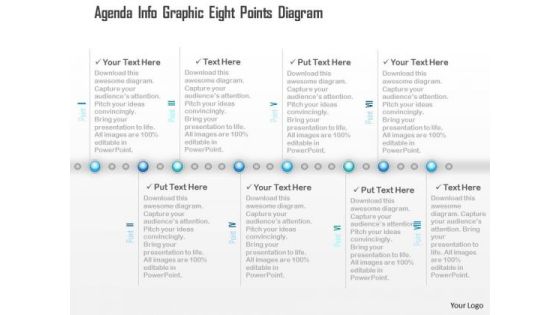
Business Diagram Agenda Info Graphic Eight Points Diagram Presentation Template
This business diagram displays eight points agenda info graphic. This business slide has been designed with graphic of line and with circles and eight points blocks. Use this diagram, in your presentations to display timeline, strategy, icons and business analysis. Create professional presentations using this diagram slide.
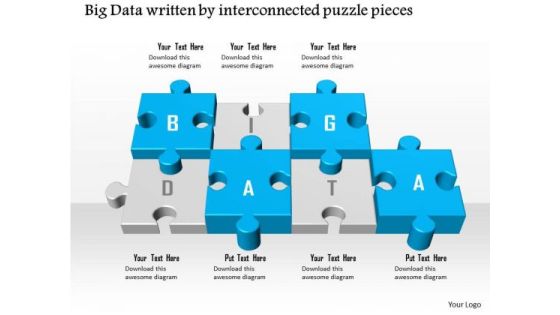
Business Diagram Big Data Written By Interconnected Puzzle Pieces Ppt Slide
Graphic of interconnected puzzles pieces with big data text are used to design this technology diagram. This diagram helps to depict the concept of data solution and strategy. Display your own analysis in any presentation by using this innovative template and build quality presentation for your viewers.
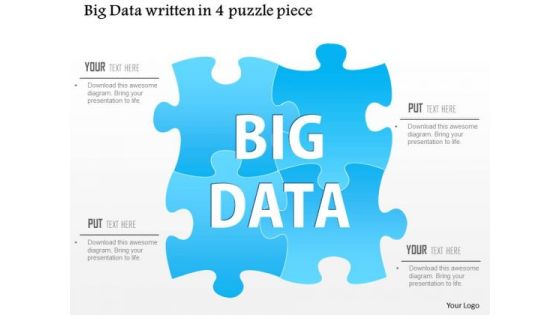
Business Diagram Big Data Written In A 4 Puzzle Piece Ppt Slide
Graphic of interconnected puzzles pieces with big data text are used to design this technology diagram. This diagram helps to depict the concept of data solution and strategy. Display your own analysis in any presentation by using this innovative template and build quality presentation for your viewers.
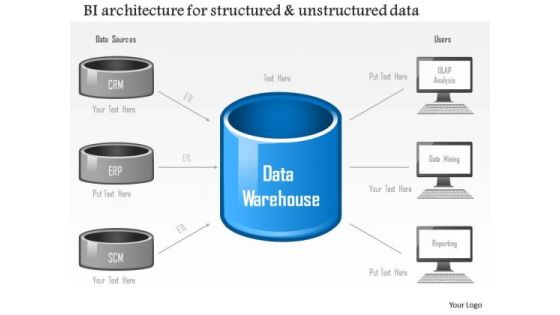
Business Diagram Business Intelligence Architecture For Structured And Unstructured Data Ppt Slide
Graphic of servers and data base has been used to design this technology diagram. It depicts data sources like CRM, ERP, and SCM on side and Users like OLAP analysis, data mining and reporting on other side. Use this diagram to build professional presentation.
Business Diagram Icons For Good Marketing Strategy Presentation Template
This power point template has been designed with graphic of bar graph, suitcase and meeting business icons. These business icons are used to display the concept of business result analysis and meeting. Use this diagram for business related topics in any presentations.
Venn Duagram With Business Icons PowerPoint Template
Create visually stunning and define your presentations in a unique and inspiring manner using our above template which contains a graphic of Venn diagram with business icons. You may use this diagram to exhibit strategic planning and analysis. Create captivating presentations using this business diagram.

Dashboard With Business Icons Powerpoint Slides
This PowerPoint template graphics of meter chart with business icons. Download this PPT chart to simplify business data analysis. This PowerPoint slide is of great help in the business sector to make realistic presentations and provides effective way of presenting your newer thoughts.
Linear Steps Timeline Chart And Icons Powerpoint Slides
This PowerPoint template graphics of linear timeline steps. Download this PPT chart for yearly business performance analysis. This PowerPoint slide is of great help in the business sector to make realistic presentations and provides effective way of presenting your newer thoughts.
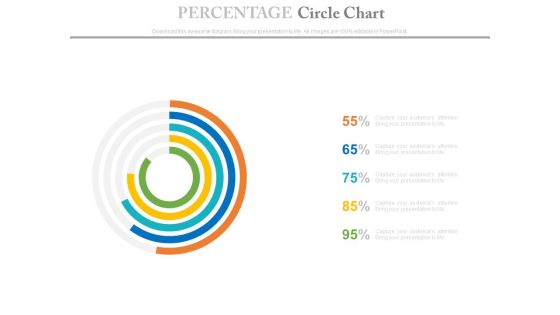
Percentage Data Circle Chart Powerpoint Slides
This PowerPoint template has been designed with circle chart. Download this PPT chart to depict financial ratio analysis. This PowerPoint slide is of great help in the business sector to make realistic presentations and provides effective way of presenting your newer thoughts.

Percentage Data Growth Chart Powerpoint Slides
This PowerPoint template has been designed with percentage data growth chart. Download this PPT chart to depict financial ratio analysis. This PowerPoint slide is of great help in the business sector to make realistic presentations and provides effective way of presenting your newer thoughts.

Five Staged Linear Year Based Timeline For Marketing Powerpoint Slides
This five staged linear timeline slide design can be used for marketing project planning and project management. This timeline template can be used in presentations where you need to display a roadmap or it may be used for business target analysis.
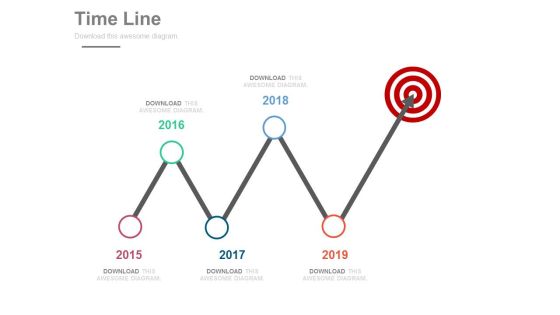
Five Staged Sequential Timeline For Target Achievement Powerpoint Slides
This PowerPoint timeline slide design can be used to display target strategy. It contains sequential timeline diagram. This timeline template can be used in presentations where you need to display a roadmap or it may be used for business target analysis.
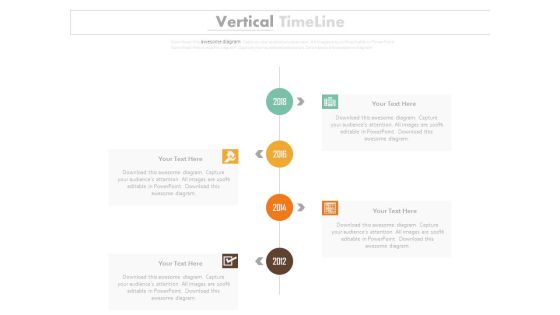
Four Staged Vertical Timeline For Year Based Growth Powerpoint Slides
This PowerPoint timeline slide design can be used to display yearly business growth. It contains four staged vertical timeline diagram. This timeline template can be used in presentations where you need to display a roadmap or it may be used for business target analysis.
Linear Timeline With Year And Business Icons Powerpoint Slides
This timeline slide design can be used to display yearly business growth. It contains timeline diagram with years and business icons. This timeline template can be used in presentations where you need to display a roadmap or it may be used for business target analysis.
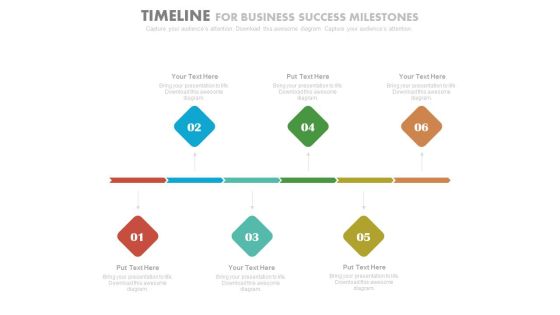
Six Staged Linear Timeline For Business Success Milestones Powerpoint Slides
This timeline slide design can be used to display business success milestones. It contains six staged linear timeline diagram. This timeline template can be used in presentations where you need to display a roadmap or it may be used for business target analysis.

Bar Graph Displaying Profit Growth Powerpoint Slides
This PowerPoint template has been designed with six point?s bar graph with icons. This PPT slide can be used to prepare presentations for marketing reports and also for financial data analysis. You can download finance PowerPoint template to prepare awesome presentations.
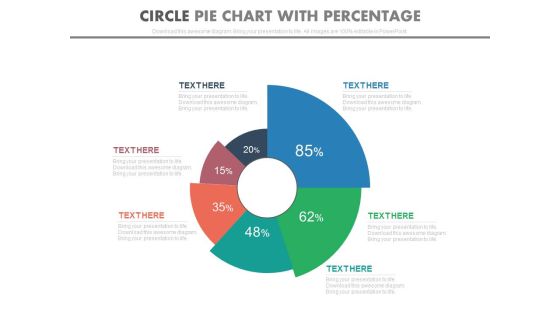
Pie Chart With Increasing Percentage Values Powerpoint Slides
This PowerPoint template has been designed with diagram of pie chart with increasing percentage values. This PPT slide can be used to prepare presentations for profit growth report and also for financial data analysis. You can download finance PowerPoint template to prepare awesome presentations.
