AI PPT Maker
Templates
PPT Bundles
Design Services
Business PPTs
Business Plan
Management
Strategy
Introduction PPT
Roadmap
Self Introduction
Timelines
Process
Marketing
Agenda
Technology
Medical
Startup Business Plan
Cyber Security
Dashboards
SWOT
Proposals
Education
Pitch Deck
Digital Marketing
KPIs
Project Management
Product Management
Artificial Intelligence
Target Market
Communication
Supply Chain
Google Slides
Research Services
 One Pagers
All Categories
-
Home
- Customer Favorites
- Quarterly Budget
Quarterly Budget
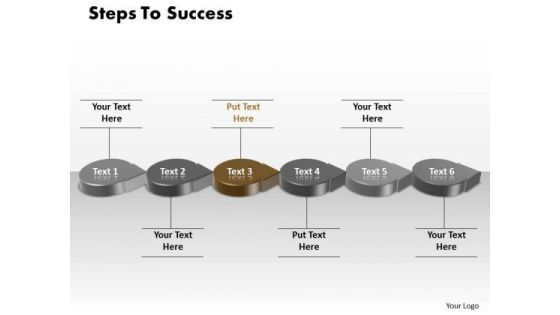
Ppt Brown Step To Success Using Circular Motion PowerPoint Arrow Templates
PPT brown step to success using circular motion powerpoint arrow Templates-This PowerPoint Diagram shows you the Circular way to represent Business components or losses in Business related Activities. This PowerPoint Diagram can be used in Investor presentations for Initial Public Offerings, Annual general meetings and financial seminars.-PPT brown step to success using circular motion powerpoint arrow Templates-achievement, active, advice, attempt, background, business, businessman, climb, competition, concept, develop, development, education, goal, graph, growth, improve, increase, industry, investment, ladder, level, man, management, manager, people, perform, progress, start, step, success, target, upward
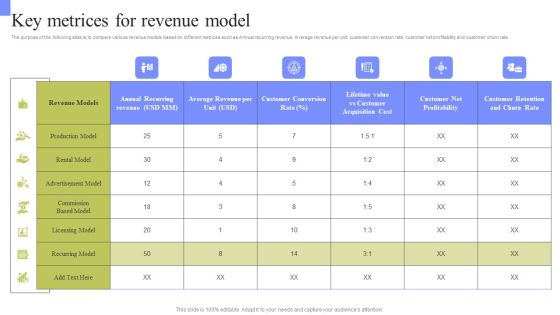
Periodic Revenue Model Key Metrices For Revenue Model Topics PDF
The purpose of the following slide is to compare various revenue models based on different metrices such as Annual recurring revenue, Average revenue per unit, customer conversion rate, customer net profitability and customer churn rate. Boost your pitch with our creative Periodic Revenue Model Key Metrices For Revenue Model Topics PDF. Deliver an awe-inspiring pitch that will mesmerize everyone. Using these presentation templates you will surely catch everyones attention. You can browse the ppts collection on our website. We have researchers who are experts at creating the right content for the templates. So you do not have to invest time in any additional work. Just grab the template now and use them.

Analysis Of Financial Ratios Before RPA Implementation Portrait PDF
This slide covers current annual financial indicators of organization before the implementation of automation. It includes gross margin, EBITDA, equity ratio,, changes in unit sales, inventory turnover ratio, return on equity before tax, etc. Boost your pitch with our creative Analysis Of Financial Ratios Before RPA Implementation Portrait PDF. Deliver an awe-inspiring pitch that will mesmerize everyone. Using these presentation templates you will surely catch everyones attention. You can browse the ppts collection on our website. We have researchers who are experts at creating the right content for the templates. So you do not have to invest time in any additional work. Just grab the template now and use them.
Global Artificial Market Trends In Medicare Brochure PDF
This slide shows global artificial market trends in healthcare sector to highlight scope of business intelligence tools. It includes annual growth trends, expected growth for next year, six years incremental value etc. Persuade your audience using this Global Artificial Market Trends In Medicare Brochure PDF. This PPT design covers six stages, thus making it a great tool to use. It also caters to a variety of topics including AI Market Growth, Investment Opportunities, AI Adoption. Download this PPT design now to present a convincing pitch that not only emphasizes the topic but also showcases your presentation skills.

Security Control Techniques For Real Estate Project Business Portfolio Of Construction Company Professional PDF
This slide indicates the business portfolio of the construction company covering details regarding the service provided, leadership, and annual revenue. It also includes details of the total number of employees recent project developments and certifications acquired. Formulating a presentation can take up a lot of effort and time, so the content and message should always be the primary focus. The visuals of the PowerPoint can enhance the presenters message, so our Security Control Techniques For Real Estate Project Business Portfolio Of Construction Company Professional PDF was created to help save time. Instead of worrying about the design, the presenter can concentrate on the message while our designers work on creating the ideal templates for whatever situation is needed. Slidegeeks has experts for everything from amazing designs to valuable content, we have put everything into Security Control Techniques For Real Estate Project Business Portfolio Of Construction Company Professional PDF
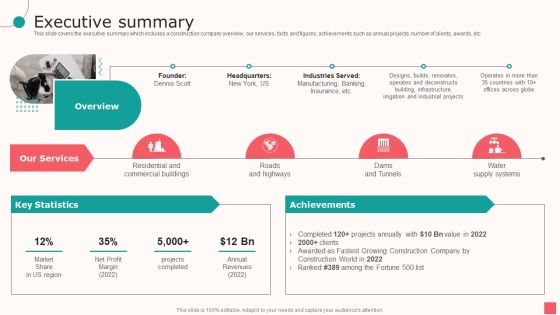
Real Estate Company Details Executive Summary Ppt PowerPoint Presentation Show Layouts PDF
This slide covers the executive summary which includes a construction company overview, our services, facts and figures, achievements such as annual projects, number of clients, awards, etc.Presenting Real Estate Company Details Executive Summary Ppt PowerPoint Presentation Show Layouts PDF to provide visual cues and insights. Share and navigate important information on one stage that need your due attention. This template can be used to pitch topics like Commercial Buildings, Projects Completed, Annual Revenues. In addtion, this PPT design contains high resolution images, graphics, etc, that are easily editable and available for immediate download.
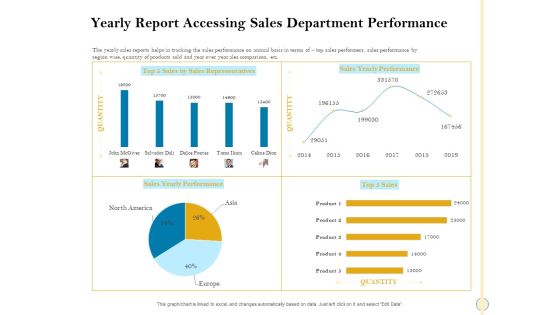
Sales Optimization Best Practices To Close More Deals Yearly Report Accessing Sales Department Performance Download PDF
The yearly sales reports helps in tracking the sales performance on annual basis in terms of top sales performers, sales performance by region wise, quantity of products sold and year over year ales comparison, etc. Deliver an awe inspiring pitch with this creative sales optimization best practices to close more deals yearly report accessing sales department performance download pdf bundle. Topics like yearly report accessing sales department performance can be discussed with this completely editable template. It is available for immediate download depending on the needs and requirements of the user.

Convenience Food Business Plan Burger Industry Overview Ppt Icon Templates PDF
The purpose of this slide is to provide glimpse about burger industrys current scenario and how this industry is performing in current times. Deliver an awe-inspiring pitch with this creative convenience food business plan burger industry overview ppt icon templates pdf bundle. Topics like burger restaurant market size, burger restaurants industry, consumer goods and services sector, number businesses, industry employment, annualized market, growth burger restaurant can be discussed with this completely editable template. It is available for immediate download depending on the needs and requirements of the user.

Accelerating COVID 19 Recovery In Maritime Sector A Shock For The Maritime Sector Brochure PDF
This template covers PMI and export growth of the shipping sector as Coronavirus The demand dropped and remained much longer at lower levels than in the usual year.Deliver an awe inspiring pitch with this creative accelerating COVID 19 recovery in maritime sector a shock for the maritime sector brochure pdf. bundle. Topics like annual persent change, the shipping sector is navigating uncharted waters, 2005 to 2020 can be discussed with this completely editable template. It is available for immediate download depending on the needs and requirements of the user.

Marketing Technology Stack Expected Conversion Rate Designs PDF
In this slide we have provided you with a comparative graph that shows the conversion rate over a span of 2 years along with key activities that the organization is doing in order to increase their conversion rate.Deliver and pitch your topic in the best possible manner with this marketing technology stack expected conversion rate designs pdf. Use them to share invaluable insights on annual membership, discount on first 5 purchases, conversion strategies and impress your audience. This template can be altered and modified as per your expectations. So, grab it now.

Sales Assistance Boost Overall Efficiency Yearly Report Accessing Sales Department Performance Rules PDF
The yearly sales reports helps in tracking the sales performance on annual basis in terms of top sales performers, sales performance by region wise, quantity of products sold and year over year ales comparison, etc. Deliver an awe-inspiring pitch with this creative sales assistance boost overall efficiency yearly report accessing sales department performance rules pdf bundle. Topics like yearly report accessing sales department performance can be discussed with this completely editable template. It is available for immediate download depending on the needs and requirements of the user.

Customer Satisfaction Level In IBN Outsourcing Company For 5 Years Ppt Show Ideas PDF
This slide shows a Customer Attrition Rate Dashboard with KPIs such as Company Revenue , Customer Attrition Rate in 2021 , Annual Growth Rate , Average Customer Queue Time , Onboarding Process Effectiveness etc.Deliver and pitch your topic in the best possible manner with this customer satisfaction level in ibn outsourcing company for 5 years ppt show ideas pdf. Use them to share invaluable insights on customer satisfaction level, 2017 to 2021 and impress your audience. This template can be altered and modified as per your expectations. So, grab it now.

Customer Attrition Rate Dashboard For Ibn Outsourcing Company Information PDF
This slide shows a Customer Attrition Rate Dashboard with KPIs such as Company Revenue , Customer Attrition Rate in 2021 , Annual Growth Rate , Average Customer Queue Time , Onboarding Process Effectiveness etc. Deliver and pitch your topic in the best possible manner with this customer attrition rate dashboard for ibn outsourcing company information pdf. Use them to share invaluable insights on customer attrition rate dashboard for ibn outsourcing company and impress your audience. This template can be altered and modified as per your expectations. So, grab it now.

International Organization Standardization 270001 Total Risk Events Encountered And Loss Amount Involved Demonstration PDF
Mentioned slide portrays year over year stats of number of risk events occurred within the firm. It also includes the total amount of loss caused from risk events annually. Deliver an awe inspiring pitch with this creative international organization standardization 270001 total risk events encountered and loss amount involved demonstration pdf bundle. Topics like total risk events encountered and loss amount involved can be discussed with this completely editable template. It is available for immediate download depending on the needs and requirements of the user.

Growth Of Ethical Hacking Profession Ppt Infographic Template Templates PDF
This slide represents the growth of the ethical hacking profession, including annual salary, hiring companies, and designation such as information security officer, computer forensics engineer, ethical hacker, and network security engineer. Deliver and pitch your topic in the best possible manner with this growth of ethical hacking profession ppt infographic template templates pdf. Use them to share invaluable insights on growth of ethical hacking profession and impress your audience. This template can be altered and modified as per your expectations. So, grab it now.

Post Merger Information Technology Service Delivery Amalgamation Financial Impact Of IT Service Elements PDF
This slide illustrates the informational stats about the financial impact of integrating IT services post merger. It also concludes that company X will save dollar 350k annually. Deliver and pitch your topic in the best possible manner with this post merger information technology service delivery amalgamation financial impact of it service elements pdf . Use them to share invaluable insights on financial impact of it service integration post merger and impress your audience. This template can be altered and modified as per your expectations. So, grab it now.
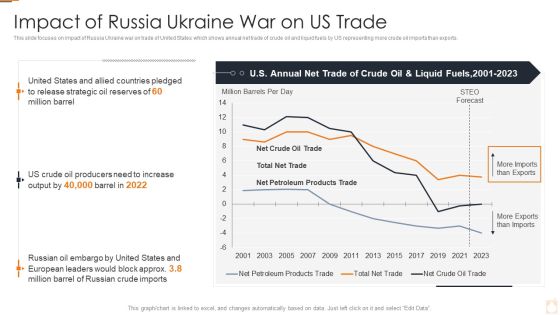
Ukraine Russia Conflict Effect On Petroleum Industry Impact Of Russia Ukraine War On Us Trade Elements PDF
This slide focuses on impact of Russia Ukraine war on trade of United States which shows annual net trade of crude oil and liquid fuels by US representing more crude oil imports than exports.Deliver and pitch your topic in the best possible manner with this Ukraine Russia Conflict Effect On Petroleum Industry Impact Of Russia Ukraine War On Us Trade Elements PDF Use them to share invaluable insights on Impact Of Russia Ukraine War On US Trade and impress your audience. This template can be altered and modified as per your expectations. So, grab it now.

On The Go Food Packing Market Industry Analysis Designs PDF
This slide covers statistical data of growing on the go food packaging market. It includes financial details such as compound annual growth rate, global addressable market value, North American market value, and market value by packaging segments.Showcasing this set of slides titled On The Go Food Packing Market Industry Analysis Designs PDF. The topics addressed in these templates are On The Go Food Packing Market Industry Analysis. All the content presented in this PPT design is completely editable. Download it and make adjustments in color, background, font etc. as per your unique business setting.
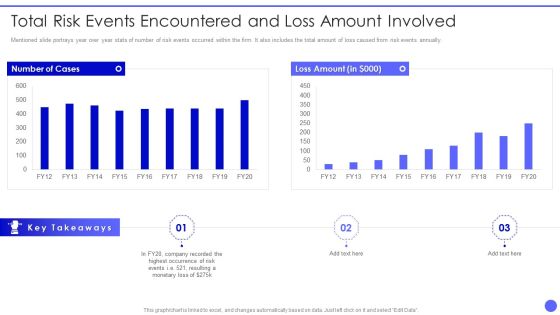
Info Safety And ISO 27001 Total Risk Events Encountered And Loss Amount Involved Clipart PDF
Mentioned slide portrays year over year stats of number of risk events occurred within the firm. It also includes the total amount of loss caused from risk events annually. Deliver and pitch your topic in the best possible manner with this Info Safety And ISO 27001 Total Risk Events Encountered And Loss Amount Involved Clipart PDF. Use them to share invaluable insights on Number Cases, Loss Amount, Highest Occurrence, Risk Events and impress your audience. This template can be altered and modified as per your expectations. So, grab it now.
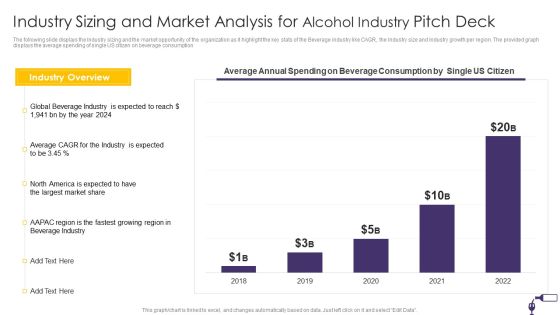
Industry Sizing And Market Analysis For Alcohol Industry Pitch Deck Formats PDF
The following slide displays the Industry sizing and the market opportunity of the organization as it highlight the key stats of the Beverage industry like CAGR, the Industry size and Industry growth per region. The provided graph displays the average spending of single US citizen on beverage consumption. Deliver and pitch your topic in the best possible manner with this Industry Sizing And Market Analysis For Alcohol Industry Pitch Deck Formats PDF. Use them to share invaluable insights on Industry Overview, Average Annual Spending, Beverage Consumption, 2018 To 2022 and impress your audience. This template can be altered and modified as per your expectations. So, grab it now.
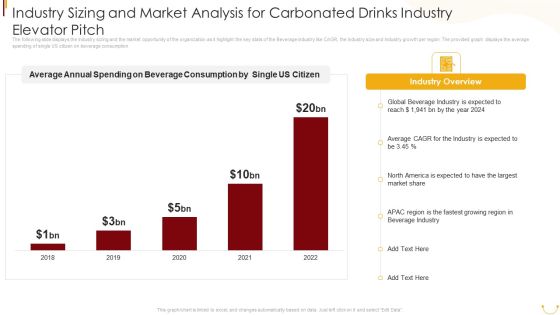
Industry Sizing And Market Analysis For Carbonated Drinks Industry Elevator Pitch Diagrams PDF
The following slide displays the Industry sizing and the market opportunity of the organization as it highlight the key stats of the Beverage industry like CAGR, the Industry size and Industry growth per region. The provided graph displays the average spending of single US citizen on beverage consumption. Deliver and pitch your topic in the best possible manner with this Industry Sizing And Market Analysis For Carbonated Drinks Industry Elevator Pitch Diagrams PDF. Use them to share invaluable insights on Average Annual Spending, Beverage Consumption, Single US Citizen, Global Beverage Industry, 2018 To 2022 and impress your audience. This template can be altered and modified as per your expectations. So, grab it now.
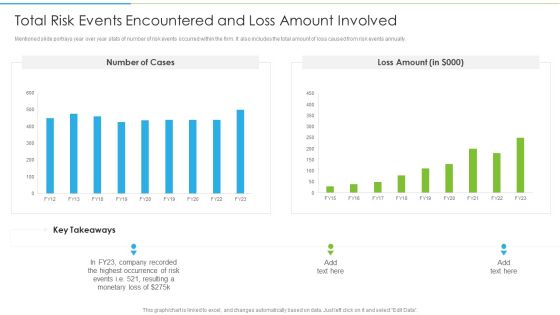
Ways To Accomplish ISO 27001 Accreditation Total Risk Events Encountered And Loss Amount Involved Download PDF
Mentioned slide portrays year over year stats of number of risk events occurred within the firm. It also includes the total amount of loss caused from risk events annually. Deliver an awe inspiring pitch with this creative Ways To Accomplish ISO 27001 Accreditation Total Risk Events Encountered And Loss Amount Involved Download PDF bundle. Topics like Number Cases, Loss Amount, Highest Occurrence can be discussed with this completely editable template. It is available for immediate download depending on the needs and requirements of the user.

Industry Sizing And Market Analysis For Aerated Drinks Industry Elevator Pitch Deck Information PDF
The following slide displays the Industry sizing and the market opportunity of the organization as it highlight the key stats of the Beverage industry like CAGR, the Industry size and Industry growth per region. The provided graph displays the average spending of single US citizen on beverage consumption.Deliver an awe inspiring pitch with this creative Industry Sizing And Market Analysis For Aerated Drinks Industry Elevator Pitch Deck Information PDF bundle. Topics like Average Annual, Spending Beverage, Consumption Citizen can be discussed with this completely editable template. It is available for immediate download depending on the needs and requirements of the user.
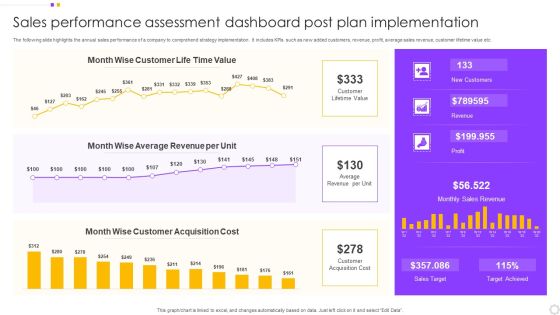
Sales Performance Assessment Dashboard Post Plan Implementation Introduction PDF
The following slide highlights the annual sales performance of a company to comprehend strategy implementation. It includes KPIs such as new added customers, revenue, profit, average sales revenue, customer lifetime value etc. Pitch your topic with ease and precision using this Sales Performance Assessment Dashboard Post Plan Implementation Introduction PDF. This layout presents information on Customer, Value, Average Revenue. It is also available for immediate download and adjustment. So, changes can be made in the color, design, graphics or any other component to create a unique layout.
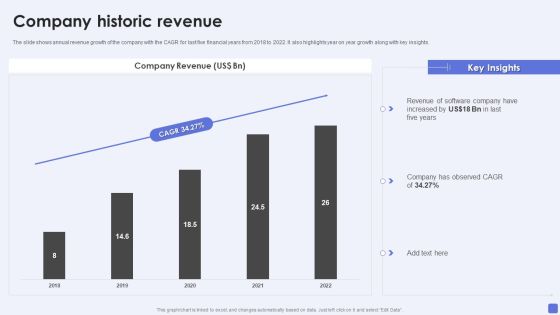
Software Services Business Profile Company Historic Revenue Ppt PowerPoint Presentation Gallery Graphics Download PDF
The slide shows annual revenue growth of the company with the CAGR for last five financial years from 2018 to 2022. It also highlights year on year growth along with key insights. Deliver and pitch your topic in the best possible manner with this Software Services Business Profile Company Historic Revenue Ppt PowerPoint Presentation Gallery Graphics Download PDF. Use them to share invaluable insights on Company Revenue, Observed CAGR, 2018 To 2022 and impress your audience. This template can be altered and modified as per your expectations. So, grab it now.
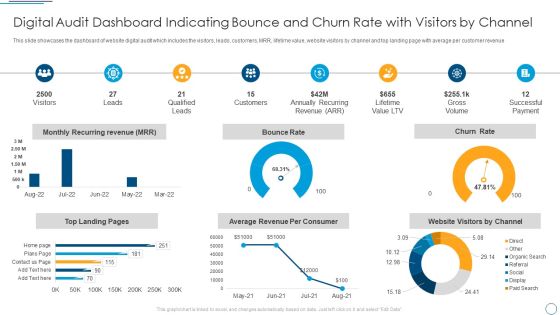
Digital Audit Dashboard Indicating Bounce And Churn Rate With Visitors By Channel Demonstration PDF
This slide showcases the dashboard of website digital audit which includes the visitors, leads, customers, MRR, lifetime value, website visitors by channel and top landing page with average per customer revenue.Deliver and pitch your topic in the best possible manner with this Digital Audit Dashboard Indicating Bounce And Churn Rate With Visitors By Channel Demonstration PDF. Use them to share invaluable insights on Qualified Leads, Annually Recurring, Successful Payment and impress your audience. This template can be altered and modified as per your expectations. So, grab it now.

Key HR Service Delivery Statistics On A Global Scal Portrait PDF
This slide shows the some of the key HR Service Delivery Statistics on a Global Scale such as percentage of companies that are that are expected to perform better due to ethnic diversity, percentage of employees whose loyalty will increase to additional paid time, increase in annual growth rate due to more employee engagement programs etc. Deliver and pitch your topic in the best possible manner with this Key HR Service Delivery Statistics On A Global Scal Portrait PDF. Use them to share invaluable insights on Produce Better, Employee Engagement, Employee Termination and impress your audience. This template can be altered and modified as per your expectations. So, grab it now.
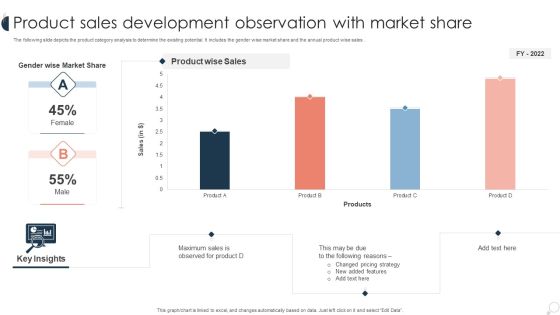
Product Sales Development Observation With Market Share Ppt PowerPoint Presentation Infographic Template Guide PDF
The following slide depicts the product category analysis to determine the existing potential. It includes the gender wise market share and the annual product wise sales . Pitch your topic with ease and precision using this Product Sales Development Observation With Market Share Ppt PowerPoint Presentation Infographic Template Guide PDF. This layout presents information on Changed Pricing, Observed For Product, Product Wise. It is also available for immediate download and adjustment. So, changes can be made in the color, design, graphics or any other component to create a unique layout.
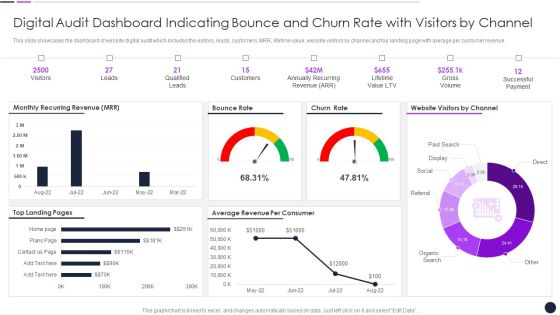
Digital Audit Dashboard Indicating Bounce And Churn Rate With Visitors By Channel Inspiration PDF
This slide showcases the dashboard of website digital audit which includes the visitors, leads, customers, MRR, lifetime value, website visitors by channel and top landing page with average per customer revenue.Deliver and pitch your topic in the best possible manner with this Digital Audit Dashboard Indicating Bounce And Churn Rate With Visitors By Channel Inspiration PDF. Use them to share invaluable insights on Qualified Leads, Annually Recurring, Lifetime Value and impress your audience. This template can be altered and modified as per your expectations. So, grab it now.

Compensation Survey Sheet Industry Payroll Trends Summary PDF
This slide represents key statistics of employees working in US region. It shows average salary based on employee experience, education, and average bonus rate should be receive to full time employees. This slide also helps in making comparison with company compensation structure. Deliver and pitch your topic in the best possible manner with this Compensation Survey Sheet Industry Payroll Trends Summary PDF. Use them to share invaluable insights on Average Bonus Rate, Top Management, Average Annual Salary and impress your audience. This template can be altered and modified as per your expectations. So, grab it now.
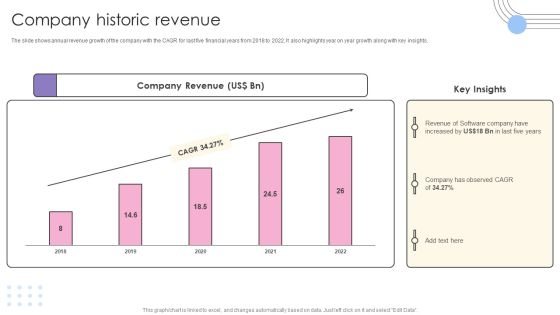
Software Products And Solutions Firm Details Company Historic Revenue Portrait PDF
The slide shows annual revenue growth of the company with the CAGR for last five financial years from 2018 to 2022. It also highlights year on year growth along with key insights. Deliver and pitch your topic in the best possible manner with this Software Products And Solutions Firm Details Company Historic Revenue Portrait PDF. Use them to share invaluable insights on Company Revenue, Observed CAGR, 2018 To 2022 and impress your audience. This template can be altered and modified as per your expectations. So, grab it now.
ISO 27001 Organizational Qualifying Procedure Total Risk Events Encountered And Loss Amount Involved Icons PDF
Mentioned slide portrays year over year stats of number of risk events occurred within the firm. It also includes the total amount of loss caused from risk events annually.Deliver and pitch your topic in the best possible manner with this ISO 27001 Organizational Qualifying Procedure Total Risk Events Encountered And Loss Amount Involved Icons PDF. Use them to share invaluable insights on Highest Occurrence, Company Recorded, Resulting A Monetary and impress your audience. This template can be altered and modified as per your expectations. So, grab it now.

Education Dashboard With Fees Collection And Expense Metrics Demonstration PDF
This slide covers education key performance indicators tracking dashboard. It also include metrics such as total students, teachers, parents, total earrings, social media followers, event calendar, fees collection, and expenses. Showcasing this set of slides titled Education Dashboard With Fees Collection And Expense Metrics Demonstration PDF. The topics addressed in these templates are Event Calender, Annual Holidays, Fees Collection, Expenses. All the content presented in this PPT design is completely editable. Download it and make adjustments in color, background, font etc. as per your unique business setting.

Business Software Development Company Profile Company Historic Revenue Graphics PDF
The slide shows annual revenue growth of the company with the CAGR for last five financial years from 2018 to 2022. It also highlights year on year growth along with key insights. Deliver and pitch your topic in the best possible manner with this Business Software Development Company Profile Company Historic Revenue Graphics PDF. Use them to share invaluable insights on Company Revenue, Observed CAGR, 2018 To 2022 and impress your audience. This template can be altered and modified as per your expectations. So, grab it now.
Infotech Solutions Research And Development Company Summary Company Revenue Icons PDF
The slide shows annual revenue growth of the company with the CAGR for last five financial years from 2018 to 2022. It also highlights year on year growth along with key insights. Deliver and pitch your topic in the best possible manner with this Infotech Solutions Research And Development Company Summary Company Revenue Icons PDF. Use them to share invaluable insights on Business Uncertainties, Growth, Company Revenue and impress your audience. This template can be altered and modified as per your expectations. So, grab it now.

Six Sigma Methodologies For Process Optimization Low Productivity Faced By The Business Sample PDF
This slide demonstrates the issue of low productivity faced by the business, which has been declining since 2018 continuously and has been less than 1 percentage each year. Showcasing this set of slides titled Six Sigma Methodologies For Process Optimization Low Productivity Faced By The Business Sample PDF. The topics addressed in these templates are Annual Productivity Growth, Low Productivity Faced. All the content presented in this PPT design is completely editable. Download it and make adjustments in color, background, font etc. as per your unique business setting.
IT Application Services Company Outline Company Revenue Icons PDF
The slide shows annual revenue growth of the company with the CAGR for last five financial years from 2018 to 2022. It also highlights year on year growth along with key insights. Deliver and pitch your topic in the best possible manner with this IT Application Services Company Outline Company Revenue Icons PDF. Use them to share invaluable insights on Gross Profit Margin, Revenue, Business and impress your audience. This template can be altered and modified as per your expectations. So, grab it now.
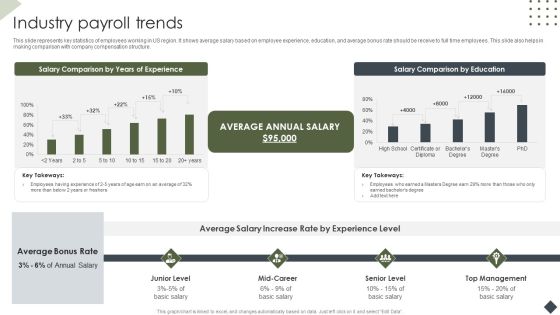
Income Assessment Document Industry Payroll Trends Ppt Pictures Deck PDF
This slide represents key statistics of employees working in US region. It shows average salary based on employee experience, education, and average bonus rate should be receive to full time employees. This slide also helps in making comparison with company compensation structure. Deliver and pitch your topic in the best possible manner with this Income Assessment Document Industry Payroll Trends Ppt Pictures Deck PDF. Use them to share invaluable insights on Salary Comparison, Years Experience, Average Annual Salary and impress your audience. This template can be altered and modified as per your expectations. So, grab it now.
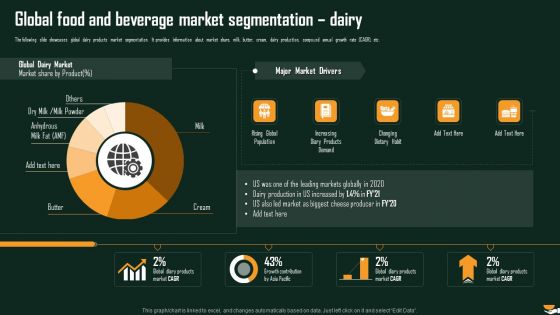
Global Food And Beverage Market Segmentation Dairy International Food And Beverages Sector Analysis Demonstration PDF
The following slide showcases global dairy products market segmentation. It provides information about market share, milk, butter, cream, dairy production, compound annual growth rate CAGR, etc. Deliver and pitch your topic in the best possible manner with this Global Food And Beverage Market Segmentation Dairy International Food And Beverages Sector Analysis Demonstration PDF. Use them to share invaluable insights on Rising Global, Increasing Diary, Changing Dietary and impress your audience. This template can be altered and modified as per your expectations. So, grab it now.
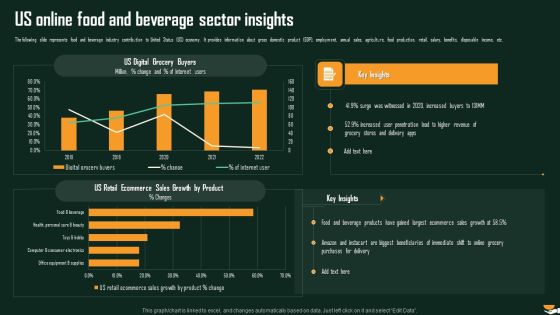
Us Online Food And Beverage Sector Insights International Food And Beverages Sector Analysis Template PDF
The following slide represents food and beverage industry contribution to United Status US economy. It provides information about gross domestic product GDP, employment, annual sales, agriculture, food production, retail, salary, benefits, disposable income, etc. Deliver and pitch your topic in the best possible manner with this Us Online Food And Beverage Sector Insights International Food And Beverages Sector Analysis Template PDF. Use them to share invaluable insights on Digital Grocery, Increased Penetration, Retail Ecommerce and impress your audience. This template can be altered and modified as per your expectations. So, grab it now.

Landing Page Leads And Revenue Generation Analytics For User Experience Optimization Dashboard Formats PDF
This slide covers website analytics based on revenue earned. It also included leads generated, bounce rates, customer churn stats, annual and monthly recurring revenue, etc. Pitch your topic with ease and precision using this Landing Page Leads And Revenue Generation Analytics For User Experience Optimization Dashboard Formats PDF. This layout presents information on Monthly Recurring Revenue, Bounce Rate, Gross Volume. It is also available for immediate download and adjustment. So, changes can be made in the color, design, graphics or any other component to create a unique layout.

Yearly Sales Assessment Dashboard With Total Revenue Introduction PDF
This slide represent annual sales review dashboard of various products sold by an organization through various selling platform with comparison and product wise revenue generated .It includes product, unit sold and total revenue. Showcasing this set of slides titled Yearly Sales Assessment Dashboard With Total Revenue Introduction PDF. The topics addressed in these templates are Product Sold, Inventory Outstanding, Average. All the content presented in this PPT design is completely editable. Download it and make adjustments in color, background, font etc. as per your unique business setting.

Yearly Sales Assessment Of Products With Bar Graph Structure PDF
This slide represent graphical presentation of annual sales review of various products sold by an organization within 5 years showing difference in revenue generated .It shows report of following years 2018,2019,2020,and 2021. Showcasing this set of slides titled Yearly Sales Assessment Of Products With Bar Graph Structure PDF. The topics addressed in these templates are Product, Sales Of Product, Product Demand. All the content presented in this PPT design is completely editable. Download it and make adjustments in color, background, font etc. as per your unique business setting.

Competitive Sales Analysis Of SBU Management Ppt PowerPoint Presentation Icon Maker PDF
The following slide presents competitive view of annual sales of different SBUs to assess their performance and suitably take strategic decisions. It also includes key insight for reference.Showcasing this set of slides titled Competitive Sales Analysis Of SBU Management Ppt PowerPoint Presentation Icon Maker PDF. The topics addressed in these templates are Generate Maximum, Decrease Sales, Key Insights. All the content presented in this PPT design is completely editable. Download it and make adjustments in color, background, font etc. as per your unique business setting.

Financial Highlights For Construction Company Yearly Report Template PDF
This slide showcases report for construction company annual financial highlights that can help in analyzing the financial health of organization and help investors to make informed decisions. It outlines information about turnover, profit before tax, profit after, equity capital and reserves. Pitch your topic with ease and precision using this Financial Highlights For Construction Company Yearly Report Template PDF. This layout presents information on Reserve And Surplus, Profit, Turnover. It is also available for immediate download and adjustment. So, changes can be made in the color, design, graphics or any other component to create a unique layout.
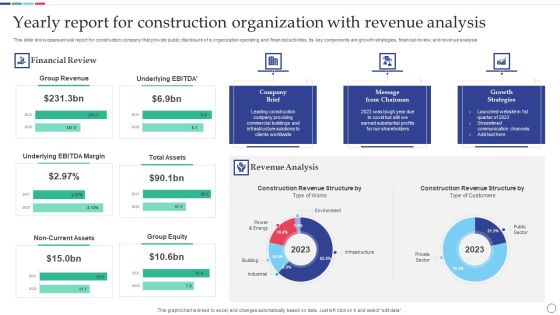
Yearly Report For Construction Organization With Revenue Analysis Topics PDF
This slide showcases annual report for construction company that provide public disclosure of a organization operating and financial activities. Its key components are growth strategies, financial review, and revenue analysis. Showcasing this set of slides titled Yearly Report For Construction Organization With Revenue Analysis Topics PDF. The topics addressed in these templates are Revenue Analysis, Growth Strategies, Customers. All the content presented in this PPT design is completely editable. Download it and make adjustments in color, background, font etc. as per your unique business setting.
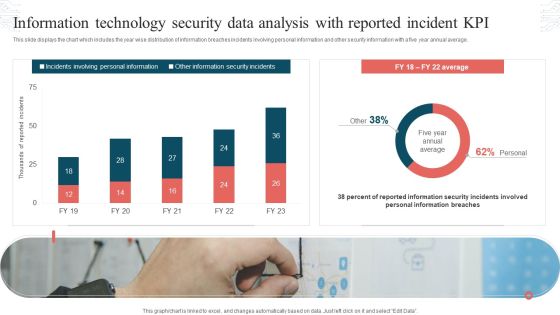
Information Technology Security Data Analysis With Reported Incident KPI Download PDF
This slide displays the chart which includes the year wise distribution of information breaches incidents involving personal information and other security information with a five year annual average. Showcasing this set of slides titled Information Technology Security Data Analysis With Reported Incident KPI Download PDF. The topics addressed in these templates are Incidents Involving, Personal Information, Other Information, Security Incidents. All the content presented in this PPT design is completely editable. Download it and make adjustments in color, background, font etc. as per your unique business setting.

Implementing Succession Planning Dashboard To Measure Employee Turnover Rate Mockup PDF
This slide shows a dashboard that can be used by a firm to measure its employee turnover rate at different locations. It also portraits details about annual fluctuation rate along with number of leavers. There are so many reasons you need a Implementing Succession Planning Dashboard To Measure Employee Turnover Rate Mockup PDF. The first reason is you cant spend time making everything from scratch, Thus, Slidegeeks has made presentation templates for you too. You can easily download these templates from our website easily.
You Tube Advertising Campaign Performance Analytics Dashboard Ppt Icon Diagrams PDF
This slide represents dashboard showing analytics of performance of you tube marketing campaign. It includes data related to no. of visitors, qualified leads, customers and annual recurring revenue, lifetime value, gross volume etc generated through the campaign. Showcasing this set of slides titled You Tube Advertising Campaign Performance Analytics Dashboard Ppt Icon Diagrams PDF. The topics addressed in these templates are Monthly Recurring Revenue, Bounce Rate, Customer Churn Rate. All the content presented in this PPT design is completely editable. Download it and make adjustments in color, background, font etc. as per your unique business setting.
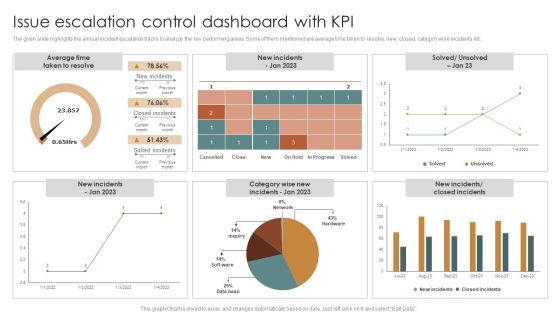
Issue Escalation Control Dashboard With KPI Clipart PDF
The given slide highlights the annual incident escalation tracks to analyze the key performing areas. Some of them mentioned are average time taken to resolve, new, closed, category wise incidents etc. Showcasing this set of slides titled Issue Escalation Control Dashboard With KPI Clipart PDF. The topics addressed in these templates are Average Time, Taken To Resolve. All the content presented in this PPT design is completely editable. Download it and make adjustments in color, background, font etc. as per your unique business setting.

IT Firm Financial Statement Company Revenue Demonstration PDF
The slide shows annual revenue growth of the company with the CAGR for last five financial years from 2019 to 2023. It also highlights year on year growth along with key insights. Find a pre designed and impeccable IT Firm Financial Statement Company Revenue Demonstration PDF. The templates can ace your presentation without additional effort. You can download these easy to edit presentation templates to make your presentation stand out from others. So, what are you waiting for Download the template from Slidegeeks today and give a unique touch to your presentation.

Small Company And Entrepreneurs Failture Rate Summary PDF
This slide exhibits yearly statistics indicating fail rates of business commenced after 2018. It contains percentage of business fail, yearly comparison rate of failure and average annual rate of business failure. Pitch your topic with ease and precision using this Small Company And Entrepreneurs Failture Rate Summary PDF. This layout presents information on Entrepreneurs Failture Rate, Business. It is also available for immediate download and adjustment. So, changes can be made in the color, design, graphics or any other component to create a unique layout.
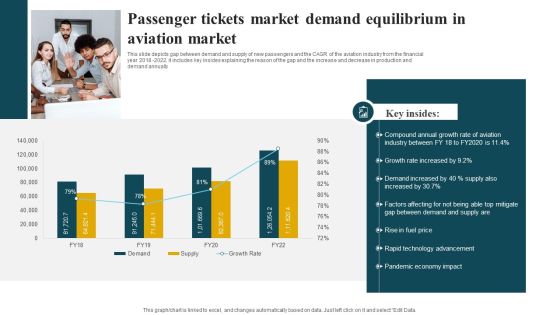
Passenger Tickets Market Demand Equilibrium In Aviation Market Guidelines PDF
This slide depicts gap between demand and supply of new passengers and the CAGR of the aviation industry from the financial year 2018 2022. it includes key insides explaining the reason of the gap and the increase and decrease in production and demand annually. Showcasing this set of slides titled Passenger Tickets Market Demand Equilibrium In Aviation Market Guidelines PDF. The topics addressed in these templates are Growth Rate, Industry, Demand. All the content presented in this PPT design is completely editable. Download it and make adjustments in color, background, font etc. as per your unique business setting.
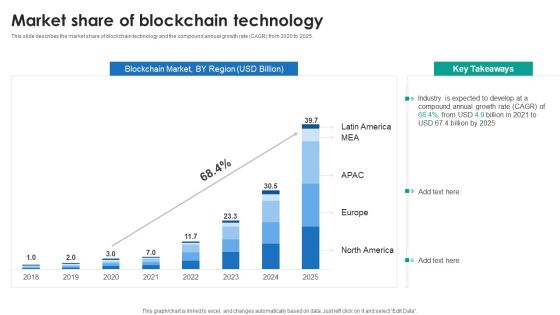
P2P Ledger Market Share Of Blockchain Technology Rules PDF
This slide describes the market share of blockchain technology and the compound annual growth rate CAGR from 2020 to 2025.Explore a selection of the finest P2P Ledger Market Share Of Blockchain Technology Rules PDF here. With a plethora of professionally designed and pre-made slide templates, you can quickly and easily find the right one for your upcoming presentation. You can use our P2P Ledger Market Share Of Blockchain Technology Rules PDF to effectively convey your message to a wider audience. Slidegeeks has done a lot of research before preparing these presentation templates. The content can be personalized and the slides are highly editable. Grab templates today from Slidegeeks.

Data Quality Kpis Metrics Score For Reports Monitoring Download PDF
This slide covers overall scores to analyse the quality of data provided by company. It includes annual reports data quality scores based on different metrics such as completeness, timeliness, validity, accuracy, consistency and uniqueness. Showcasing this set of slides titled Data Quality Kpis Metrics Score For Reports Monitoring Download PDF. The topics addressed in these templates are Total Rows Processed, Failed Rows. All the content presented in this PPT design is completely editable. Download it and make adjustments in color, background, font etc. as per your unique business setting.

Product Engineering Services Engineering Company Employee Output And Employment Mockup PDF
The slide highlights the annual employment and output per worker for an engineering company. It shows increased trend for output per worker. Create an editable Product Engineering Services Engineering Company Employee Output And Employment Mockup PDF that communicates your idea and engages your audience. Whether youre presenting a business or an educational presentation, pre-designed presentation templates help save time. Product Engineering Services Engineering Company Employee Output And Employment Mockup PDF is highly customizable and very easy to edit, covering many different styles from creative to business presentations. Slidegeeks has creative team members who have crafted amazing templates. So, go and get them without any delay.

Dashboard For Tracking Sales Target Metrics Introduction PDF
This slide presents KPI dashboard for tracking Sales Target Metrics achievement monthly and region wise helpful in adjusting activities as per ongoing performance. It includes average weekly sales revenue, average sales target, annual sales growth, regional sales performance and average revenue per unit that should be regularly tracked. Showcasing this set of slides titled Dashboard For Tracking Sales Target Metrics Introduction PDF. The topics addressed in these templates are Average Revenue, Per Unit, Average Weekly, Sales Revenue. All the content presented in this PPT design is completely editable. Download it and make adjustments in color, background, font etc. as per your unique business setting.

Customer Journey Enhancement Playbook Customer Segmentation Based On Business Guidelines PDF
Mentioned slide shows information about the companys customer segmentation process. It shows that leads will be segmented in two phases based on business type, size, annual revenues etc. From laying roadmaps to briefing everything in detail, our templates are perfect for you. You can set the stage with your presentation slides. All you have to do is download these easy-to-edit and customizable templates. Customer Journey Enhancement Playbook Customer Segmentation Based On Business Guidelines PDF will help you deliver an outstanding performance that everyone would remember and praise you for. Do download this presentation today.
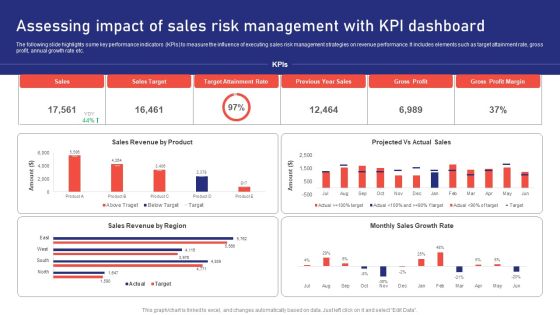
Sales Risk Assessment For Profit Maximization Assessing Impact Of Sales Risk Management With Kpi Dashboard Inspiration PDF
The following slide highlights some key performance indicators KPIs to measure the influence of executing sales risk management strategies on revenue performance. It includes elements such as target attainment rate, gross profit, annual growth rate etc. Find a pre designed and impeccable Sales Risk Assessment For Profit Maximization Assessing Impact Of Sales Risk Management With Kpi Dashboard Inspiration PDF. The templates can ace your presentation without additional effort. You can download these easy to edit presentation templates to make your presentation stand out from others. So, what are you waiting for Download the template from Slidegeeks today and give a unique touch to your presentation.
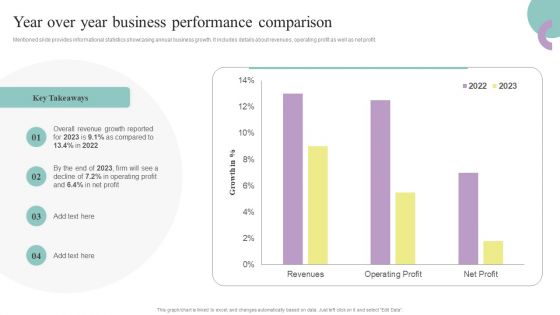
Comprehensive Guide To Enhance Year Over Year Business Performance Comparison Professional PDF
Mentioned slide provides informational statistics showcasing annual business growth. It includes details about revenues, operating profit as well as net profit. From laying roadmaps to briefing everything in detail, our templates are perfect for you. You can set the stage with your presentation slides. All you have to do is download these easy-to-edit and customizable templates. Comprehensive Guide To Enhance Year Over Year Business Performance Comparison Professional PDF will help you deliver an outstanding performance that everyone would remember and praise you for. Do download this presentation today.
