AI PPT Maker
Templates
PPT Bundles
Design Services
Business PPTs
Business Plan
Management
Strategy
Introduction PPT
Roadmap
Self Introduction
Timelines
Process
Marketing
Agenda
Technology
Medical
Startup Business Plan
Cyber Security
Dashboards
SWOT
Proposals
Education
Pitch Deck
Digital Marketing
KPIs
Project Management
Product Management
Artificial Intelligence
Target Market
Communication
Supply Chain
Google Slides
Research Services
 One Pagers
All Categories
-
Home
- Customer Favorites
- Quantitative Risk Analysis
Quantitative Risk Analysis
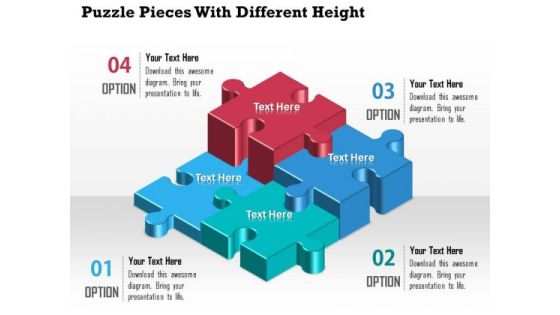
Business Diagram Puzzle Pieces With Different Height Presentation Template
A professional bar graph has been crafted with graphic of puzzles. All these puzzles are in different heights which shows the various levels of any data result representations. Use this diagram for your business result and data analysis related topics.
Six Staged Infographics Square With Business Icons Powerpoint Templates
This business diagram displays circular puzzle infographic. This editable slide is suitable to present global communication. Use this diagram for business and finance related topics and display complete data analysis in your presentation.

Business Plan Marketing Plan Example Of Ppt Presentation
This is a business plan marketing plan example of ppt presentation. This is a four stage process. The stages in this process are business analysis success, business plan, marketing plan, loan financial.

Business Diagram Pie Chart Octagon Shape Presentation Template
This business plan power point template has been designed with pie chart in octagon shape. This PPT contains the concept of result analysis for any business process. Use this PPT for business and sales related presentations.

Business Diagram Paper Clips Circular Chart Presentation Template
This power point template has been designed with graphic of circular chart made with paper clips. These business icons are used to display the concept of business result analysis and meeting. Use this diagram for business and marketing presentations.
Five Circular Steps With Business Icons Powerpoint Templates
This business diagram has been designed with circular graphics with business icons. This slide suitable for business analysis and strategy presentation. Use this diagram to present your views in a wonderful manner.
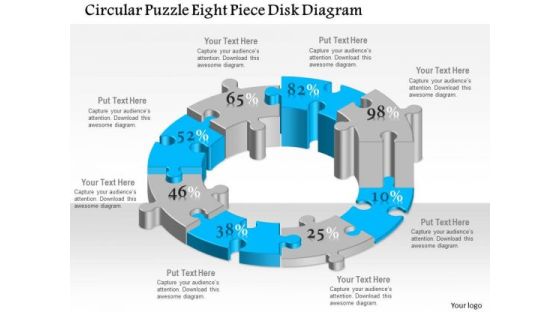
Business Diagram Circular Puzzle Eight Piece Disk Diagram Presentation Template
This business plan power point template has been designed with six staged circular puzzle diagram. This diagram template contains the concept of business process flow and result analysis representation. Use this diagram in your presentation and show these concepts.
Business Diagram Six Icons For Communication Presentation Template
Our above business diagram has been designed with six business icons. You may present market analysis using this diagram. Pressure cooks your views with this diagram. You will hear whistles of appreciation.
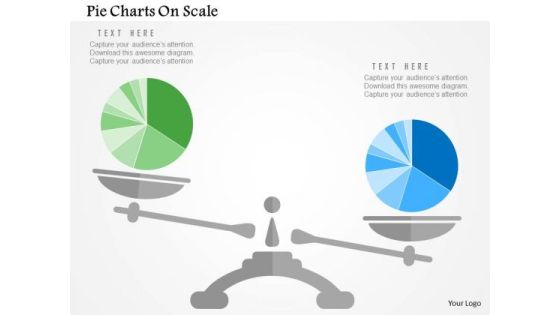
Business Diagram Pie Charts On Scale Presentation Template
Our above slide display graphics of pie chart on a scale. Download this diagram slide to display competitive analysis of business. Adjust the above diagram in your business presentations to visually support your content.
Business Man Post It Notes Magnifier Tie Ppt Slides Graphics
This PPT slide displays icons of business man, post it notes and magnifier. This PPT helps to depict search and analysis of business information. This icon slide is innovatively designed to highlight your worthy views

Circular Arrow Chart With Business Icons Powerpoint Slides
Graphics of circular arrow chart with icons have been displayed in this business slide. This business diagram helps to exhibit strategy analysis and management. Use this PowerPoint template to visually support your content.

Circular Arrows Design With Icons For Business Powerpoint Slides
Graphics of circular arrows design with icons have been displayed in this business slide. This business diagram helps to exhibit strategy analysis and management. Use this PowerPoint template to visually support your content.

Business Diagram Eight Staged Circular Puzzle Bar Graph Presentation Template
This Power Point template has been crafted with graphic of eight staged circular puzzle and bar graph. This PPT contains the financial result analysis related concept. Use this PPT for your business and success related presentations.

Timeline For Team Business Target Achievement Powerpoint Slides
This PowerPoint template contains circles around business team. It may be used to display analysis of team strategy. Download this PPT slide to demonstrate how you intend to navigate your steps towards the desired corporate goal.

Financial Business Marketing Ppt PowerPoint Presentation Layouts Infographic Template
This is a financial business marketing ppt powerpoint presentation layouts infographic template. This is a four finance, marketing, management, investment, analysis stage process. The stages in this process are.

Business Website Role In Branding Ppt Powerpoint Ideas
This is a business website role in branding ppt powerpoint ideas. This is a five stage process. The stages in this process are content development, marketing strategies, analysis and adjustment, track and measure, implementation, social media marketing.

Business Summary Report Icon Ppt Powerpoint Presentation Styles Model
This is a business summary report icon ppt powerpoint presentation styles model. This is a four stage process. The stages in this process are executive summary, analysis summary, review summary.
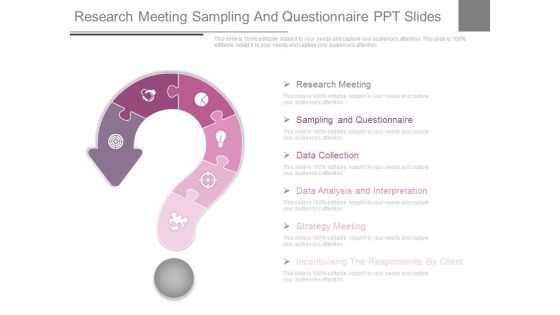
Research Meeting Sampling And Questionnaire Ppt Slides
This is a research meeting sampling and questionnaire ppt slides. This is a six stage process. The stages in this process are sampling and questionnaire, research meeting, data collection, data analysis and interpretation, strategy meeting, incentivising the respondents by client.

Business Diagram Six Pie Charts For Result Representation And Percentage Presentation Template
Display the concept of result analysis in your business presentation. This PPT slide contains the graphic of six pie charts. Use this PPT slide for your business and marketing data related presentations.

Stock Photo Black Brown Pie Chart For Business Result PowerPoint Slide
This high quality image is designed with pie chart. Use this image to make business reports. Use this outstanding image in presentations relating to data analysis and reports. Go ahead and add charm to your presentations.
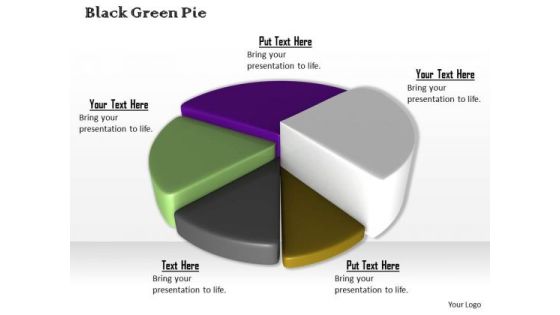
Stock Photo Colorful 3d Pie Chart For Business Result PowerPoint Slide
This high quality image is designed with pie chart. Use this image to make business reports. Use this outstanding image in presentations relating to data analysis and reports. Go ahead and add charm to your presentations.
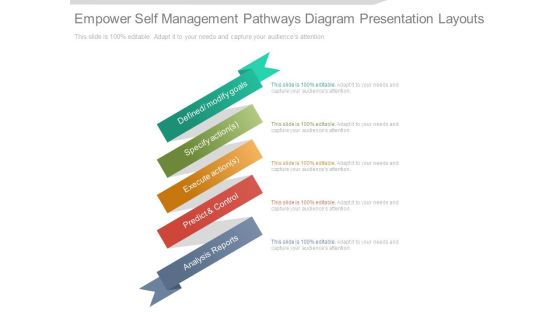
Empower Self Management Pathways Diagram Presentation Layouts
This is a Empower Self Management Pathways Diagram Presentation Layouts. This is a five stage process. The stages in this process are defined modify goals, specify action, execute action, predict and control, analysis reports.

Layout For Precentage Data Display PowerPoint Template
Growth analysis for business can be defined with this business diagram. This slide depicts text boxes in increasing flow. Present your views using this innovative slide and be assured of leaving a lasting impression
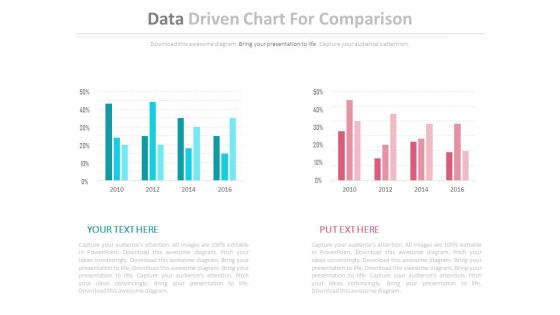
Two Data Driven Comparison Charts Powerpoint Slides
This PowerPoint template contains diagram of two data driven charts. You may use this PPT slide to depict strategic analysis for business. The color coding of this template is specifically designed to highlight you points.

Data Migration Steps Ppt PowerPoint Presentation Slides Inspiration
This is a data migration steps ppt powerpoint presentation slides inspiration. This is a three stage process. The stages in this process are analysis stage, development stage, go live support stage, marketing, technology.

Strategy Blog Example Diagram Ppt Samples
This is a strategy blog example diagram ppt samples. This is a five stage process. The stages in this process are website development process, analysis and marketing, technology, execution, creative, discovery.

Stock Photo Golden Dollar Symbol With Pie Graph PowerPoint Slide
This Power Point template has been crafted with graphic of golden dollar symbol and pie chart on a tablet. Display the concept of financial data analysis with this image. Use this image to present financial reports in business presentations.
Rocket With Three Staged Icons Powerpoint Template
Growth analysis for business can be defined with this business diagram. This slide depicts rocket with three staged icons. Present your views using this innovative slide and be assured of leaving a lasting impression

Advanced Analytic Capabilities Template Example Ppt Presentation
This is a advanced analytic capabilities template example ppt presentation. This is a seven stage process. The stages in this process are analysis and modeling, model management, enterprise use of analytics, data preparation, business analyst, business manager, executive management commitment

Kpi Engineering Process Cycle Diagram Ppt Sample
This is a kpi engineering process cycle diagram ppt sample. This is a six stage process. The stages in this process are program discovery, database optimization, program implementation, program delivery, program maintenance, analysis and reporting.

Lego Blocks Design For Data Representation Powerpoint Slides
This PowerPoint template has been designed with Lego blocks diagram. You can use this ppt slide for statistical analysis or for data representation. Download this PPT slide to build impressive presentations.

Four Tags For Strategy Planning Process Powerpoint Template
Steps for strategy planning can be explained with this diagram. This PowerPoint template contains diagram of four infographic tags. You can also use this design for data analysis in business presentations

Flower Diagram For Educational Training Powerpoint Template
Colorful flowers have been used to design this PowerPoint diagram. This colorful PPT slide may be used for educational training. You can use this design for data analysis in business presentations

Text Boxes With Percentage Values PowerPoint Template
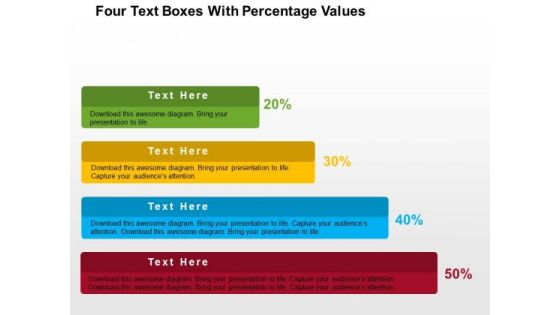
Growth analysis for business can be defined with this business diagram. This slide depicts text boxes in increasing flow. Present your views using this innovative slide and be assured of leaving a lasting impression
Four Text Boxes With Percentage Values PowerPoint Template
Growth analysis for business can be defined with this business diagram. This slide depicts text boxes in increasing flow. Present your views using this innovative slide and be assured of leaving a lasting impression
Three Arrows With Icons Powerpoint Templates
This business diagram displays graphic of three arrows with icons. This power point template contains the concept of business analysis and research. Use this diagram to build unique presentation for your viewers.

Three Options Text Arrow Boxes Powerpoint Templates
This business diagram displays graphic of arrows with icons. This power point template contains the concept of business analysis and research. Use this diagram to build unique presentation for your viewers.
Six Text Boxes With Icons Powerpoint Template
This business slide contains pie chart infographic layout. This diagram is suitable to present business deal and analysis This diagram provides schematic representation of any information and provides more clarity to the subject.
Web Based Crm Applications Ppt Powerpoint Ideas
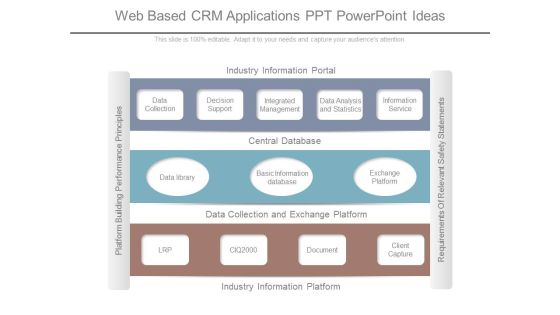
This is a web based crm applications ppt powerpoint ideas. This is a three stage process. The stages in this process are industry information portal, data collection, decision support, integrated management, data analysis and statistics, information service, central database.
Communications Strategy Benchmarking Powerpoint Slides
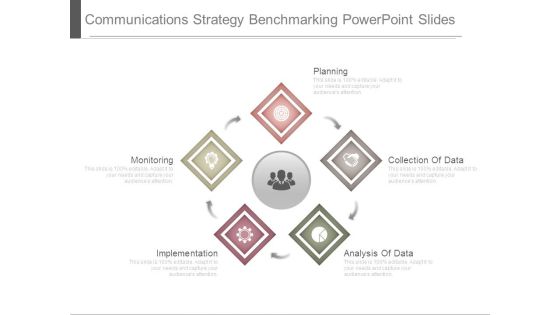
This is a communications strategy benchmarking powerpoint slides. This is a five stage process. The stages in this process are planning, collection of data, analysis of data, implementation, monitoring.
Sales Forecasting Templates Powerpoint Graphics
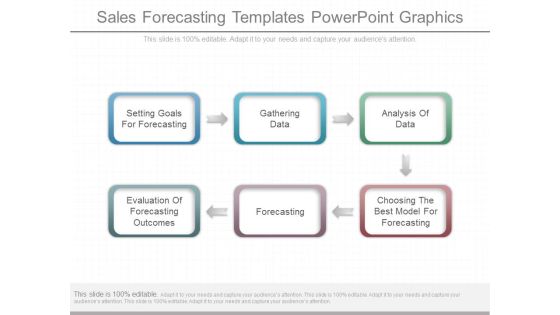
This is a sales forecasting templates powerpoint graphics. This is a six stage process. The stages in this process are setting goals for forecasting, gathering data, analysis of data, evaluation of forecasting outcomes, forecasting, choosing the best model for forecasting.
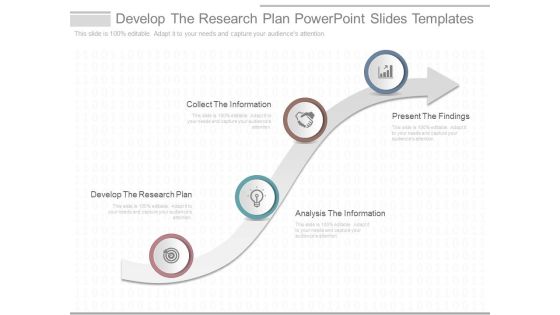
Develop The Research Plan Powerpoint Slides Templates
This is a develop the research plan powerpoint slides templates. This is a four stage process. The stages in this process are develop the research plan, collect the information, analysis the information, present the findings.
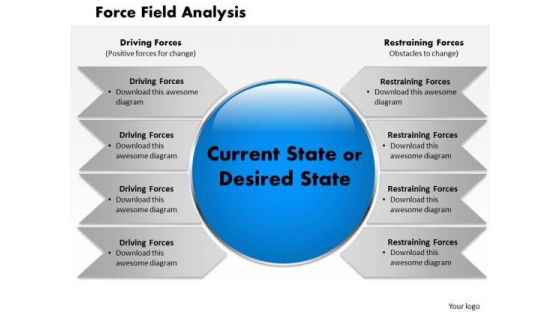
Force Field Anaysis PowerPoint Presentation Template
Good Camaraderie Is A Key To Teamwork. Our Force Field Analysis PowerPoint Presentation Template Powerpoint Templates Can Be A Cementing Force. Our Business Charts Powerpoint Templates Are An Agent Of Change. Let Your Thoughts Go Down Uncharted Courses.
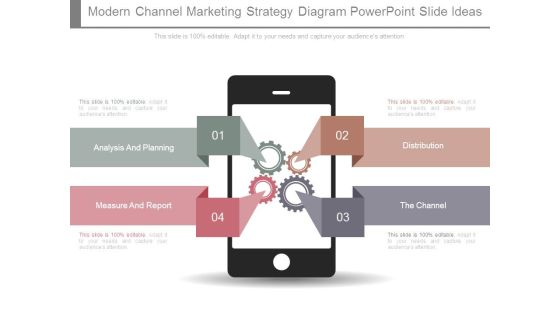
Modern Channel Marketing Strategy Diagram Powerpoint Slide Ideas
This is a modern channel marketing strategy diagram powerpoint slide ideas. This is a four stage process. The stages in this process are analysis and planning, measure and report, distribution, the channel.

Team With Bar Graph And Teamwork
This Power Point template has been designed with graphic of 3d team forming a pie chart. In this slide team is displaying data analysis and comparison. Use this editable slide to build innovative presentation for your viewers.
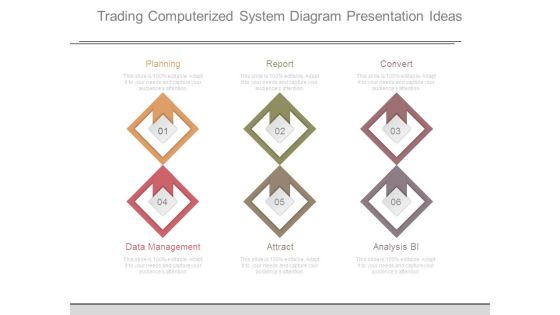
Trading Computerized System Diagram Presentation Ideas
This is a trading computerized system diagram presentation ideas. This is a six stage process. The stages in this process are planning, report, convert, data management, attract, analysis bi.
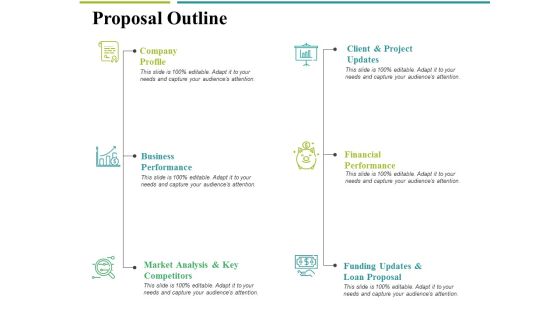
Proposal Outline Ppt PowerPoint Presentation Gallery Background Designs
This is a proposal outline ppt powerpoint presentation gallery background designs. This is a six stage process. The stages in this process are company profile, business performance, market analysis and key competitors, client and project updates, financial performance.

Employee Performance Summary Ppt PowerPoint Presentation Styles Slide
This is a employee performance summary ppt powerpoint presentation styles slide. This is a three stage process. The stages in this process are business, icons, marketing, strategy, analysis .

Take The Right Pills For Disease PowerPoint Templates Ppt Backgrounds For Slides 0613
Light The Fuse With Our Medical Powerpoint Templates. Blast The Audience With The Force Of Your Ideas. In Depth Analysis Of Situations Is Your Forte. Use Our Business Powerpoint Templates To Acquaint Your Listeners With Your Results.
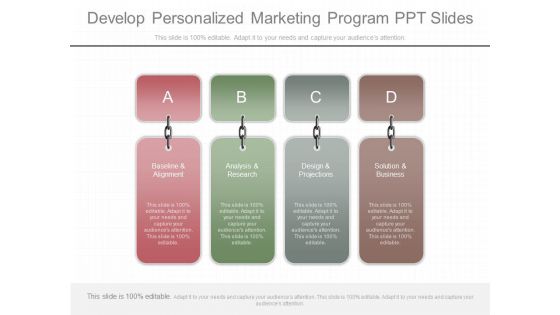
Develop Personalized Marketing Program Ppt Slides
This is a develop personalized marketing program ppt slides. This is a four stage process. The stages in this process are baseline and alignment, analysis and research, design and projections, solution and business.

Architecture Development Method Chart Powerpoint Presentation
This is a architecture development method chart powerpoint presentation. This is a ten stage process. The stages in this process are strategic roadmap, current state, requirements, initial planning, deployment, analysis and design, evaluation, future state, architecture vision, business case.

Marketing Procurement Template Sample Presentation Ppt
This is a marketing procurement template sample presentation ppt. This is a four stage process. The stages in this process are analysis of cost structure, devise appropriate cost levers, business intelligence, produce.

Annual Strategic Planning Process Diagram Powerpoint Topics
This is a annual strategic planning process diagram powerpoint topics. This is a four stage process. The stages in this process are engage with primary stake holders, analysis performance, prepare annual business plan, identity focus areas.

About Us Ppt PowerPoint Presentation Gallery Model
This is a about us ppt powerpoint presentation gallery model. This is a one stage process. The stages in this process are about us, management, planning, business, analysis .

3d Man On The Top Of Puzzle Bar Graph
This PPT has been designed with graphic of 3d man and puzzle are graph. This PPT displays the concept of result analysis and financial growth. Use this PPT for your business and finance related presentations.

3d Happy Person With Dollars PowerPoint Templates
Concept of financial growth analysis with happiness has been defined in this PowerPoint template. This diagram slide contains the graphic of 3d man standing over the currency. Use this image for business and finance related topics in any presentation.

Arrow Design Workflow Infographic Layout Powerpoint Template
Concept of business analysis can be well explained with this power point template. This PPT slide contains design of arrow workflow infographic. Use this diagram slide to make impressive presentations.
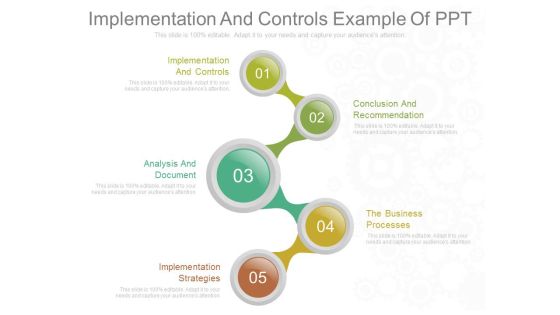
Implementation And Controls Example Of Ppt
This is an implementation and controls example of ppt. This is a five stage process. The stages in this process are implementation and controls, conclusion and recommendation, analysis and document, the business processes, implementation strategies.\n\n

Sample Of Erp Modeling Tools Diagram Ppt Diagrams
This is a sample of erp modeling tools diagram ppt diagrams. This is a seven stage process. The stages in this process are database or repository, communication tools, analysis tools, business intelligence tools, documentation tools, modeling tools, decision support tools.
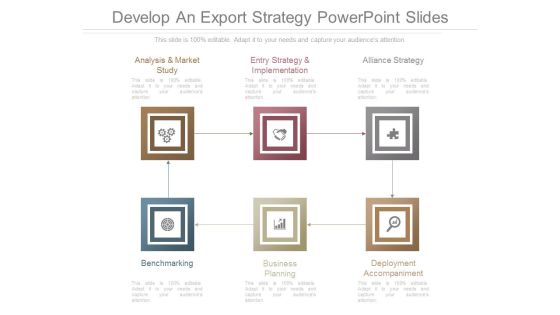
Develop An Export Strategy Powerpoint Slides
This is a develop an export strategy powerpoint slides. This is a six stage process. The stages in this process are analysis and market study, entry strategy and implementation, alliance strategy, benchmarking, business planning, deployment accompaniment.
