AI PPT Maker
Templates
PPT Bundles
Design Services
Business PPTs
Business Plan
Management
Strategy
Introduction PPT
Roadmap
Self Introduction
Timelines
Process
Marketing
Agenda
Technology
Medical
Startup Business Plan
Cyber Security
Dashboards
SWOT
Proposals
Education
Pitch Deck
Digital Marketing
KPIs
Project Management
Product Management
Artificial Intelligence
Target Market
Communication
Supply Chain
Google Slides
Research Services
 One Pagers
All Categories
-
Home
- Customer Favorites
- Quantitative Risk Analysis
Quantitative Risk Analysis

Website Performance Review Template 2 Ppt PowerPoint Presentation Gallery Objects
This is a website performance review template 2 ppt powerpoint presentation gallery objects. This is a three stage process. The stages in this process are margin, revenue, expense, support, other operational.

Crm Dashboard Kpis Ppt PowerPoint Presentation Infographic Template Designs
This is a crm dashboard kpis ppt powerpoint presentation infographic template designs. This is a three stage process. The stages in this process are active subscribers, acquisition, revenue.

Crm Dashboard Sales Dashboard Template Ppt PowerPoint Presentation Professional Layout
This is a crm dashboard sales dashboard template ppt powerpoint presentation professional layout. This is a four stage process. The stages in this process are lead owner breakdown, sales by product march 2017, total lead ownership, month over month closing trend.

Crm Marketing Dashboard Ppt PowerPoint Presentation Icon Graphic Tips
This is a crm marketing dashboard ppt powerpoint presentation icon graphic tips. This is a two stage process. The stages in this process are leads per week, leads this week.
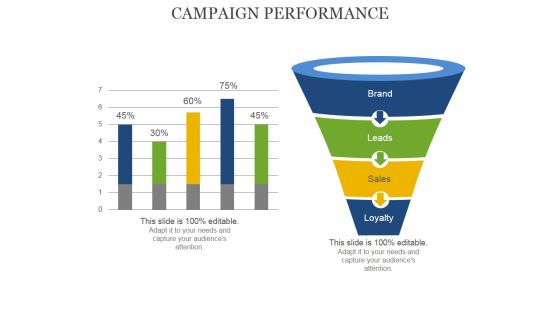
Campaign Performance Ppt PowerPoint Presentation Inspiration Vector
This is a campaign performance ppt powerpoint presentation inspiration vector. This is a two stage process. The stages in this process are loyalty, sales, leads, brand.

Lead Scoring Chart Powerpoint Slide Background
This is a lead scoring chart powerpoint slide background. This is a six stage process. The stages in this process are measurable roi on lead generation program, increased conversion rates from qualified lead to opportunity, increased sales productivity and effectiveness, shortened sales cycle, better forecast and pipeline visibility, better alignment of marketing and sales efforts.

Brand Identity Management Toolkit Firm Growth Review Drivers Inhibitors Opportunities Icons PDF
This slide provides information regarding firm growth analysis framework that help in identifying firm growth drivers, inhibitors, opportunities and risk associated to it. It helps in managing strategic positioning of firm in target market. Formulating a presentation can take up a lot of effort and time, so the content and message should always be the primary focus. The visuals of the PowerPoint can enhance the presenters message, so our Brand Identity Management Toolkit Firm Growth Review Drivers Inhibitors Opportunities Icons PDF was created to help save time. Instead of worrying about the design, the presenter can concentrate on the message while our designers work on creating the ideal templates for whatever situation is needed. Slidegeeks has experts for everything from amazing designs to valuable content, we have put everything into Brand Identity Management Toolkit Firm Growth Review Drivers Inhibitors Opportunities Icons PDF.

RUP Methodology Disciplines Of Rational Unified Process Methodology Summary PDF
This slide depicts the disciplines of the rational unified process methodology, including business modeling, course requirements, analysis and design, and to fulfill all needs.Deliver an awe inspiring pitch with this creative RUP Methodology Disciplines Of Rational Unified Process Methodology Summary PDF bundle. Topics like Business Modelling Discipline, Course Requirements, Analysis And Design can be discussed with this completely editable template. It is available for immediate download depending on the needs and requirements of the user.
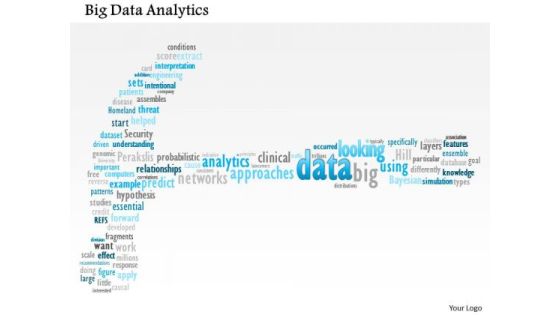
Business Framework Big Data Analytics PowerPoint Presentation
This unique power point diagram slide has been crafted with big data analytics. This data analytics is used to improve predictions and support decision making. Use this image slide for big data analysis related presentations.

Strengthen Customer Relation Firm Growth Review Drivers Inhibitors Opportunities Demonstration PDF
This slide provides information regarding firm growth analysis framework that help in identifying firm growth drivers, inhibitors, opportunities and risk associated to it. It helps in managing strategic positioning of firm in target market. Coming up with a presentation necessitates that the majority of the effort goes into the content and the message you intend to convey. The visuals of a PowerPoint presentation can only be effective if it supplements and supports the story that is being told. Keeping this in mind our experts created Strengthen Customer Relation Firm Growth Review Drivers Inhibitors Opportunities Demonstration PDF to reduce the time that goes into designing the presentation. This way, you can concentrate on the message while our designers take care of providing you with the right template for the situation.

Business Framework Porters Diamond PowerPoint Presentation
This business framework image slide displays Porter's analysis diamond model template. Use this image slide, in your presentations to depicts theory of why particular industries become competitive in particular locations. This image slide will enhance the quality of your presentations.

Business Framework Golden Circle PowerPoint Presentation
This business diagram has been designed with graphic of blue colored circle. This business slide is suitable to display data analysis in any business presentation. Use this slide to build a unique presentations for your viewers

Implementation Of Digital Advancement Techniques Application Areas Of Predictive Topics PDF
The slide outlines use cases of predictive analysis and modelling across insurance industry to deliver best customer experience by appropriate targeting. Application areas are policy optimization, risk and fraud detection, insurance claims management and dynamic customer engagement. Create an editable Implementation Of Digital Advancement Techniques Application Areas Of Predictive Topics PDF that communicates your idea and engages your audience. Whether youre presenting a business or an educational presentation, pre designed presentation templates help save time. Implementation Of Digital Advancement Techniques Application Areas Of Predictive Topics PDF is highly customizable and very easy to edit, covering many different styles from creative to business presentations. Slidegeeks has creative team members who have crafted amazing templates. So, go and get them without any delay.

Definition Of Performance Management Example Of Ppt Presentation
This is a definition of performance management example of ppt presentation. This is a six stage process. The stages in this process are feedback, service improvement, contribution to training, complaint by user investigation, analysis of complaints.

Business Framework 10 Percent To 90 Percent PowerPoint Presentation
This business diagram has been designed with graphic of multiple pie graphs. This diagram slide contains the concept of result analysis with percentage values. Use this diagram to present and compare data in an impressive manner
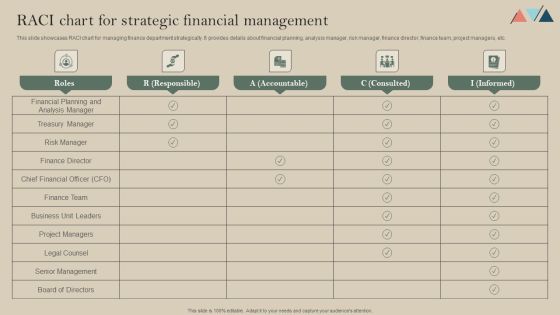
RACI Chart For Strategic Financial Management Diagrams PDF
This slide showcases RACI chart for managing finance department strategically. It provides details about financial planning, analysis manager, risk manager, finance director, finance team, project managers, etc. Here you can discover an assortment of the finest PowerPoint and Google Slides templates. With these templates, you can create presentations for a variety of purposes while simultaneously providing your audience with an eye-catching visual experience. Download RACI Chart For Strategic Financial Management Diagrams PDF to deliver an impeccable presentation. These templates will make your job of preparing presentations much quicker, yet still, maintain a high level of quality. Slidegeeks has experienced researchers who prepare these templates and write high-quality content for you. Later on, you can personalize the content by editing the RACI Chart For Strategic Financial Management Diagrams PDF.
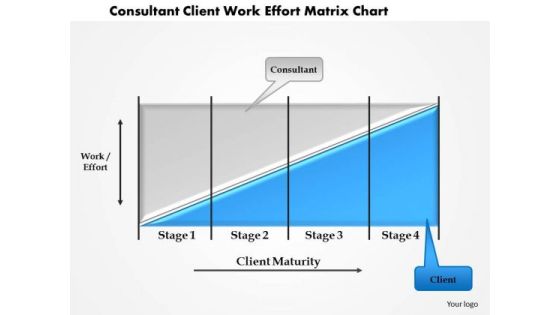
Business Framework Consultant Client Work Effort Matrix Chart PowerPoint Presentation
This business power point template slide has been crafted with graphic of bar graph. This bar graph is called as coase theorem. Use this professional diagram for your result analysis related presentation.
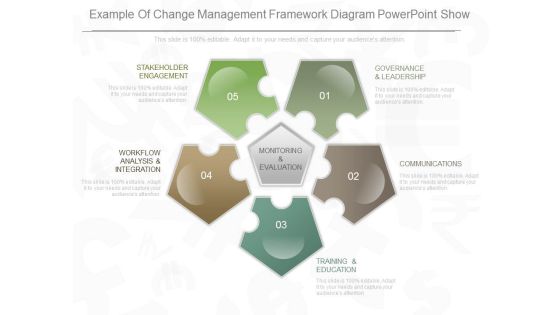
Example Of Change Management Framework Diagram Powerpoint Show
This is a example of change management framework diagram powerpoint show. This is a five stage process. The stages in this process are governance and leadership, communications, training and education, workflow analysis and integration, stakeholder engagement.
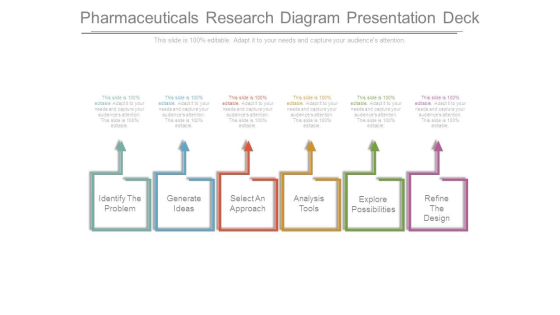
Pharmaceuticals Research Diagram Presentation Deck
This is a pharmaceuticals research diagram presentation deck. This is a six stage process. The stages in this process are identify the problem, generate ideas, select an approach, analysis tools, explore possibilities, refine the design.

Business Research Process Diagram Ppt Example
This is a business research process diagram ppt example. This is a five stage process. The stages in this process are business issues decision, analysis and reporting, data collection, questionnaire development, research objectives methodology.

Market Approach To Business Valuation Introduction Market Intelligence Framework Inspiration PDF
Presenting this set of slides with name market approach to business valuation introduction market intelligence framework inspiration pdf. This is a eight stage process. The stages in this process are definitions and taxonomy, market models, analysis insight, technology adoption, forecast methodologies, customer behavior and preferences, supply site analysis, industry population demographics. This is a completely editable PowerPoint presentation and is available for immediate download. Download now and impress your audience.
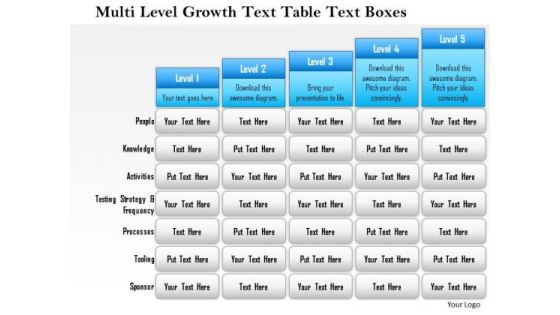
Business Framework Multi Level Growth Text Table Text Boxes 2 PowerPoint Presentation
Five staged text box style chart in bar graph design has been used to decorate this power point template slide. This diagram slide contains the multilevel growth concept. Use this PPT slide for financial growth and result analysis related topics.
Threat Management At Workplace Financial Performance Tracking Dashboard Introduction Pdf
This slide presents the dashboard which will help firm in tracking the fiscal performance. This dashboard displays revenues and expenses trends and payment received analysis. Deliver and pitch your topic in the best possible manner with this threat management at workplace financial performance tracking dashboard introduction pdf. Use them to share invaluable insights on revenue trends, expense trends, receivables analysis and impress your audience. This template can be altered and modified as per your expectations. So, grab it now.
Tablet With Icons And Apps Powerpoint Templates
This power point template has been designed with SWOT analysis infographic. This business diagram can be used to present opportunity, weakness, strength and Threats. Use this diagram to make your presentations more effective.

Information Security Management System Auditing Brochure PDF
The following slide highlights the information security management system audit process illustrating information security system details, information collection, statement o applicability review, audit scope, risk management analysis, gap analysis, business continuity and contingency plan review, mitigation strategy and compliance audit activities PresentingInformation Security Management System Auditing Brochure PDF to dispense important information. This template comprises eight stages. It also presents valuable insights into the topics including Risk Management Analysis, Information Collection, Mitigation Strategy. This is a completely customizable PowerPoint theme that can be put to use immediately. So, download it and address the topic impactfully

Civil Contractors Pre Construction Services Budgeting Ppt Show Images PDF
slide covers all the services offered by our company during preconstruction phase such as budgeting, scheduling, risk and value analysis, logistics planning, etc. Presenting civil contractors pre construction services budgeting ppt show images pdf to provide visual cues and insights. Share and navigate important information on five stages that need your due attention. This template can be used to pitch topics like budgeting, constructability and risk analysis, logistics planning, value analysis, pre construction services. In addtion, this PPT design contains high-resolution images, graphics, etc, that are easily editable and available for immediate download.
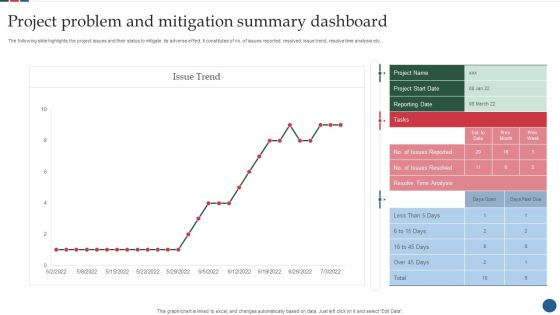
Project Problem And Mitigation Summary Dashboard Designs PDF
The following slide highlights the project issues and their status to mitigate its adverse effect. It constitutes of no. of issues reported, resolved, issue trend, resolve time analysis etc. Showcasing this set of slides titled Project Problem And Mitigation Summary Dashboard Designs PDF. The topics addressed in these templates are Analysis, Project, Mitigation Summary Dashboard. All the content presented in this PPT design is completely editable. Download it and make adjustments in color, background, font etc. as per your unique business setting.

Management Process Approach Example Of Ppt Presentation
This is a management process approach example of ppt presentation. This is a four stage process. The stages in this process are management responsibility, resource management, measurement analysis and improvement, product realization.

Investment Management Approach Sample Diagram Ppt Design
This is a investment management approach sample diagram ppt design. This is a four stage process. The stages in this process are ongoing monitoring, analysis and recommendation, due diligence, screening.

Customer Management Order Management Powerpoint Slide
This is a customer management order management powerpoint slide. This is a one stage process. The stages in this process are credit and debt collection, customer management, order management, analysis and reporting, cash receipts.\n\n
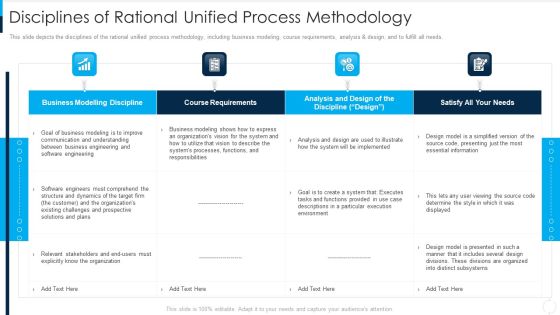
RUP Model Disciplines Of Rational Unified Process Methodology Ppt Infographic Template File Formats PDF
This slide depicts the disciplines of the rational unified process methodology, including business modeling, course requirements, analysis and design, and to fulfill all needs. Deliver an awe inspiring pitch with this creative rup model disciplines of rational unified process methodology ppt infographic template file formats pdf bundle. Topics like business modelling discipline, course requirements, analysis and design can be discussed with this completely editable template. It is available for immediate download depending on the needs and requirements of the user.

Openup Methodology IT Open Up Phases And Iterative Development Formats PDF
This template covers the iterative cross disciplinaries such as business modeling, requirements, analysis, design, implementation along with openup phases. Deliver and pitch your topic in the best possible manner with this openup methodology it open up phases and iteration template guidelines pdf. Use them to share invaluable insights on business modeling, analysis and design, deployment and impress your audience. This template can be altered and modified as per your expectations. So, grab it now.
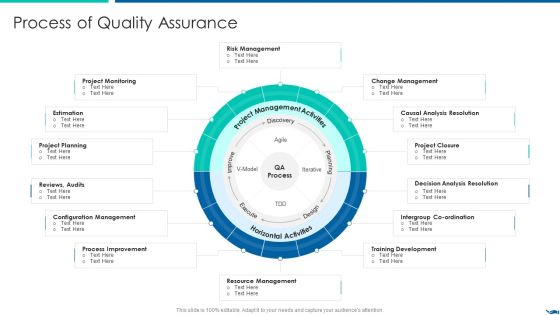
Project QA Through Agile Methodology IT Process Of Quality Assurance Diagrams PDF
This is a Project QA Through Agile Methodology IT Process Of Quality Assurance Diagrams PDF template with various stages. Focus and dispense information on fourteen stages using this creative set, that comes with editable features. It contains large content boxes to add your information on topics like Causal Analysis Resolution, Decision Analysis Resolution, Training Development You can also showcase facts, figures, and other relevant content using this PPT layout. Grab it now.

Introduction To IT Project Development Analysing Project To Trace The Problem Template PDF
This slide provides the glimpse about the project analyzing to trace the problem faced by the company wherein we have covered software analysis, design, development and testing. Deliver an awe inspiring pitch with this creative introduction to it project development analysing project to trace the problem template pdf bundle. Topics like design, development, analysis can be discussed with this completely editable template. It is available for immediate download depending on the needs and requirements of the user.
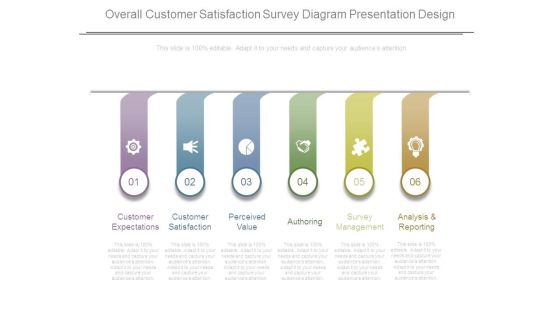
Overall Customer Satisfaction Survey Diagram Presentation Design
This is a overall customer satisfaction survey diagram presentation design. This is a six stage process. The stages in this process are customer expectations, customer satisfaction, perceived value, authoring, survey management, analysis and reporting.

Customer Satisfaction Survey Graphic Design Ppt Slide Template
This is a customer satisfaction survey graphic design ppt slide template. This is a three stage process. The stages in this process are collection of customer opinions, discussion on improvement plan implementation, analysis of customer opinion.\n\n\n\n

Business Diagram Business People Over Bar Chart PowerPoint Template
This Power Point template has been designed with graphic of business people and bar chart. This PPT contains the concept of result analysis and business data display. Use this PPT slide for your business and marketing related presentations.

Business Diagram Four Staged Business Text Boxes For Data Representation Presentation Template
Four staged business text boxes are used to design this Power Point template slide. This PPT slide contains the concept of data representation. Use this PPT slide for your business and sales data analysis related topics in any presentation.

Product Marketing Campaign Formulation Process Framework Elements PDF
This slide provides strategic development process framework for product marketing to ensure product market fit. It includes internal and external analysis of firm, SWOT analysis and executing marketing strategy. Presenting Product Marketing Campaign Formulation Process Framework Elements PDF to dispense important information. This template comprises one stages. It also presents valuable insights into the topics including Study, Plan, Implement, Control. This is a completely customizable PowerPoint theme that can be put to use immediately. So, download it and address the topic impactfully.

Business Diagram Big Data Big Insight From Data Feeds To Explain The Benefits Ppt Slide
Explain the benefits of big data analysis and data feeds with this technology diagram. This slide contains the graphic of scale with big data and big insight. Use this slide your data information and measurement related presentations.

Business Diagram Creative Graph For Business Reports Presentation Template
Download this diagram to display planning and analysis concepts. This business diagram contains the graphic of creative graph for business reports. Use this template to highlight the key issues of your presentation.

Business Diagram Process Pyramids Bar Chart Business Slide Presentation Template
Graphic of pyramid and bar chart has been used to design this power point template diagram. This PPT diagram contains the concept of business result analysis and process flow. Use this template slide and display result in your presentations.
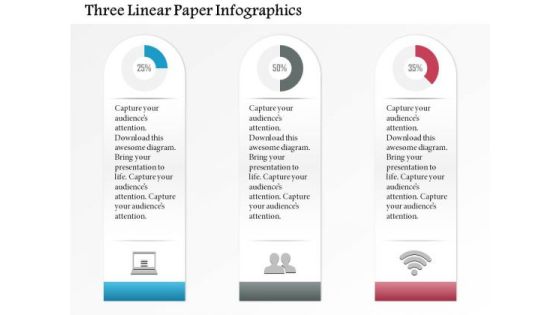
Business Diagram Three Linear Paper Infographics Presentation Template
Three linear paper info graphics has been used to design this power point template slide. This PPT slide contains the concept of data analysis and business data flow. Use this PPT slide for your business and marketing related presentations.
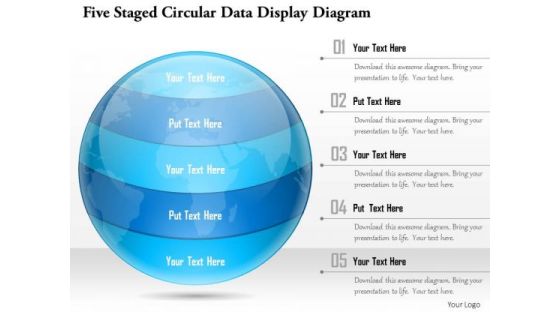
Business Diagram Five Staged Circular Data Display Diagram Presentation Template
This Power Point template slide has been crafted with graphic of five staged circular diagram. This PPT slide contains the concept of data analysis and representation. This PPT slide can be used for business data presentations.

Business Diagram Colorful Infographics For Data Representation Presentation Template
This power point template diagram has been crafted with graphic of colorful info graphics. This PPT diagram contains the concept of analysis and data representations. Use this PPT for marketing and business related presentations.

Business Process Modeling Powerpoint Slide Backgrounds
This is a business process modeling powerpoint slide backgrounds. This is a five stage process. The stages in this process are business process modeling, analysis and design, process policy management, process performance, management, architecture and design.
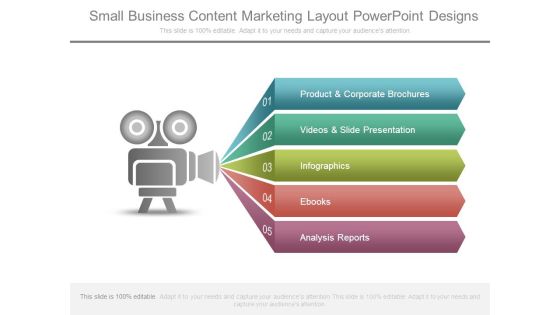
Small Business Content Marketing Layout Powerpoint Designs
This is a small business content marketing layout powerpoint designs. This is a five stage process. The stages in this process are product and corporate brochures, videos and slide presentation, infographics, ebooks, analysis reports.

Chart Of Four Business Steps Powerpoint Templates
This business diagram displays flow of four business steps. This editable slide is suitable to present growth management. Use this diagram for business and finance related topics and display complete data analysis in your presentation.

Business Diagram Business Workflow Layout Diagram For Process Flow Presentation Template
This business diagram displays graphic of multiple business icons around globe. This power point template contains the concept of business analysis and research. Use this diagram to build unique presentation for your viewers.

Business Diagram Map Shuffle Reduce Phases Shown In Big Data Analytic Processing Ppt Slide
This technology slide has been designed with graphic of map and data text. This diagram helps to depict concept of data analysis and processing. Use this diagram slide for computer technology related presentations.

Battery Icons For Business Growth Levels Powerpoint Template
Levels of business growth can be displayed with this diagram. This PowerPoint template contains graphics of seven battery icons. You can use this design for data analysis in business presentations

Business Diagram Colored 3d Flow Chart For Data Processing Presentation Template
Colored 3d flow chart has been used to design this power point template. This PPT contains the concept of data processing. Use this PPT for your data communication and analysis related presentations.

Business Diagram 3d Venn Diagram For Global Business Project Presentation Template
This business diagram displays 3d Venn diagram. This editable slide is suitable to present business reports. Use this diagram for business and finance related topics and display complete data analysis in your presentation.

Business Process Workflow Diagram Ppt Model
This is a business process workflow diagram ppt model. This is a five stage process. The stages in this process are structure of business process, business process, main task, subtask, activity, performance, analysis of business process.

Business Strategy Messaging Strategy Ppt Slides
This is a business strategy messaging strategy ppt slides. This is a eight stage process. The stages in this process are business strategy, lead distribution, analysis and refinement, conversation management, messaging strategy, content management, social media marketing, strategy content plan.

Define Business Objectives Powerpoint Presentation Examples
This is a define business objectives powerpoint presentation examples. This is a four stage process. The stages in this process are define business objectives, through analysis and review, communication with audience, decision making.

Crm Strategy For Small Business Ppt Infographics
This is a crm strategy for small business ppt infographics. This is a four stage process. The stages in this process are sales and marketing, analysis reporting, relation management, service.

Business Process Management Strategy Powerpoint Layout
This is a business process management strategy powerpoint layout. This is a five stage process. The stages in this process are analysis reporting, erp finance, relation management, service, sales marketing.

Business Growth Development Process Ppt Powerpoint Slides
This is a business growth development process ppt powerpoint slides. This is a eight stage process. The stages in this process are initiation, analysis and planning, design, implementation, integration, stabilization, deployment, maintenance and support.

Strategic Information System Business Planning Powerpoint Templates
This is a strategic information system business planning powerpoint templates. This is a five stage process. The stages in this process are post implementation services, operations, strategic planning, analysis and design, deployment.
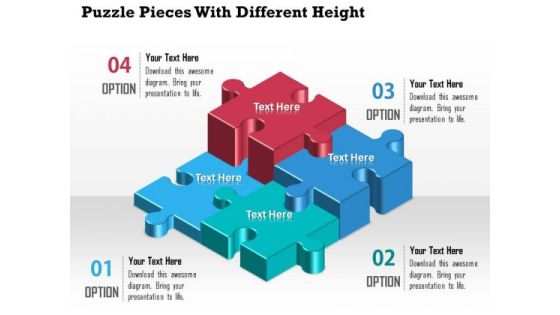
Business Diagram Puzzle Pieces With Different Height Presentation Template
A professional bar graph has been crafted with graphic of puzzles. All these puzzles are in different heights which shows the various levels of any data result representations. Use this diagram for your business result and data analysis related topics.
Six Staged Infographics Square With Business Icons Powerpoint Templates
This business diagram displays circular puzzle infographic. This editable slide is suitable to present global communication. Use this diagram for business and finance related topics and display complete data analysis in your presentation.

Business Plan Marketing Plan Example Of Ppt Presentation
This is a business plan marketing plan example of ppt presentation. This is a four stage process. The stages in this process are business analysis success, business plan, marketing plan, loan financial.

Business Diagram Pie Chart Octagon Shape Presentation Template
This business plan power point template has been designed with pie chart in octagon shape. This PPT contains the concept of result analysis for any business process. Use this PPT for business and sales related presentations.

Business Diagram Paper Clips Circular Chart Presentation Template
This power point template has been designed with graphic of circular chart made with paper clips. These business icons are used to display the concept of business result analysis and meeting. Use this diagram for business and marketing presentations.
Five Circular Steps With Business Icons Powerpoint Templates
This business diagram has been designed with circular graphics with business icons. This slide suitable for business analysis and strategy presentation. Use this diagram to present your views in a wonderful manner.
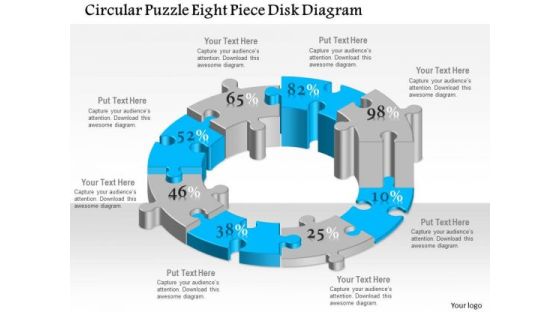
Business Diagram Circular Puzzle Eight Piece Disk Diagram Presentation Template
This business plan power point template has been designed with six staged circular puzzle diagram. This diagram template contains the concept of business process flow and result analysis representation. Use this diagram in your presentation and show these concepts.
Business Diagram Six Icons For Communication Presentation Template
Our above business diagram has been designed with six business icons. You may present market analysis using this diagram. Pressure cooks your views with this diagram. You will hear whistles of appreciation.
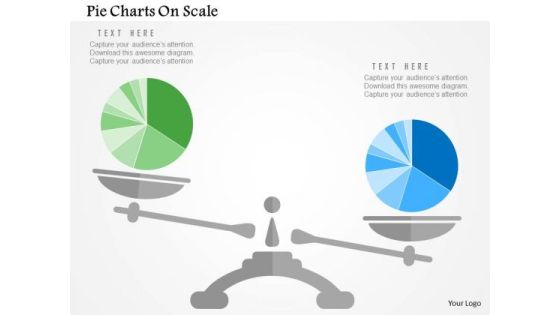
Business Diagram Pie Charts On Scale Presentation Template
Our above slide display graphics of pie chart on a scale. Download this diagram slide to display competitive analysis of business. Adjust the above diagram in your business presentations to visually support your content.
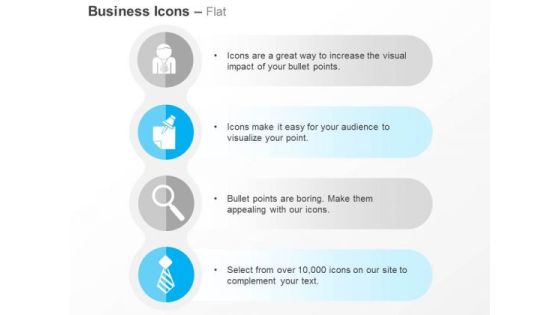
Business Man Post It Notes Magnifier Tie Ppt Slides Graphics
This PPT slide displays icons of business man, post it notes and magnifier. This PPT helps to depict search and analysis of business information. This icon slide is innovatively designed to highlight your worthy views

Circular Arrow Chart With Business Icons Powerpoint Slides
Graphics of circular arrow chart with icons have been displayed in this business slide. This business diagram helps to exhibit strategy analysis and management. Use this PowerPoint template to visually support your content.

Circular Arrows Design With Icons For Business Powerpoint Slides
Graphics of circular arrows design with icons have been displayed in this business slide. This business diagram helps to exhibit strategy analysis and management. Use this PowerPoint template to visually support your content.

Business Diagram Eight Staged Circular Puzzle Bar Graph Presentation Template
This Power Point template has been crafted with graphic of eight staged circular puzzle and bar graph. This PPT contains the financial result analysis related concept. Use this PPT for your business and success related presentations.

Timeline For Team Business Target Achievement Powerpoint Slides
This PowerPoint template contains circles around business team. It may be used to display analysis of team strategy. Download this PPT slide to demonstrate how you intend to navigate your steps towards the desired corporate goal.

Financial Business Marketing Ppt PowerPoint Presentation Layouts Infographic Template
This is a financial business marketing ppt powerpoint presentation layouts infographic template. This is a four finance, marketing, management, investment, analysis stage process. The stages in this process are.

Business Website Role In Branding Ppt Powerpoint Ideas
This is a business website role in branding ppt powerpoint ideas. This is a five stage process. The stages in this process are content development, marketing strategies, analysis and adjustment, track and measure, implementation, social media marketing.

Business Summary Report Icon Ppt Powerpoint Presentation Styles Model
This is a business summary report icon ppt powerpoint presentation styles model. This is a four stage process. The stages in this process are executive summary, analysis summary, review summary.
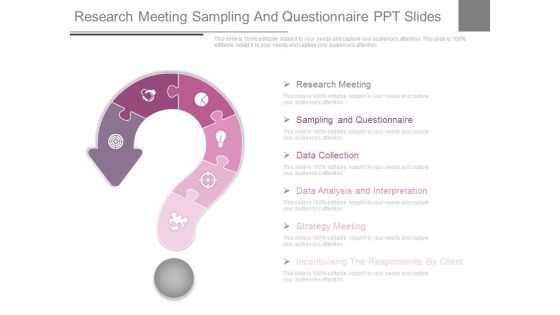
Research Meeting Sampling And Questionnaire Ppt Slides
This is a research meeting sampling and questionnaire ppt slides. This is a six stage process. The stages in this process are sampling and questionnaire, research meeting, data collection, data analysis and interpretation, strategy meeting, incentivising the respondents by client.

Business Diagram Six Pie Charts For Result Representation And Percentage Presentation Template
Display the concept of result analysis in your business presentation. This PPT slide contains the graphic of six pie charts. Use this PPT slide for your business and marketing data related presentations.

Stock Photo Black Brown Pie Chart For Business Result PowerPoint Slide
This high quality image is designed with pie chart. Use this image to make business reports. Use this outstanding image in presentations relating to data analysis and reports. Go ahead and add charm to your presentations.
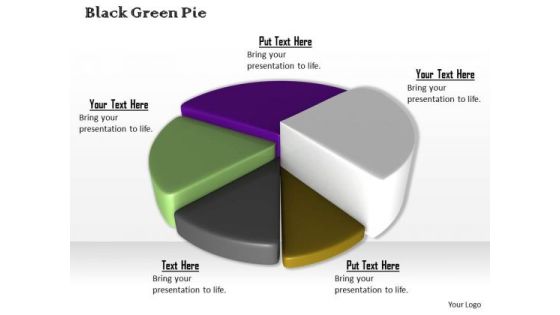
Stock Photo Colorful 3d Pie Chart For Business Result PowerPoint Slide
This high quality image is designed with pie chart. Use this image to make business reports. Use this outstanding image in presentations relating to data analysis and reports. Go ahead and add charm to your presentations.
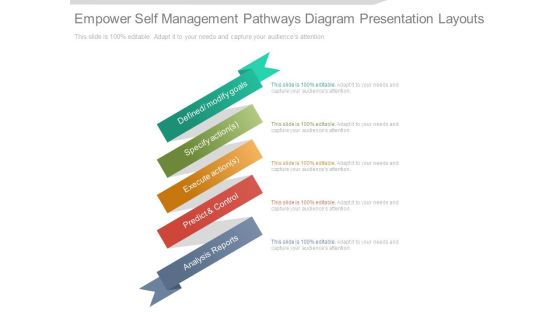
Empower Self Management Pathways Diagram Presentation Layouts
This is a Empower Self Management Pathways Diagram Presentation Layouts. This is a five stage process. The stages in this process are defined modify goals, specify action, execute action, predict and control, analysis reports.

Layout For Precentage Data Display PowerPoint Template
Growth analysis for business can be defined with this business diagram. This slide depicts text boxes in increasing flow. Present your views using this innovative slide and be assured of leaving a lasting impression
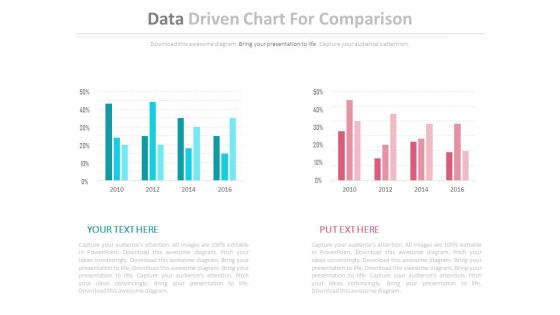
Two Data Driven Comparison Charts Powerpoint Slides
This PowerPoint template contains diagram of two data driven charts. You may use this PPT slide to depict strategic analysis for business. The color coding of this template is specifically designed to highlight you points.

Data Migration Steps Ppt PowerPoint Presentation Slides Inspiration
This is a data migration steps ppt powerpoint presentation slides inspiration. This is a three stage process. The stages in this process are analysis stage, development stage, go live support stage, marketing, technology.

Strategy Blog Example Diagram Ppt Samples
This is a strategy blog example diagram ppt samples. This is a five stage process. The stages in this process are website development process, analysis and marketing, technology, execution, creative, discovery.

Stock Photo Golden Dollar Symbol With Pie Graph PowerPoint Slide
This Power Point template has been crafted with graphic of golden dollar symbol and pie chart on a tablet. Display the concept of financial data analysis with this image. Use this image to present financial reports in business presentations.
Rocket With Three Staged Icons Powerpoint Template
Growth analysis for business can be defined with this business diagram. This slide depicts rocket with three staged icons. Present your views using this innovative slide and be assured of leaving a lasting impression

Advanced Analytic Capabilities Template Example Ppt Presentation
This is a advanced analytic capabilities template example ppt presentation. This is a seven stage process. The stages in this process are analysis and modeling, model management, enterprise use of analytics, data preparation, business analyst, business manager, executive management commitment

Kpi Engineering Process Cycle Diagram Ppt Sample
This is a kpi engineering process cycle diagram ppt sample. This is a six stage process. The stages in this process are program discovery, database optimization, program implementation, program delivery, program maintenance, analysis and reporting.

Lego Blocks Design For Data Representation Powerpoint Slides
This PowerPoint template has been designed with Lego blocks diagram. You can use this ppt slide for statistical analysis or for data representation. Download this PPT slide to build impressive presentations.

Four Tags For Strategy Planning Process Powerpoint Template
Steps for strategy planning can be explained with this diagram. This PowerPoint template contains diagram of four infographic tags. You can also use this design for data analysis in business presentations

Flower Diagram For Educational Training Powerpoint Template
Colorful flowers have been used to design this PowerPoint diagram. This colorful PPT slide may be used for educational training. You can use this design for data analysis in business presentations

Text Boxes With Percentage Values PowerPoint Template
Growth analysis for business can be defined with this business diagram. This slide depicts text boxes in increasing flow. Present your views using this innovative slide and be assured of leaving a lasting impression
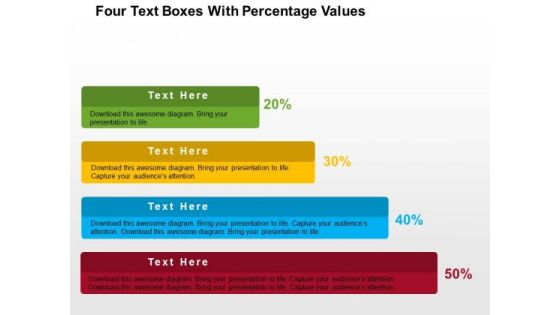
Four Text Boxes With Percentage Values PowerPoint Template
Growth analysis for business can be defined with this business diagram. This slide depicts text boxes in increasing flow. Present your views using this innovative slide and be assured of leaving a lasting impression
Three Arrows With Icons Powerpoint Templates
This business diagram displays graphic of three arrows with icons. This power point template contains the concept of business analysis and research. Use this diagram to build unique presentation for your viewers.

Three Options Text Arrow Boxes Powerpoint Templates
This business diagram displays graphic of arrows with icons. This power point template contains the concept of business analysis and research. Use this diagram to build unique presentation for your viewers.
Six Text Boxes With Icons Powerpoint Template
This business slide contains pie chart infographic layout. This diagram is suitable to present business deal and analysis This diagram provides schematic representation of any information and provides more clarity to the subject.
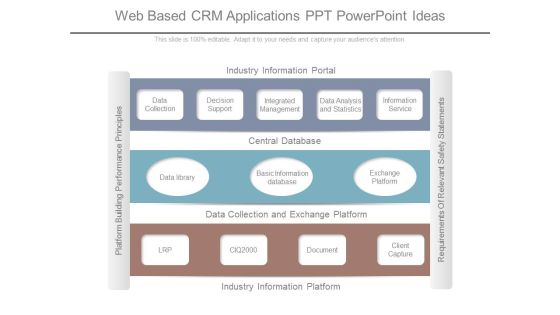
Web Based Crm Applications Ppt Powerpoint Ideas
This is a web based crm applications ppt powerpoint ideas. This is a three stage process. The stages in this process are industry information portal, data collection, decision support, integrated management, data analysis and statistics, information service, central database.
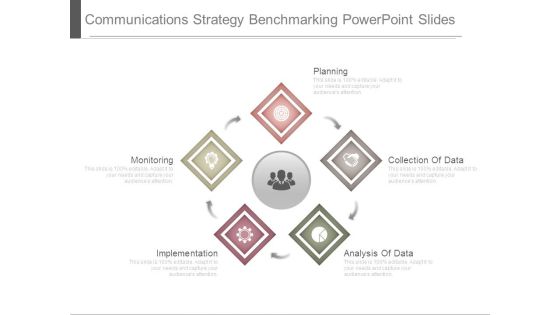
Communications Strategy Benchmarking Powerpoint Slides
This is a communications strategy benchmarking powerpoint slides. This is a five stage process. The stages in this process are planning, collection of data, analysis of data, implementation, monitoring.
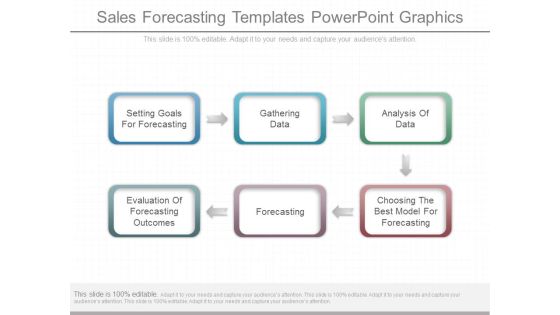
Sales Forecasting Templates Powerpoint Graphics
This is a sales forecasting templates powerpoint graphics. This is a six stage process. The stages in this process are setting goals for forecasting, gathering data, analysis of data, evaluation of forecasting outcomes, forecasting, choosing the best model for forecasting.
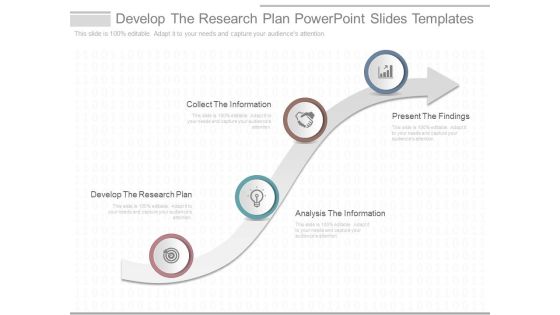
Develop The Research Plan Powerpoint Slides Templates
This is a develop the research plan powerpoint slides templates. This is a four stage process. The stages in this process are develop the research plan, collect the information, analysis the information, present the findings.
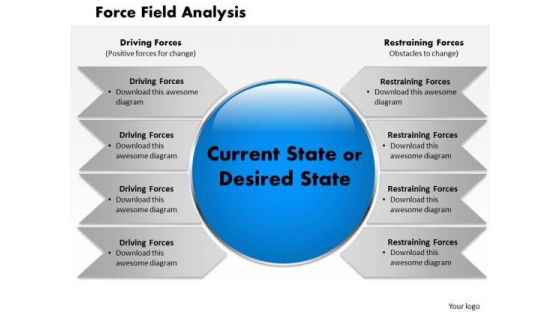
Force Field Anaysis PowerPoint Presentation Template
Good Camaraderie Is A Key To Teamwork. Our Force Field Analysis PowerPoint Presentation Template Powerpoint Templates Can Be A Cementing Force. Our Business Charts Powerpoint Templates Are An Agent Of Change. Let Your Thoughts Go Down Uncharted Courses.
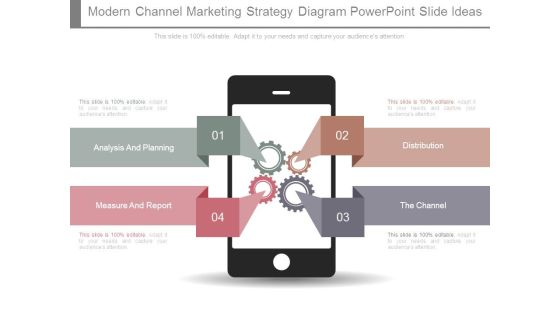
Modern Channel Marketing Strategy Diagram Powerpoint Slide Ideas
This is a modern channel marketing strategy diagram powerpoint slide ideas. This is a four stage process. The stages in this process are analysis and planning, measure and report, distribution, the channel.

Team With Bar Graph And Teamwork
This Power Point template has been designed with graphic of 3d team forming a pie chart. In this slide team is displaying data analysis and comparison. Use this editable slide to build innovative presentation for your viewers.
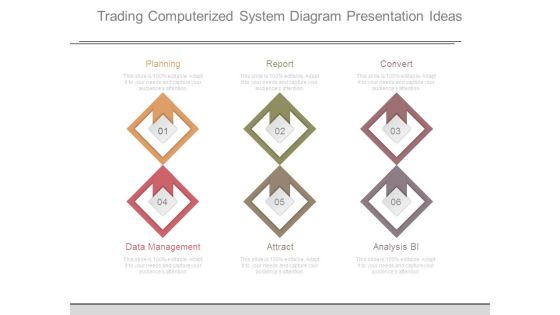
Trading Computerized System Diagram Presentation Ideas
This is a trading computerized system diagram presentation ideas. This is a six stage process. The stages in this process are planning, report, convert, data management, attract, analysis bi.
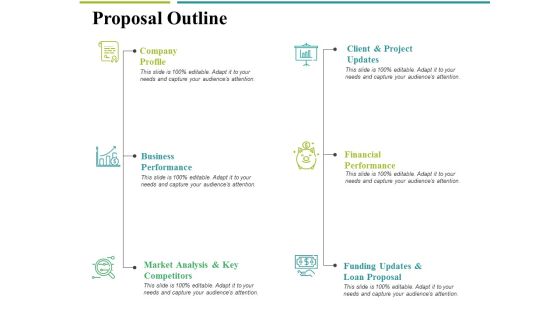
Proposal Outline Ppt PowerPoint Presentation Gallery Background Designs
This is a proposal outline ppt powerpoint presentation gallery background designs. This is a six stage process. The stages in this process are company profile, business performance, market analysis and key competitors, client and project updates, financial performance.

Employee Performance Summary Ppt PowerPoint Presentation Styles Slide
This is a employee performance summary ppt powerpoint presentation styles slide. This is a three stage process. The stages in this process are business, icons, marketing, strategy, analysis .

Take The Right Pills For Disease PowerPoint Templates Ppt Backgrounds For Slides 0613
Light The Fuse With Our Medical Powerpoint Templates. Blast The Audience With The Force Of Your Ideas. In Depth Analysis Of Situations Is Your Forte. Use Our Business Powerpoint Templates To Acquaint Your Listeners With Your Results.
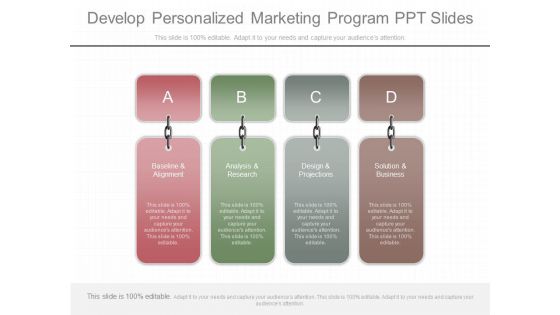
Develop Personalized Marketing Program Ppt Slides
This is a develop personalized marketing program ppt slides. This is a four stage process. The stages in this process are baseline and alignment, analysis and research, design and projections, solution and business.

Architecture Development Method Chart Powerpoint Presentation
This is a architecture development method chart powerpoint presentation. This is a ten stage process. The stages in this process are strategic roadmap, current state, requirements, initial planning, deployment, analysis and design, evaluation, future state, architecture vision, business case.

Marketing Procurement Template Sample Presentation Ppt
This is a marketing procurement template sample presentation ppt. This is a four stage process. The stages in this process are analysis of cost structure, devise appropriate cost levers, business intelligence, produce.

Annual Strategic Planning Process Diagram Powerpoint Topics
This is a annual strategic planning process diagram powerpoint topics. This is a four stage process. The stages in this process are engage with primary stake holders, analysis performance, prepare annual business plan, identity focus areas.

About Us Ppt PowerPoint Presentation Gallery Model
This is a about us ppt powerpoint presentation gallery model. This is a one stage process. The stages in this process are about us, management, planning, business, analysis .

3d Man On The Top Of Puzzle Bar Graph
This PPT has been designed with graphic of 3d man and puzzle are graph. This PPT displays the concept of result analysis and financial growth. Use this PPT for your business and finance related presentations.

3d Happy Person With Dollars PowerPoint Templates
Concept of financial growth analysis with happiness has been defined in this PowerPoint template. This diagram slide contains the graphic of 3d man standing over the currency. Use this image for business and finance related topics in any presentation.

Arrow Design Workflow Infographic Layout Powerpoint Template
Concept of business analysis can be well explained with this power point template. This PPT slide contains design of arrow workflow infographic. Use this diagram slide to make impressive presentations.
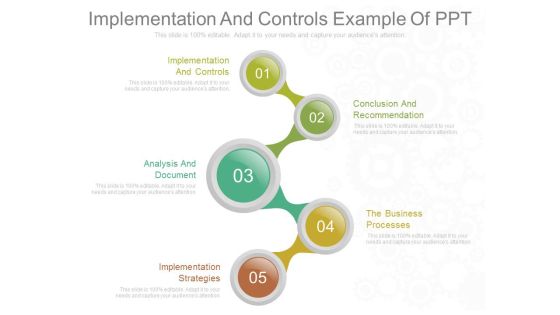
Implementation And Controls Example Of Ppt
This is an implementation and controls example of ppt. This is a five stage process. The stages in this process are implementation and controls, conclusion and recommendation, analysis and document, the business processes, implementation strategies.\n\n

Sample Of Erp Modeling Tools Diagram Ppt Diagrams
This is a sample of erp modeling tools diagram ppt diagrams. This is a seven stage process. The stages in this process are database or repository, communication tools, analysis tools, business intelligence tools, documentation tools, modeling tools, decision support tools.
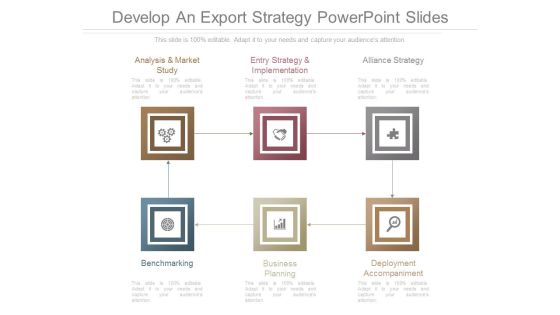
Develop An Export Strategy Powerpoint Slides
This is a develop an export strategy powerpoint slides. This is a six stage process. The stages in this process are analysis and market study, entry strategy and implementation, alliance strategy, benchmarking, business planning, deployment accompaniment.
