Quality Inspection
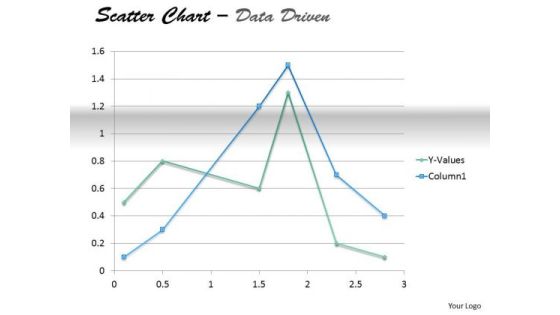
Examples Of Data Analysis Market Driven Present In Scatter Chart PowerPoint Slides Templates
Your Thoughts Will Take To Our examples of data analysis market driven present in scatter chart powerpoint slides Templates Like A Duck To Water. They Develop A Binding Affinity.
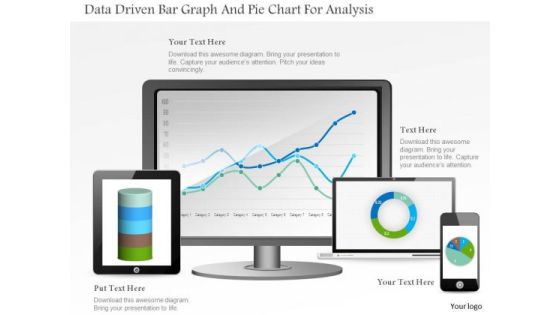
Business Diagram Data Driven Bar Graph And Pie Chart For Analysis PowerPoint Slide
This PowerPoint template displays technology gadgets with various business charts. Use this diagram slide, in your presentations to make business reports for statistical analysis. You may use this diagram to impart professional appearance to your presentations.

Business Diagram Tablet With Pie And Business Bar Graph For Result Analysis PowerPoint Slide
This PowerPoint template displays technology gadgets with various business charts. Use this diagram slide, in your presentations to make business reports for statistical analysis. You may use this diagram to impart professional appearance to your presentations.

Business Diagram Alarm Clock With Pie Chart For Result Analysis PowerPoint Slide
This business slide displays alarm clock with pie chart. This diagram is a data visualization tool that gives you a simple way to present statistical information. This slide helps your audience examine and interpret the data you present.
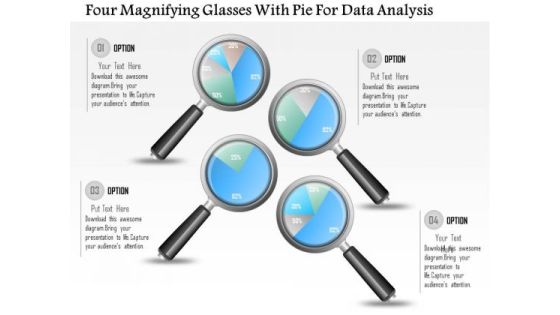
Business Diagram Four Magnifying Glasses With Pie For Data Analysis PowerPoint Slide
This business diagram displays graphic of pie charts in shape of magnifying glasses This business slide is suitable to present and compare business data. Use this diagram to build professional presentations for your viewers.
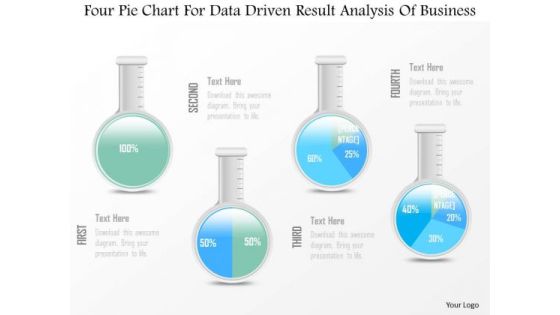
Business Diagram Four Pie Chart For Data Driven Result Analysis Of Business PowerPoint Slide
This business diagram displays graphic of pie charts in shape of flasks. This business slide is suitable to present and compare business data. Use this diagram to build professional presentations for your viewers.
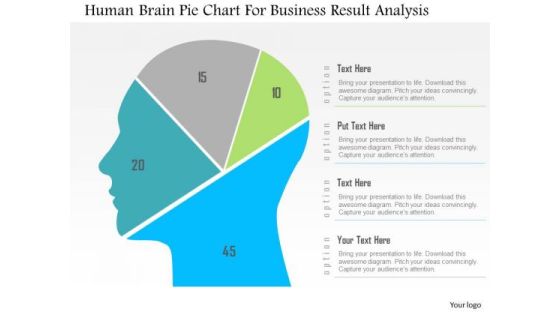
Business Diagram Human Brain Pie Chart For Business Result Analysis PowerPoint Slide
This diagram displays human face graphic divided into sections. This section can be used for data display. Use this diagram to build professional presentations for your viewers.
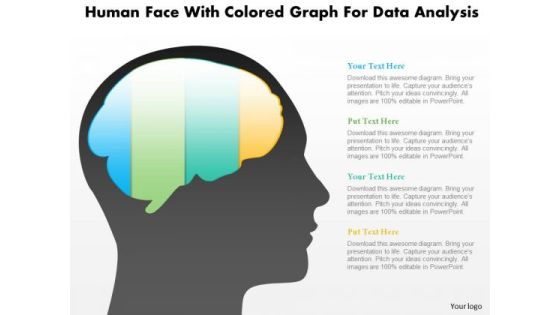
Business Diagram Human Face With Colored Graph For Data Analysis PowerPoint Slide
This diagram displays human face graphic with colored graph. This diagram can be used to represent strategy, planning, thinking of business plan. Display business options in your presentations by using this creative diagram.

Market Research Databases Example Diagram Ppt Samples
This is a market research databases example diagram ppt samples. This is a four stage process. The stages in this process are survey data plus rich engagement, excellent use of emails from a database, focus groups that transcend geography, market research databases, enables repeat conversations and inquiries.
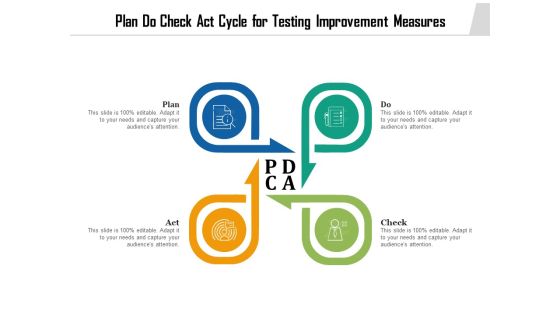
Plan Do Check Act Cycle For Testing Improvement Measures Ppt PowerPoint Presentation Topics PDF
Persuade your audience using this plan do check act cycle for testing improvement measures ppt powerpoint presentation topics pdf. This PPT design covers four stages, thus making it a great tool to use. It also caters to a variety of topics including plan do check act cycle for testing improvement measures. Download this PPT design now to present a convincing pitch that not only emphasizes the topic but also showcases your presentation skills.
Doctor Checking Sample In Test Tube Vector Icon Ppt PowerPoint Presentation Show Gallery PDF
Showcasing this set of slides titled doctor checking sample in test tube vector icon ppt powerpoint presentation show gallery pdf. The topics addressed in these templates are doctor checking sample in test tube vector icon. All the content presented in this PPT design is completely editable. Download it and make adjustments in color, background, font etc. as per your unique business setting.

Blood Sample Checking During Medical Testing Ppt PowerPoint Presentation Icon Infographics PDF
Presenting blood sample checking during medical testing ppt powerpoint presentation icon infographics pdf to dispense important information. This template comprises three stages. It also presents valuable insights into the topics including blood sample checking during medical testing. This is a completely customizable PowerPoint theme that can be put to use immediately. So, download it and address the topic impactfully.

Craft The Perfect Event Proposal Event Marketing Recap Proposal Leads By Category Mockup PDF
Deliver an awe inspiring pitch with this creative craft the perfect event proposal event marketing recap proposal leads by category mockup pdf bundle. Topics like inquiries, true sales lead, opportunities, target leads by category can be discussed with this completely editable template. It is available for immediate download depending on the needs and requirements of the user.

Software Testing Service Delivery Excellence Model Mockup PDF
This slide showcases delivery excellence framework for software testing services which helps integrate business processes across diverse technologies. It provides information regarding end to end testing, test automation, data testing and security testing. Showcasing this set of slides titled Software Testing Service Delivery Excellence Model Mockup PDF. The topics addressed in these templates are Performance Testing, Digital Test Assurance, Security Testing. All the content presented in this PPT design is completely editable. Download it and make adjustments in color, background, font etc. as per your unique business setting.

Market Analysis Overview And Different Categories Measuring Brand Awareness Through Survey Form Inspiration PDF
The following slide outlines a comprehensive questionnaire form through which marketers can measure customer perception about our brand. The questions mentioned in slide are related to brand reliability, confidence when buying product, etc. Do you know about Slidesgeeks Market Analysis Overview And Different Categories Measuring Brand Awareness Through Survey Form Inspiration PDF. These are perfect for delivering any kind od presentation. Using it, create PowerPoint presentations that communicate your ideas and engage audiences. Save time and effort by using our pre designed presentation templates that are perfect for a wide range of topic. Our vast selection of designs covers a range of styles, from creative to business, and are all highly customizable and easy to edit. Download as a PowerPoint template or use them as Google Slides themes.
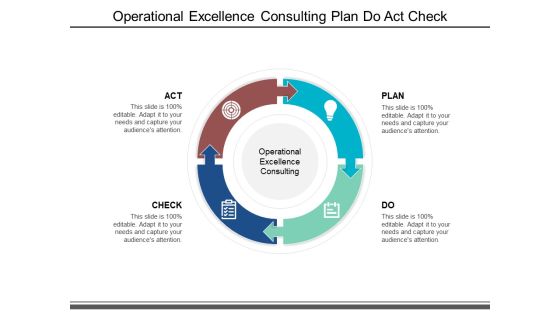
Operational Excellence Consulting Plan Do Act Check Ppt PowerPoint Presentation Professional Background
This is a operational excellence consulting plan do act check ppt powerpoint presentation professional background. This is a four stage process. The stages in this process are diagram of kaizen, diagram of improvements, diagram of enhancement.

Business Diagram Extract Transform Load Etl Business Intelligence Bug Data Analysis Pipeline Ppt Sli
This PowerPoint template has been designed with graphic of server. This diagram depicts the concept of ETL business intelligence with extract transform load. This slide also helps to display the data analysis pipeline.
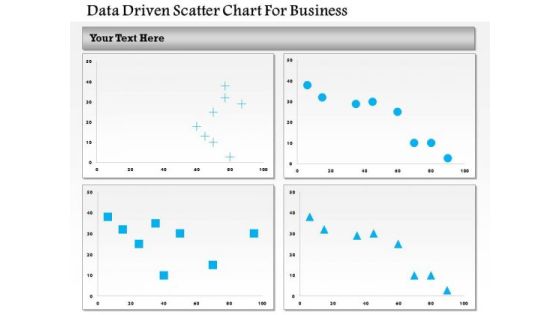
Business Diagram Data Driven Scatter Chart For Business PowerPoint Slide
This business diagram has been designed with four comparative charts. This slide suitable for data representation. You can also use this slide to present business analysis and reports. Use this diagram to present your views in a wonderful manner.
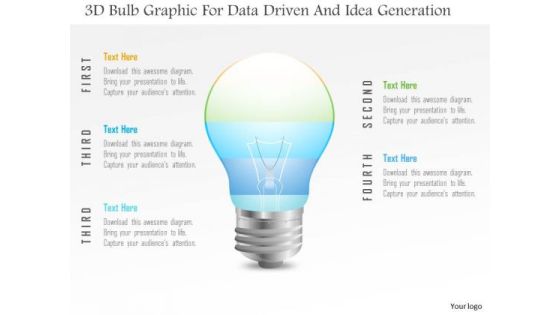
Business Diagram 3d Bulb Graphic For Data Driven And Idea Generation PowerPoint Slide
This Power Point template has been designed with 3d bulb graphic. Use this slide to represent technology idea and strategy concepts. Download this diagram for your business presentations and get exclusive comments on your efforts.
Business Diagram 3d Capsule With Multiple Icons For Business Data Flow PowerPoint Slide
This diagram has been designed with 3d graphic of capsule with multiple icons. This data driven PowerPoint slide can be used to give your presentations more effective look. It helps in clearly conveying your message to clients and audience.

Business Diagram 3d Colorful Pie Graph With Magnifier Data Search PowerPoint Slide
This business slide displays 3d colorful pie graph with magnifier. This diagram is a data visualization tool that gives you a simple way to present statistical information. This slide helps your audience examine and interpret the data you present.
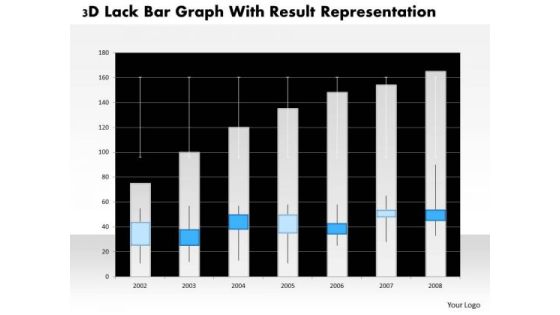
Business Diagram 3d Lack Bar Graph With Result Representation PowerPoint Slide
This business diagram has graphic of 3d lack bar graph. This diagram is a data visualization tool that gives you a simple way to present statistical information. This slide helps your audience examine and interpret the data you present.
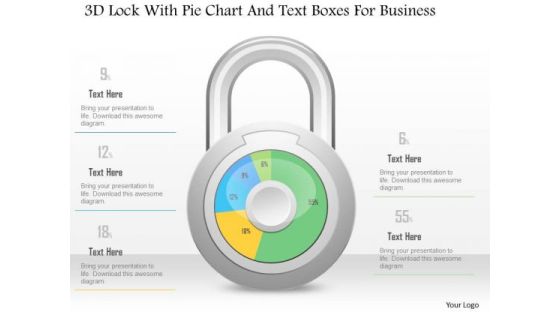
Business Diagram 3d Lock With Pie Chart And Text Boxes For Business PowerPoint Slide
This Power Point diagram has been crafted with pie chart in shape of lock. It contains diagram of lock pie chart to compare and present data in an effective manner. Use this diagram to build professional presentations for your viewers.

Business Diagram 3d Lock With Pie Graph For Result Representation PowerPoint Slide
This Power Point diagram has been crafted with pie chart in shape of lock. It contains diagram of lock pie chart to compare and present data in an effective manner. Use this diagram to build professional presentations for your viewers.

Business Diagram 3d Pencil With Text Boxes For Representation PowerPoint Slide
This Power Point diagram displays graphic of pencil with icons and text spaces. It contains diagram of colorful pencil for data display. Use this diagram to build professional presentations for your viewers.
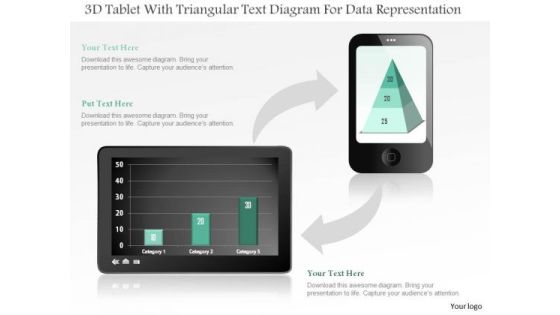
Business Diagram 3d Tablet With Triangular Text Diagram For Data Representation PowerPoint Slide
This business diagram displays bar graph on tablet and pyramid chart on mobile phone. Use this diagram, to make reports for interactive business presentations. Create professional presentations using this diagram.

Business Diagram 3d Thumb Chart And Tablet For Data Representation PowerPoint Slide
This business diagram displays graphic of 3d thumb up chart with icons on computer screen. This business slide contains the concept of business data representation. Use this diagram to build professional presentations for your viewers.
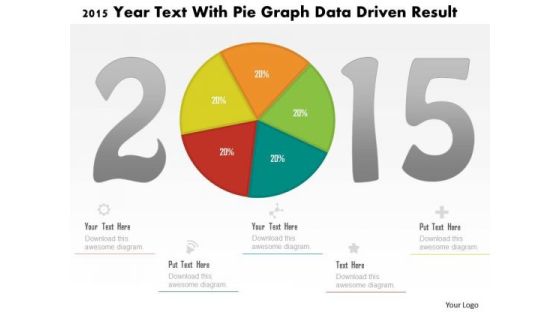
Business Diagram 2015 Year Text With Pie Graph Data Driven Result PowerPoint Slide
This business diagram displays 2015 year numbers with pie chart. This diagram is suitable to display business strategy for year 2015. Download this professional slide to present information in an attractive manner

Business Diagram Battery Connected With Bulb For Idea Generation PowerPoint Slide
This business slide displays battery icon connected with bulb. This diagram is a data visualization tool that gives you a simple way to present statistical information. This slide helps your audience examine and interpret the data you present.
Business Diagram Battery Icon With Power Icons Energy Technology PowerPoint Slide
This business diagram displays battery icon with power charging. Use this diagram, in your presentations to display energy saving, battery and technology. Create professional presentations using this diagram slide.
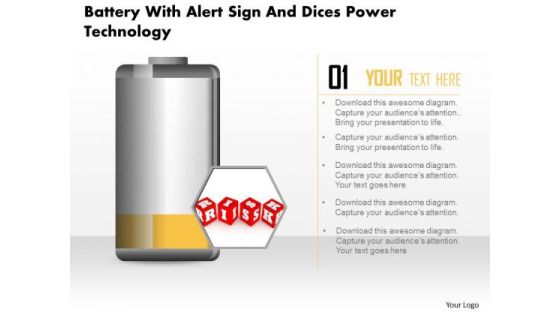
Business Diagram Battery With Alert Sign And Dices Power Technology PowerPoint Slide
This business diagram displays risk alert on battery icon. Use this diagram, in your presentations to display energy saving, battery and technology. Create professional presentations using this diagram slide.
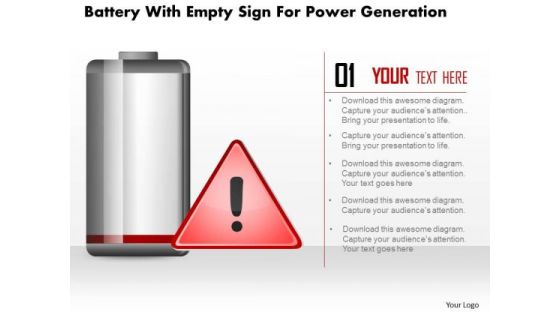
Business Diagram Battery With Empty Sign For Power Generation PowerPoint Slide
This business diagram displays empty sign alert on battery icon. Use this diagram, in your presentations to display energy saving, battery and technology. Create professional presentations using this diagram slide.

Business Diagram Data Driven Pie Chart Inside The Magnifier PowerPoint Slide
This business slide displays 3d colorful pie graph with magnifier. This diagram is a data visualization tool that gives you a simple way to present statistical information. This slide helps your audience examine and interpret the data you present.
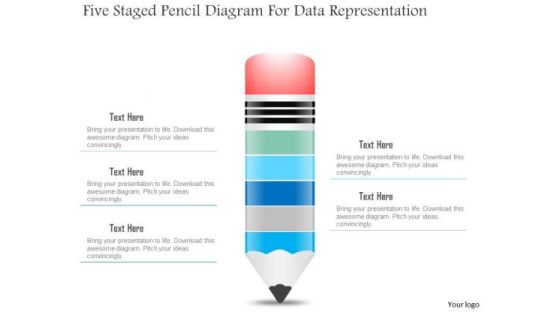
Business Diagram Five Staged Pencil Diagram For Data Representation PowerPoint Slide
This business slide displays five staged pencil diagram. It contains pencil graphic divided into five parts. This diagram slide depicts processes, stages, steps, points, options and education information display. Use this diagram, in your presentations to express your views innovatively.

Business Diagram Five Staged Timeline Diagram For Business PowerPoint Slide
This PowerPoint template displays five points timeline diagram. This business diagram has been designed with graphic of timeline with five points, text space and start, end points. Use this diagram, in your presentations to display process steps, stages, timelines and business management. Make wonderful presentations using this business slide.
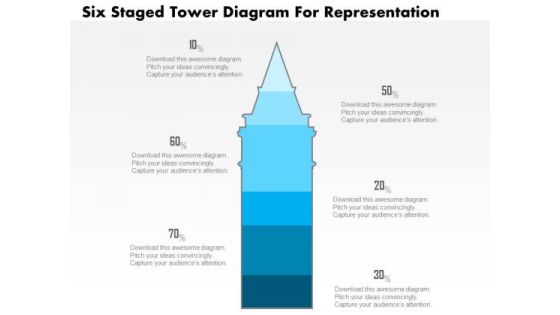
Business Diagram Five Staged Tower Diagram For Representation PowerPoint Slide
This business slide displays five staged tower diagram. It contains blue tower graphic divided into five parts. This diagram slide depicts processes, stages, steps, points, options information display. Use this diagram, in your presentations to express your views innovatively.
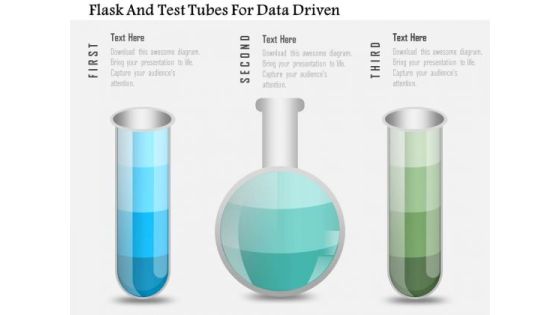
Business Diagram Flask And Test Tubes For Data Driven PowerPoint Slide
This data driven diagram has been designed with flask and test tubes. Download this diagram to give your presentations more effective look. It helps in clearly conveying your message to clients and audience.

Business Diagram Flask With Data Driven Chart PowerPoint Slide
This data driven diagram has been designed with flask graphics. Download this diagram to give your presentations more effective look. It helps in clearly conveying your message to clients and audience.
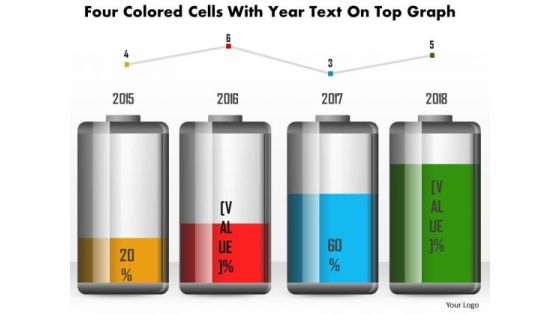
Business Diagram Four Colored Cells With Year Text On Top Graph PowerPoint Slide
This business diagram has been designed with battery cell graphic for business timeline. This slide can be used for business planning and management. Use this diagram for your business and success milestones related presentations.
Business Diagram Green Battery Cell With Full Charging Symbol PowerPoint Slide
This business diagram displays full battery charge icon. Use this diagram, in your presentations to display energy saving, battery and technology. Create professional presentations using this diagram slide.
Business Diagram Hour Glass With 3d Man And Icons PowerPoint Slide
This diagram displays 3d man with hour glass and icons. This diagram contains concept of communication and technology. Use this diagram to display business process workflows in any presentations.
Business Diagram Human Icons With Bubbles And Different Icons Inside PowerPoint Slide
This diagram displays graph with percentage value growth. This business slide is suitable to present and compare business data. Use this diagram to build professional presentations for your viewers.

Business Diagram Human Mind Diagram With Pie Graph For Representation PowerPoint Slide
This diagram displays human face graphic divided into sections. This section can be used for data display. Use this diagram to build professional presentations for your viewers.

Business Diagram Laptop With Data Driven Area Chart PowerPoint Slide
This diagram has been designed with laptop and data driven area chart. Download this diagram to give your presentations more effective look. It helps in clearly conveying your message to clients and audience.
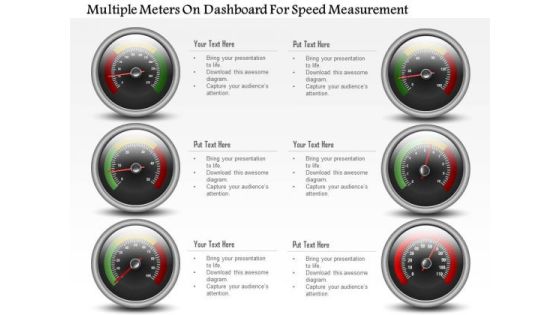
Business Diagram Multiple Meters On Dashboard For Speed Measurement PowerPoint Slide
This business diagram has been designed with multiple meters on dashboard. This slide can be used for business planning and progress. Use this diagram for your business and success milestones related presentations.

Business Diagram Six Staged Pie Charts For Text Representation PowerPoint Slide
This slide displays graphic six staged pie charts. Download this diagram to present and compare business data. Use this diagram to display business process workflows in any presentation.
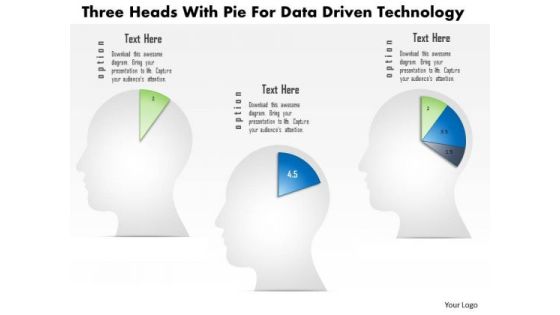
Business Diagram Three Heads With Pie For Data Driven Technology PowerPoint Slide
This business diagram displays three human faces with pie charts. This Power Point template has been designed to compare and present business data. You may use this diagram to impart professional appearance to your presentations.

Business Diagram Three Staged Pencil Diagram For Graph Formation PowerPoint Slide
This business diagram displays set of pencils. This Power Point template has been designed to compare and present business data. Download this diagram to represent stages of business growth.

Business Diagram Four Steps With 3d Business Person Standing Over It PowerPoint Slide
This business diagram displays bar graph with business person standing on it. This Power Point template has been designed to display personal growth. You may use this diagram to impart professional appearance to your presentations.
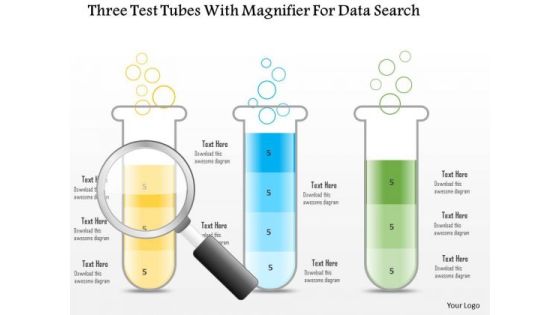
Business Diagram Three Test Tubes With Magnifier For Data Search PowerPoint Slide
This business diagram displays three test tubes with magnifying glass. This diagram is suitable to depict flow of business activities or steps. Download this professional slide to present information in an attractive manner.
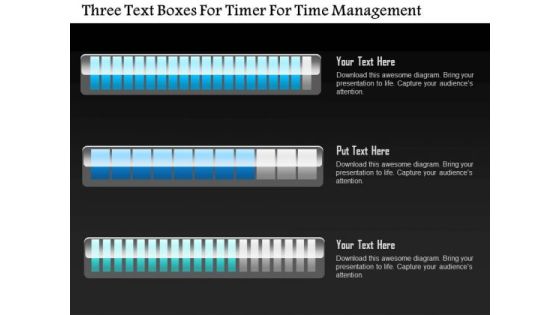
Business Diagram Three Text Boxes For Timer For Time Management PowerPoint Slide
This business diagram displays three text boxes. This diagram contains text boxes for data representation. Use this diagram to display business process workflows in any presentations.

Business Diagram Three Trucks For Data Representation For Business PowerPoint Slide
This business diagram displays three trucks graphic. This diagram contains trucks for percentage value growth. Use this diagram to display business growth over a period of time.

Business Diagram Two Tablets With Growth Bar Graph Data Driven PowerPoint Slide
This business diagram has been designed with comparative charts on tablets. This slide suitable for data representation. You can also use this slide to present business reports and information. Use this diagram to present your views in a wonderful manner.

IT Alignment For Strategic Plan Do Check Act Cycle For Implementing Change Pictures PDF
This slide depicts the plan-do-check-act cycle for implementing business IT alignment in the organizations. It will help to make small changes, implement them, test them and review them in the organization. There are so many reasons you need a IT Alignment For Strategic Plan Do Check Act Cycle For Implementing Change Pictures PDF. The first reason is you can not spend time making everything from scratch, Thus, Slidegeeks has made presentation templates for you too. You can easily download these templates from our website easily.

Levels Of Data Center Commissioning And Testing Process Ppt Layouts Format PDF
The slide showcases the various levels of commissioning and outlines the process and sequence for commissioning. It covers five levels like factory witness testing, receipt installation and post-installation checks, functional component testing, functional system testing and integrated system testing. Persuade your audience using this Levels Of Data Center Commissioning And Testing Process Ppt Layouts Format PDF. This PPT design covers five stages, thus making it a great tool to use. It also caters to a variety of topics including Factory Witness Testing, Receipt Installation, Post Installation Testing. Download this PPT design now to present a convincing pitch that not only emphasizes the topic but also showcases your presentation skills.
RUP Model Rational Unified Process Model Disciplinary Testing Goals Ppt Icon Portfolio PDF
This slide describes the Rational Unified Process Model disciplinary testing goals, including checking interaction between objects, verifying software components, etc. This is a rup model rational unified process model disciplinary testing goals ppt icon portfolio pdf template with various stages. Focus and dispense information on eight stages using this creative set, that comes with editable features. It contains large content boxes to add your information on topics like rational unified process model disciplinary testing goals. You can also showcase facts, figures, and other relevant content using this PPT layout. Grab it now.

Review Of Demographic Requirements Example Of Diagram Presentation
This is a review of demographic requirements example of diagram presentation. This is a eight stage process. The stages in this process are monitor survey process, review of demographic requirements, creation of project plan, creation of test survey, survey process project management, needs analysis, communication plan.

One Page DISC Assessment Questionnaire To Relieve Stress PDF Document PPT Template
Looking for a predesigned One Page DISC Assessment Questionnaire To Relieve Stress PDF Document PPT Template Heres the perfect piece for you It has everything that a well-structured one-pager template should have. Besides, it is 100 percent editable, which offers you the cushion to make adjustments according to your preferences. Grab this One Page DISC Assessment Questionnaire To Relieve Stress PDF Document PPT Template Download now.
 Home
Home
