AI PPT Maker
Templates
PPT Bundles
Design Services
Business PPTs
Business Plan
Management
Strategy
Introduction PPT
Roadmap
Self Introduction
Timelines
Process
Marketing
Agenda
Technology
Medical
Startup Business Plan
Cyber Security
Dashboards
SWOT
Proposals
Education
Pitch Deck
Digital Marketing
KPIs
Project Management
Product Management
Artificial Intelligence
Target Market
Communication
Supply Chain
Google Slides
Research Services
 One Pagers
All Categories
-
Home
- Customer Favorites
- Quality Dashboard
Quality Dashboard
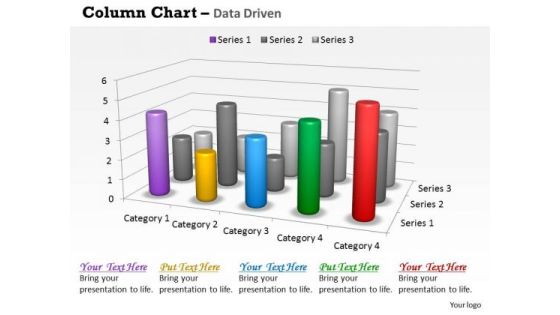
Data Analysis In Excel 3d Survey For Sales Chart PowerPoint Templates
Good Camaraderie Is A Key To Teamwork. Our data analysis in excel 3d survey for sales chart Powerpoint Templates Can Be A Cementing Force.
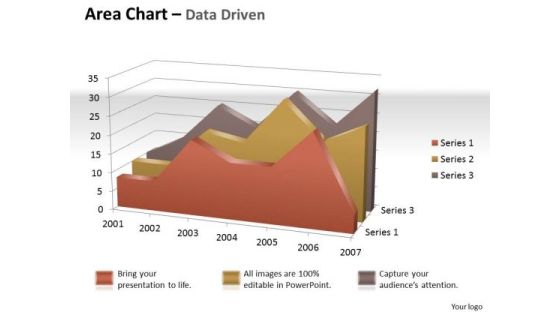
Data Analysis In Excel 3d Visual Display Of Area Chart PowerPoint Templates
Brace Yourself, Arm Your Thoughts. Prepare For The Hustle With Our data analysis in excel 3d visual display of area chart Powerpoint Templates .

Data Analysis In Excel Area Chart For Business Process PowerPoint Templates
Your Grasp Of Economics Is Well Known. Help Your Audience Comprehend Issues With Our data analysis in excel area chart for business process Powerpoint Templates .

Data Analysis In Excel Column Chart For Business Project PowerPoint Templates
Edit Your Work With Our data analysis in excel column chart for business project Powerpoint Templates . They Will Help You Give The Final Form.

Data Analysis In Excel Column Chart Of Various Fields PowerPoint Templates
Land The Idea With Our data analysis in excel column chart of various fields Powerpoint Templates . Help It Grow With Your Thoughts.
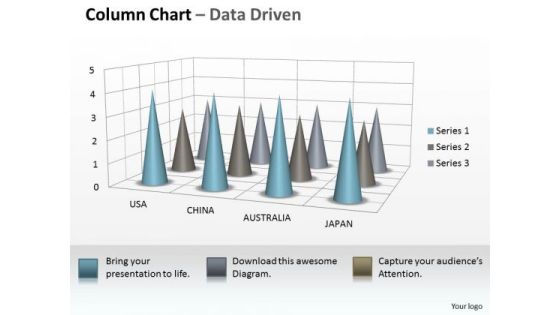
Data Analysis On Excel 3d Chart To Incorporate Business Information PowerPoint Templates
Our data analysis on excel 3d chart to incorporate business information Powerpoint Templates Allow You To Do It With Ease. Just Like Picking The Low Hanging Fruit.

Data Analysis On Excel 3d Chart To Monitor Business Process PowerPoint Templates
Make Some Dough With Our data analysis on excel 3d chart to monitor business process Powerpoint Templates . Your Assets Will Rise Significantly.
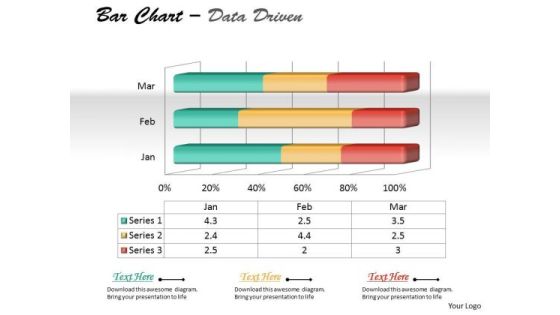
Data Analysis On Excel 3d Chart To Represent Quantitative Differences PowerPoint Templates
Draft It Out On Our data analysis on excel 3d chart to represent quantitative differences Powerpoint Templates . Give The Final Touches With Your Ideas.

Data Analysis On Excel 3d Chart With Sets Of PowerPoint Templates
Reduce The Drag With Our data analysis on excel 3d chart with sets of Powerpoint Templates . Give More Lift To Your Thoughts.
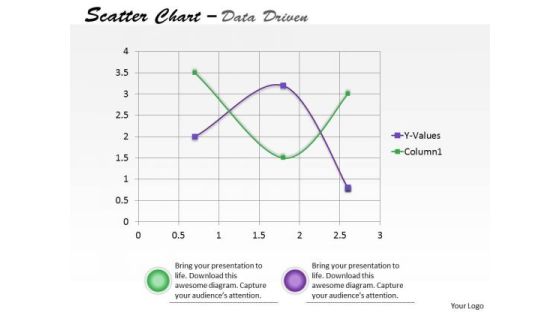
Data Analysis On Excel Driven Scatter Chart To Predict Future Movements PowerPoint Slides Templates
Our data analysis on excel driven scatter chart to predict future movements powerpoint slides Templates Enjoy Drama. They Provide Entertaining Backdrops.

Data Analysis On Excel Driven Sets Of Business Information PowerPoint Slides Templates
Break The Deadlock With Our data analysis on excel driven sets of business information powerpoint slides Templates . Let The Words Start To Flow.

Data Analysis On Excel Driven Stacked Area Chart PowerPoint Slides Templates
Be The Dramatist With Our data analysis on excel driven stacked area chart powerpoint slides Templates . Script Out The Play Of Words.

Data Analysis On Excel Driven Stock Chart For Business Growth PowerPoint Slides Templates
Add Some Dramatization To Your Thoughts. Our data analysis on excel driven stock chart for business growth powerpoint slides Templates Make Useful Props.
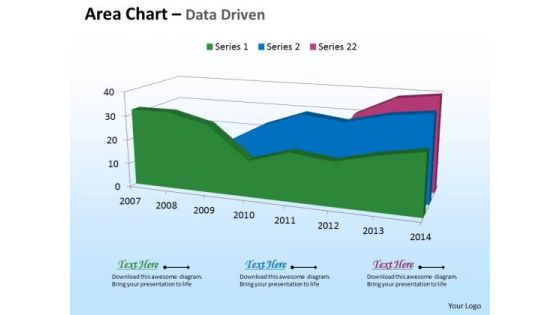
Microsoft Excel Data Analysis 3d Area Chart For Time Based PowerPoint Templates
Deliver The Right Dose With Our microsoft excel data analysis 3d area chart for time based Powerpoint Templates . Your Ideas Will Get The Correct Illumination.
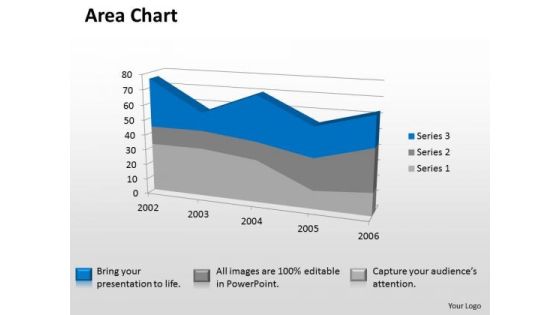
Microsoft Excel Data Analysis 3d Area Chart Showimg Change In Values PowerPoint Templates
Our microsoft excel data analysis 3d area chart showimg change in values Powerpoint Templates Deliver At Your Doorstep. Let Them In For A Wonderful Experience.
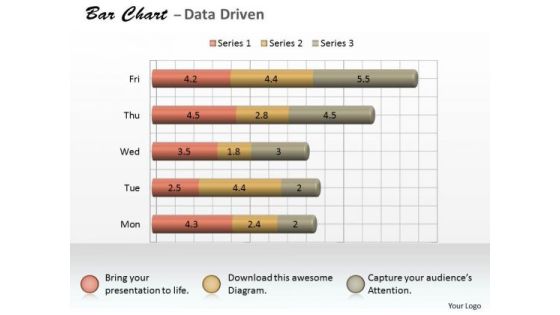
Microsoft Excel Data Analysis 3d Bar Chart As Research Tool PowerPoint Templates
Knock On The Door To Success With Our microsoft excel data analysis 3d bar chart as research tool Powerpoint Templates . Be Assured Of Gaining Entry.
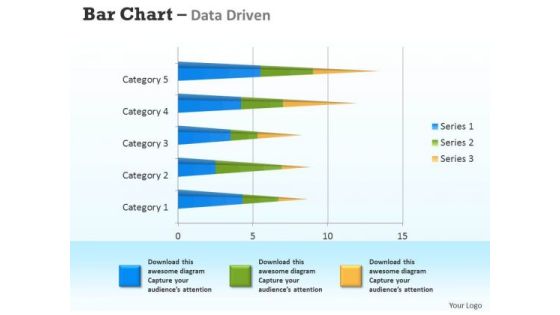
Microsoft Excel Data Analysis 3d Bar Chart For Analyzing Survey PowerPoint Templates
Connect The Dots With Our microsoft excel data analysis 3d bar chart for analyzing survey Powerpoint Templates . Watch The Whole Picture Clearly Emerge.

Microsoft Excel Data Analysis 3d Change In Business Process Chart PowerPoint Templates
Double Your Chances With Our microsoft excel data analysis 3d change in business process chart Powerpoint Templates . The Value Of Your Thoughts Will Increase Two-Fold.

Microsoft Excel Data Analysis 3d Chart For Business Observation PowerPoint Templates
Double Up Our microsoft excel data analysis 3d chart for business observation Powerpoint Templates With Your Thoughts. They Will Make An Awesome Pair.
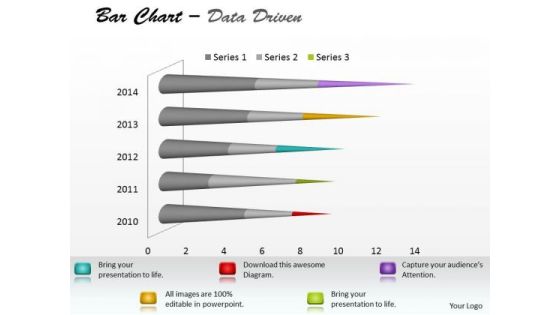
Microsoft Excel Data Analysis Bar Chart To Communicate Information PowerPoint Templates
With Our microsoft excel data analysis bar chart to communicate information Powerpoint Templates You Will Be Doubly Sure. They Possess That Stamp Of Authority.

Microsoft Excel Data Analysis Bar Chart To Compare Quantities PowerPoint Templates
Our microsoft excel data analysis bar chart to compare quantities Powerpoint Templates Leave No One In Doubt. Provide A Certainty To Your Views.

Data Analysis On Excel 3d Chart Shows Interrelated Sets Of PowerPoint Templates
Put Them On The Same Page With Our data analysis on excel 3d chart shows interrelated sets of Powerpoint Templates . Your Team Will Sing From The Same Sheet.

Information Science Tasks And Skills Of Data And Analytics Manager Ppt PowerPoint Presentation Model Grid PDF
This slide depicts the tasks performed by a data and analytics manager and skills he should have, such as leadership and project management qualities, interpersonal communication skills, and so on.Deliver an awe inspiring pitch with this creative Information Science Tasks And Skills Of Data And Analytics Manager Ppt PowerPoint Presentation Model Grid PDF bundle. Topics like Manage Team, Data Scientists, Providing Them can be discussed with this completely editable template. It is available for immediate download depending on the needs and requirements of the user.

Illustration Of 6 Stages In Sequential Manner Chart Circular Diagram PowerPoint Templates
We present our illustration of 6 stages in sequential manner chart Circular Diagram PowerPoint templates.Download our Process and Flows PowerPoint Templates because knowledge is power goes the popular saying. Use our Marketing PowerPoint Templates because customer satisfaction is a mantra of the marketplace. Building a loyal client base is an essential element of your business. Use our Business PowerPoint Templates because you have had your share of being a goldfish in a small bowl.you are ready to launch out and spread your wings. Present our Circle Charts PowerPoint Templates because this graphics helps you to prove how they mesh to motivate the company team and provide the steam to activate the composite machine. Download our Future PowerPoint Templates because others respect the intrinsic value of your words.Use these PowerPoint slides for presentations relating to Business, chart, circle,colors, concept, corporate, cycle, data,design, detail, development, diagram,engineering, graphic, ideas, illustration,image, implement, implementation, life,lifecycle, management, model, objects,organization, phase, plan, process,product, professional, project, quality,schema, shape, software, stack, stage,steps, strategy, structure, success. The prominent colors used in the PowerPoint template are Pink, White, Black. Customers tell us our illustration of 6 stages in sequential manner chart Circular Diagram PowerPoint templates are Zippy. Customers tell us our concept PowerPoint templates and PPT Slides are Striking. Customers tell us our illustration of 6 stages in sequential manner chart Circular Diagram PowerPoint templates are Detailed. People tell us our cycle PowerPoint templates and PPT Slides are Nifty. Customers tell us our illustration of 6 stages in sequential manner chart Circular Diagram PowerPoint templates are Upbeat. Customers tell us our data PowerPoint templates and PPT Slides are incredible easy to use.

Using Data Science Technologies For Business Transformation Tasks And Skills Of Data And Analytics Manager Brochure PDF
This slide depicts the tasks performed by a data and analytics manager and skills he should have, such as leadership and project management qualities, interpersonal communication skills, and so on. Are you in need of a template that can accommodate all of your creative concepts This one is crafted professionally and can be altered to fit any style. Use it with Google Slides or PowerPoint. Include striking photographs, symbols, depictions, and other visuals. Fill, move around, or remove text boxes as desired. Test out color palettes and font mixtures. Edit and save your work, or work with colleagues. Download Using Data Science Technologies For Business Transformation Tasks And Skills Of Data And Analytics Manager Brochure PDF and observe how to make your presentation outstanding. Give an impeccable presentation to your group and make your presentation unforgettable.

9 Steps Diverging And Converging Relative Circular Flow Arrow Network PowerPoint Templates
We present our 9 steps diverging and converging Relative Circular Flow Arrow Network PowerPoint templates.Use our Ring Charts PowerPoint Templates because with the help of our Slides you can Illustrate these thoughts with this slide. Present our Shapes PowerPoint Templates because you are ready to flap your wings and launch off. All poised are you to touch the sky with glory. Use our Circle Charts PowerPoint Templates because it unravels the process layer by layer and exposes their relevance to the core issue. Use our Business PowerPoint Templates because spell out your advertising plans to increase market share. The feedback has been positive and productive. Use our Process and Flows PowerPoint Templates because this slide helps you to communicate your concerns and educate your team along the path to success.Use these PowerPoint slides for presentations relating to Business, chart, circle, colors, concept, corporate, cycle, data, design, detail, development, diagram, engineering, graphic, ideas, illustration, image, implement, implementation, life, lifecycle, management, model, objects, organization, plan, process, product, professional, project, quality, schema, shape, stack, stage, steps, strategy, structure, success, symbol. The prominent colors used in the PowerPoint template are Orange, Black, Gray. You can be sure our 9 steps diverging and converging Relative Circular Flow Arrow Network PowerPoint templates are Nice. Presenters tell us our data PowerPoint templates and PPT Slides are Tranquil. We assure you our 9 steps diverging and converging Relative Circular Flow Arrow Network PowerPoint templates are Efficacious. Customers tell us our data PowerPoint templates and PPT Slides are One-of-a-kind. Presenters tell us our 9 steps diverging and converging Relative Circular Flow Arrow Network PowerPoint templates are One-of-a-kind. You can be sure our cycle PowerPoint templates and PPT Slides are Stylish.

Business PowerPoint Templates Download Process Ppt Circular Flow Network Slides
We present our business powerpoint templates download process ppt Circular Flow Network Slides.Present our Marketing PowerPoint Templates because customer satisfaction is a mantra of the marketplace. Building a loyal client base is an essential element of your business. Download and present our Business PowerPoint Templates because you are ready to flap your wings and launch off. All poised are you to touch the sky with glory. Download our Arrows PowerPoint Templates because one pushes the other till it all comes back full circle. Present our Shapes PowerPoint Templates because they have fired the dreams of many fertile minds. Present our Process and Flows PowerPoint Templates because this graphics helps you to prove how they mesh to motivate the company team and provide the steam to activate the composite machine.Use these PowerPoint slides for presentations relating to Business, Chart, Circle, Colors, Concept, Corporate, Cycle, Data, Design, Detail, Development, Diagram, Engineering, Graphic, Ideas, Illustration, Image, Implement, Implementation, Life, Lifecycle, Management, Model, Objects, Organization, Phase, Plan, Process, Product, Professional, Project, Quality, Schema, Shape. The prominent colors used in the PowerPoint template are Green, Gray, Black. Customers tell us our business powerpoint templates download process ppt Circular Flow Network Slides help you meet deadlines which are an element of today's workplace. Just browse and pick the slides that appeal to your intuitive senses. Customers tell us our Colors PowerPoint templates and PPT Slides are No-nonsense. Presenters tell us our business powerpoint templates download process ppt Circular Flow Network Slides are Cheerful. PowerPoint presentation experts tell us our Cycle PowerPoint templates and PPT Slides are Efficacious. Customers tell us our business powerpoint templates download process ppt Circular Flow Network Slides are visually appealing. Professionals tell us our Concept PowerPoint templates and PPT Slides are Stunning.
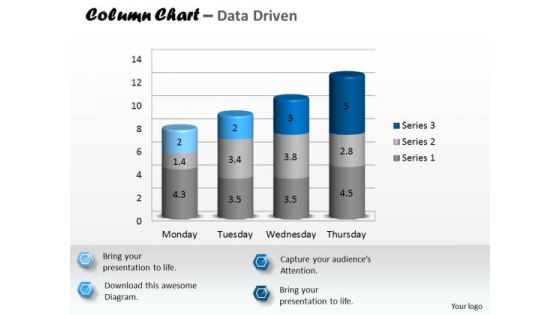
Data Analysis In Excel 3d Column Chart To Represent Information PowerPoint Templates
Rake In The Dough With

10 Diverging Stages Planning Process Diagram Radial Network PowerPoint Templates
We present our 10 diverging stages planning process diagram Radial Network PowerPoint templates.Download and present our Arrows PowerPoint Templates because you can Organize your thoughts and illuminate your ideas accordingly. Use our Flow charts PowerPoint Templates because your business and plans for its growth consist of processes that are highly co-related. Download and present our Business PowerPoint Templates because your product has established a foothold in the market. Customers are happy with the value it brings to their lives. Download and present our Process and Flows PowerPoint Templates because you have what it takes to grow. Use our Circle charts PowerPoint Templates because this diagram provides trainers a tool to teach the procedure in a highly visual, engaging way.Use these PowerPoint slides for presentations relating to Business, chart, circle, colors, concept, corporate, cycle, data, design, detail, development, diagram, engineering, graphic, ideas, illustration, image, implement, implementation, life, lifecycle, management, model, objects, organization, plan, process, product, professional, project, quality, schema, shape, stack, stage, steps, strategy, structure, success, symbol. The prominent colors used in the PowerPoint template are Green lime, Black, White. You can be sure our 10 diverging stages planning process diagram Radial Network PowerPoint templates are Pleasant. Presenters tell us our concept PowerPoint templates and PPT Slides are visually appealing. We assure you our 10 diverging stages planning process diagram Radial Network PowerPoint templates are Magnificent. Customers tell us our corporate PowerPoint templates and PPT Slides are Magical. Presenters tell us our 10 diverging stages planning process diagram Radial Network PowerPoint templates provide you with a vast range of viable options. Select the appropriate ones and just fill in your text. You can be sure our concept PowerPoint templates and PPT Slides look good visually.
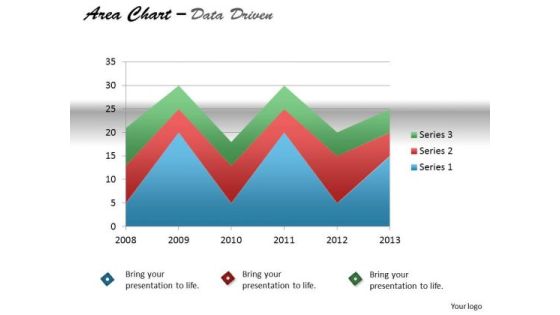
Quantitative Data Analysis Driven Display Series With Area Chart PowerPoint Slides Templates
Our quantitative data analysis driven display series with area chart powerpoint slides Templates Enjoy Drama. They Provide Entertaining Backdrops.
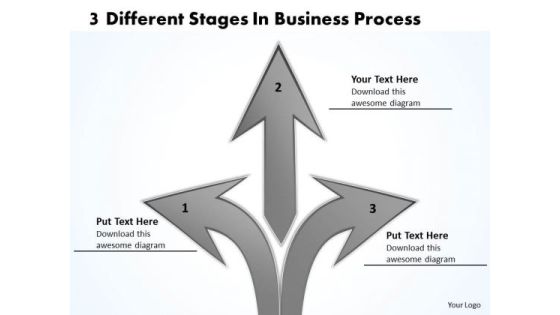
Business PowerPoint Templates Download Process Circular Flow Network Slides
We present our business powerpoint templates download process Circular Flow Network Slides.Download and present our Globe PowerPoint Templates because You can Be the puppeteer with our PowerPoint Templates and Slides as your strings. Lead your team through the steps of your script. Download and present our Ring Charts PowerPoint Templates because You can Inspire your team with our PowerPoint Templates and Slides. Let the force of your ideas flow into their minds. Download our Circle Charts PowerPoint Templates because this Layout can explain the relevance of the different layers and stages in getting down to your core competence, ability and desired result. Use our Arrows PowerPoint Templates because it shows various choices to be made. Use our Business PowerPoint Templates because you have secured a name for yourself in the domestic market. Now the time is right to spread your reach to other countries.Use these PowerPoint slides for presentations relating to Business, chart, circle,colors, concept, corporate, cycle, data,design, detail, development, diagram,engineering, graphic, ideas, illustration,image, implement, implementation, life,lifecycle, management, model, objects,organization, phase, plan, process,product, professional, project, quality,schema, shape. The prominent colors used in the PowerPoint template are Blue, Yellow, White. You can be sure our business powerpoint templates download process Circular Flow Network Slides will make you look like a winner. PowerPoint presentation experts tell us our circle PowerPoint templates and PPT Slides are designed by professionals Professionals tell us our business powerpoint templates download process Circular Flow Network Slides are Graceful. Presenters tell us our data PowerPoint templates and PPT Slides are the best it can get when it comes to presenting. Professionals tell us our business powerpoint templates download process Circular Flow Network Slides are Whimsical. Customers tell us our corporate PowerPoint templates and PPT Slides are Beautiful.
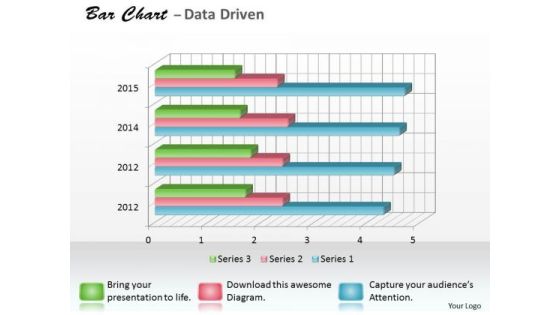
Data Analysis Programs 3d Bar Chart For Research In Statistics PowerPoint Templates
Draw It Out On Our data analysis programs 3d bar chart for research in statistics Powerpoint Templates . Provide Inspiration To Your Colleagues.
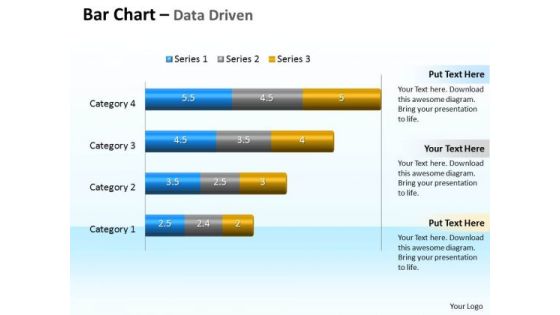
Data Analysis Programs 3d Bar Chart To Compare Categories PowerPoint Templates
Discover Decisive Moments With Our data analysis programs 3d bar chart to compare categories Powerpoint Templates . They Help Make That Crucial Difference.
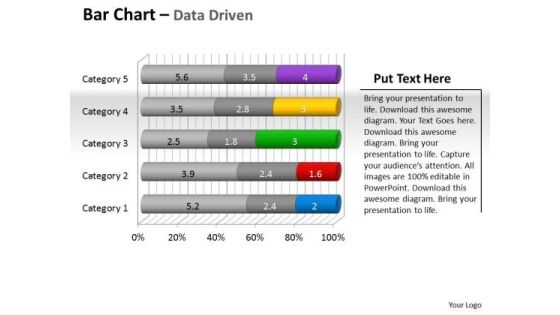
Data Analysis Programs 3d Bar Chart To Put Information PowerPoint Templates
Draw Up Your Agenda On Our data analysis programs 3d bar chart to put information Powerpoint Templates . Coax Your Audience Into Acceptance.
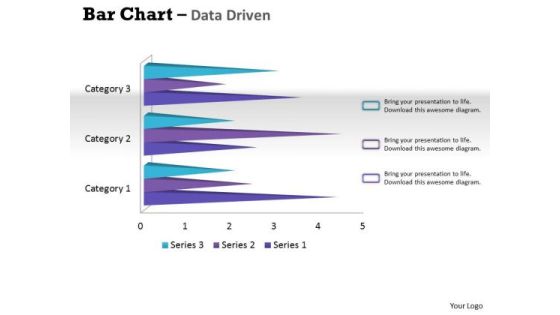
Data Analysis Techniques 3d Bar Chart For Financial Solutions PowerPoint Templates
Make Your Dreams A Reality With Our data analysis techniques 3d bar chart for financial solutions Powerpoint Templates . Your Ideas Will Begin To Take Shape.
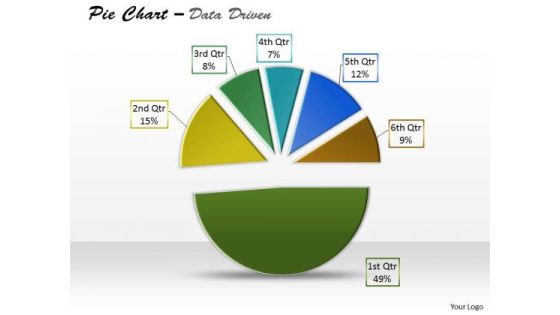
Data Analysis Template Driven Express Business Facts Pie Chart PowerPoint Slides Templates
Display Your Drive On Our data analysis template driven express business facts pie chart powerpoint slides Templates . Invigorate The Audience With Your Fervor.

Data Analysis Template Driven Ineract With Stock Chart PowerPoint Slides Templates
Drive Your Passion With Our data analysis template driven ineract with stock chart powerpoint slides Templates . Steer Yourself To Achieve Your Aims.

Data Analysis Template Driven Line Chart Business Graph PowerPoint Slides Templates
Bottle Your Thoughts In Our data analysis template driven line chart business graph powerpoint slides Templates . Pass It Around For Your Audience To Sip.
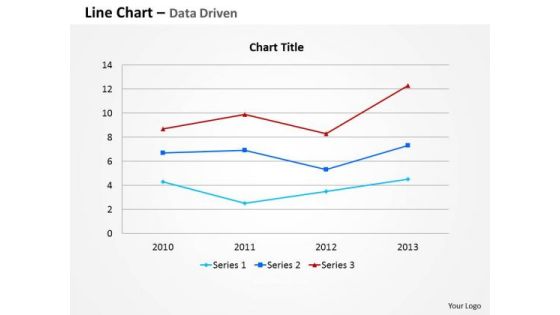
Data Analysis Template Driven Line Chart For Business Information PowerPoint Slides Templates
Your Thoughts Are Dripping With Wisdom. Lace It With Our data analysis template driven line chart for business information powerpoint slides Templates .
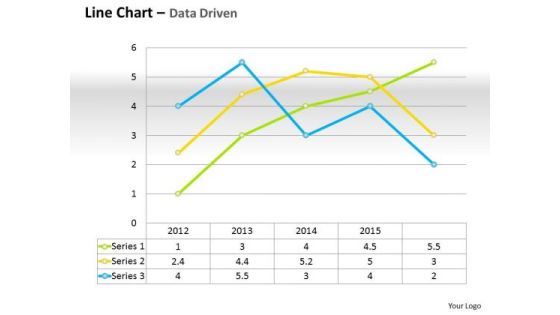
Data Analysis Template Driven Line Chart For Business Performance PowerPoint Slides Templates
Do Not Allow Things To Drift. Ring In Changes With Our data analysis template driven line chart for business performance powerpoint slides Templates .
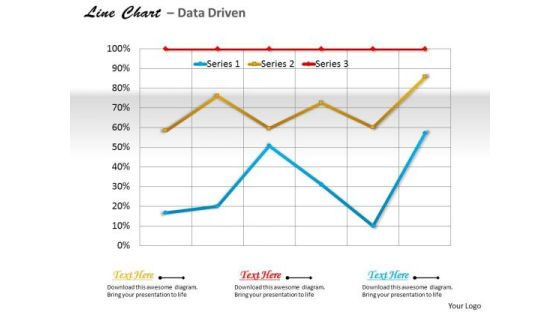
Data Analysis Template Driven Line Chart For Business Trends PowerPoint Slides Templates
Use Our data analysis template driven line chart for business trends powerpoint slides Templates As The Bit. Drill Your Thoughts Into Their Minds.
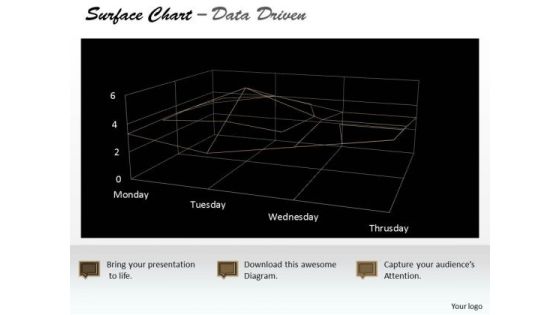
Data Analysis Template Driven Surface Chart Indicating Areas PowerPoint Slides Templates
Highlight Your Drive With Our data analysis template driven surface chart indicating areas powerpoint slides Templates . Prove The Fact That You Have Control.
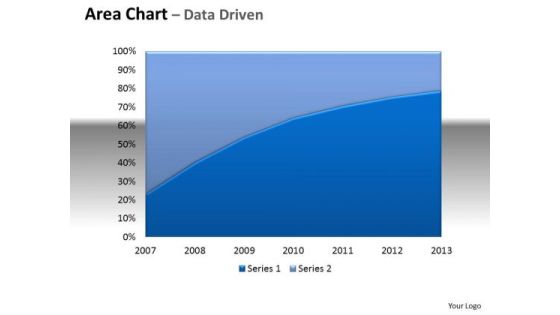
Financial Data Analysis Area Chart With Plotted Line Center PowerPoint Templates
Be The Doer With Our financial data analysis area chart with plotted line center Powerpoint Templates . Put Your Thoughts Into Practice.
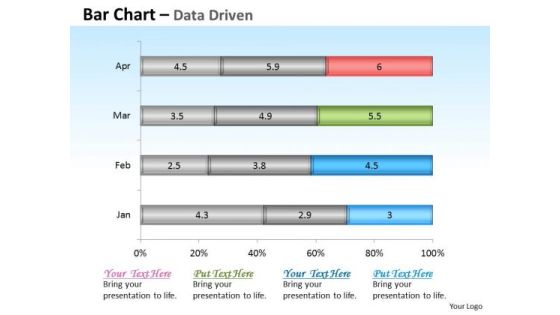
Financial Data Analysis Driven Base Bar Chart Design PowerPoint Slides Templates
Get The Domestics Right With Our financial data analysis driven base bar chart design powerpoint slides Templates . Create The Base For Thoughts To Grow.
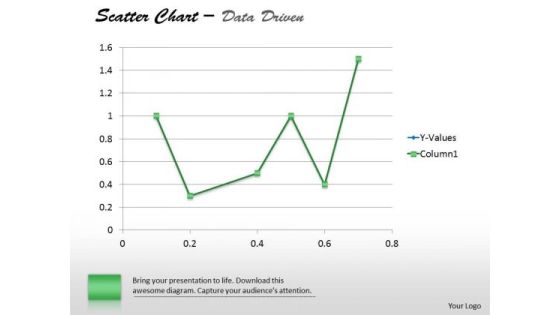
Financial Data Analysis Driven Demonstrate Statistics With Scatter Chart PowerPoint Slides Templates
Establish The Dominance Of Your Ideas. Our financial data analysis driven demonstrate statistics with scatter chart powerpoint slides Templates Will Put Them On Top.
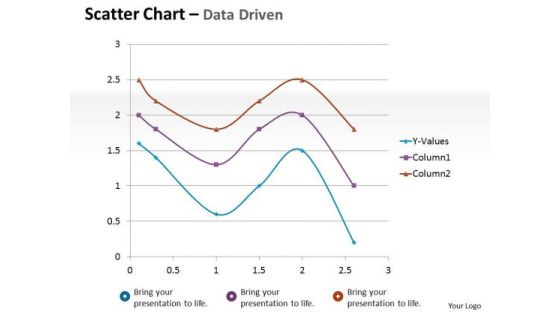
Financial Data Analysis Driven Scatter Chart Mathematical Diagram PowerPoint Slides Templates
Dominate Proceedings With Your Ideas. Our financial data analysis driven scatter chart mathematical diagram powerpoint slides Templates Will Empower Your Thoughts.
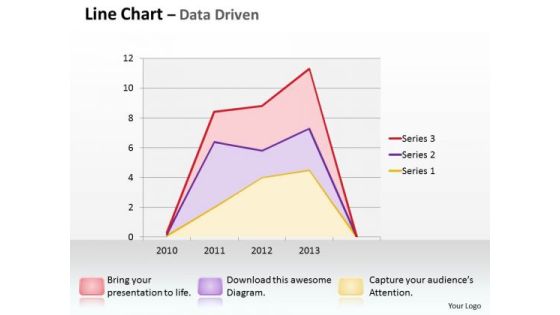
Multivariate Data Analysis Driven Line Chart Shows Revenue Trends PowerPoint Slides Templates
Good Camaraderie Is A Key To Teamwork. Our multivariate data analysis driven line chart shows revenue trends powerpoint slides Templates Can Be A Cementing Force.
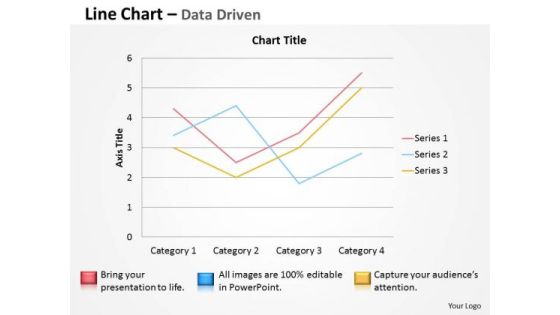
Multivariate Data Analysis Driven Line Chart To Demonstrate PowerPoint Slides Templates
Brace Yourself, Arm Your Thoughts. Prepare For The Hustle With Our multivariate data analysis driven line chart to demonstrate powerpoint slides Templates .
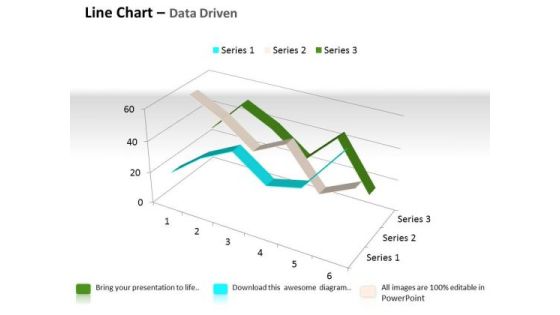
Quantitative Data Analysis 3d Line Chart For Comparison Of PowerPoint Templates
Touch Base With Our quantitative data analysis 3d line chart for comparison of Powerpoint Templates . Review Your Growth With Your Audience.

Quantitative Data Analysis 3d Pie Chart For Business Process PowerPoint Templates
Put Them On The Same Page With Our quantitative data analysis 3d pie chart for business process Powerpoint Templates . Your Team Will Sing From The Same Sheet.
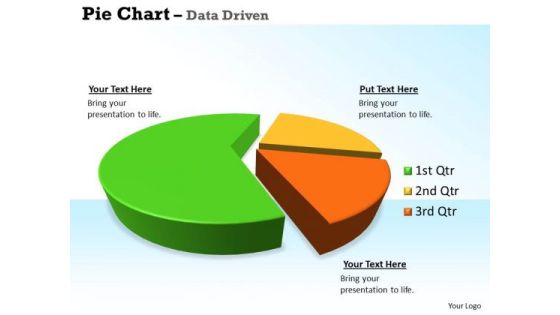
Quantitative Data Analysis 3d Pie Chart For Business Statistics PowerPoint Templates
Our quantitative data analysis 3d pie chart for business statistics Powerpoint Templates Allow You To Do It With Ease. Just Like Picking The Low Hanging Fruit.

Quantitative Data Analysis Driven Economic Status Line Chart PowerPoint Slides Templates
Be The Dramatist With Our quantitative data analysis driven economic status line chart powerpoint slides Templates . Script Out The Play Of Words.

Quantitative Data Analysis Driven Economic With Column Chart PowerPoint Slides Templates
Add Some Dramatization To Your Thoughts. Our quantitative data analysis driven economic with column chart powerpoint slides Templates Make Useful Props.

Customer 360 Overview Training Required For Marketing Strategies Ppt Pictures Background Images PDF
Presenting this set of slides with name customer 360 overview training required for marketing strategies ppt pictures background images pdf. This is a six stage process. The stages in this process are product knowledge, ms excel training, reporting format, xyz software usage. This is a completely editable PowerPoint presentation and is available for immediate download. Download now and impress your audience.
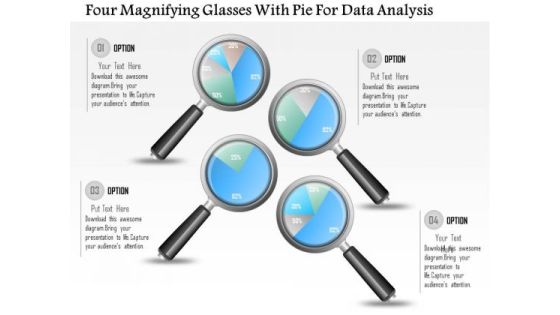
Business Diagram Four Magnifying Glasses With Pie For Data Analysis PowerPoint Slide
This business diagram displays graphic of pie charts in shape of magnifying glasses This business slide is suitable to present and compare business data. Use this diagram to build professional presentations for your viewers.
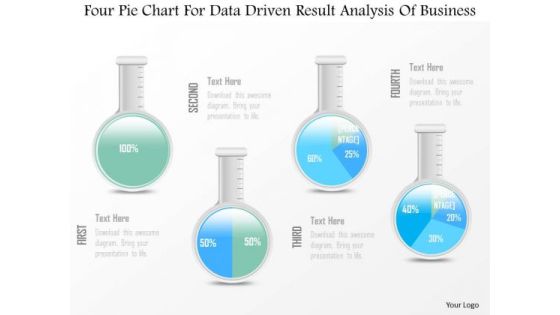
Business Diagram Four Pie Chart For Data Driven Result Analysis Of Business PowerPoint Slide
This business diagram displays graphic of pie charts in shape of flasks. This business slide is suitable to present and compare business data. Use this diagram to build professional presentations for your viewers.

10 Stages Converging Business PowerPoint Theme Process Radial Network Slides
We present our 10 stages converging business powerpoint theme process Radial Network Slides.Use our Arrows PowerPoint Templates because this Diagram emphasizes on any critical or key factors within them. Use our Flow charts PowerPoint Templates because you can Amplify your views, ideas and thoughts from very basic aspects to the highly technical and complicated issus using this template as a tool. Download and present our Business PowerPoint Templates because this is the unerring accuracy in reaching the target. the effortless ability to launch into flight. Use our Process and Flows PowerPoint Templates because your team and you always raise a toast. Download and present our Circle charts PowerPoint Templates because this slide helps you to give your team an overview of your capability and insight into the minute details of the overall picture highlighting the interdependence at every operational level.Use these PowerPoint slides for presentations relating to Business, chart, circle, colors, concept, corporate, cycle, data, design, detail, development, diagram, engineering, graphic, ideas, illustration, image, implement, implementation, life, lifecycle, management, model, objects, organization, plan, process, product, professional, project, quality, schema, shape, stack, stage, steps, strategy, structure, success, symbol. The prominent colors used in the PowerPoint template are Yellow, White, Black. You can be sure our 10 stages converging business powerpoint theme process Radial Network Slides are Swanky. Presenters tell us our colors PowerPoint templates and PPT Slides are specially created by a professional team with vast experience. They diligently strive to come up with the right vehicle for your brilliant Ideas. We assure you our 10 stages converging business powerpoint theme process Radial Network Slides are Nice. Customers tell us our concept PowerPoint templates and PPT Slides are Delightful. Presenters tell us our 10 stages converging business powerpoint theme process Radial Network Slides are Efficacious. You can be sure our data PowerPoint templates and PPT Slides are Elevated.

11 Stages Representing Diverging Circular Flow Chart Cycle Layout Diagram PowerPoint Slides
We present our 11 stages representing diverging circular flow chart Cycle Layout Diagram PowerPoint Slides.Download our Arrows PowerPoint Templates because this diagram helps you to explain your strategy to co-ordinate activities of these seperate groups. Use our Flow charts PowerPoint Templates because this template helps you to put your finger on the pulse of your business and sense the need to re-align a bit. Download and present our Business PowerPoint Templates because it helps you to project your enthusiasm and single mindedness to your colleagues. Download and present our Process and Flows PowerPoint Templates because your brain is always churning out ideas like cogs in a wheel. Present our Circle charts PowerPoint Templates because it shows you the vision of a desired destination and the best road to take to reach that goal.Use these PowerPoint slides for presentations relating to Business, chart, circle, colors, concept, corporate, cycle, data, design, detail, development, diagram, engineering, graphic, ideas, illustration, image, implement, implementation, life, lifecycle, management, model, objects, organization, plan, process, product, professional, project, quality, schema, shape, stack, stage, steps, strategy, structure, success, symbol. The prominent colors used in the PowerPoint template are Blue, Gray, Black. You can be sure our 11 stages representing diverging circular flow chart Cycle Layout Diagram PowerPoint Slides are designed by a team of presentation professionals. Presenters tell us our circle PowerPoint templates and PPT Slides are Precious. We assure you our 11 stages representing diverging circular flow chart Cycle Layout Diagram PowerPoint Slides are Clever. Customers tell us our data PowerPoint templates and PPT Slides are Dazzling. Presenters tell us our 11 stages representing diverging circular flow chart Cycle Layout Diagram PowerPoint Slides are Amazing. You can be sure our data PowerPoint templates and PPT Slides are incredible easy to use.
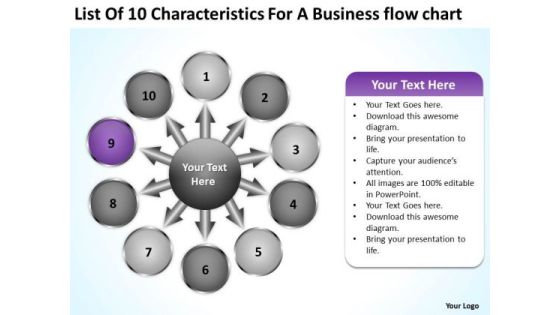
For A Free Business PowerPoint Templates Flow Chart Circular Process Slides
We present our for a free business powerpoint templates flow chart Circular Process Slides.Download our Ring Charts PowerPoint Templates because it is inspired by the indelible Olympic logo this graphic exemplifies the benefits of teamwork. Use our Shapes PowerPoint Templates because this slide demonstrates how they contribute to the larger melting pot. Download and present our Circle Charts PowerPoint Templates because it unravels the process layer by layer and exposes their relevance to the core issue. Download our Business PowerPoint Templates because you are sure you have the right people for your plans. Download our Process and Flows PowerPoint Templates because it unravels the process layer by layer and exposes their relevance to the core issue.Use these PowerPoint slides for presentations relating to Business,chart, circle, colors, concept,contemporary, corporate, cycle, data,design, detail, development, diagram, engineering, graphic, ideas,illustration, implement, implementation,management, model, modern,organization, phase, plan, process,product, professional, project, quality,schema, set, software, stack, stage, steps, strategy, success, system, tag, team. The prominent colors used in the PowerPoint template are Purple, Gray, Black. Customers tell us our for a free business powerpoint templates flow chart Circular Process Slides are Excellent. Customers tell us our data PowerPoint templates and PPT Slides are the best it can get when it comes to presenting. Customers tell us our for a free business powerpoint templates flow chart Circular Process Slides are Fashionable. People tell us our data PowerPoint templates and PPT Slides are Radiant. Customers tell us our for a free business powerpoint templates flow chart Circular Process Slides are Youthful. Customers tell us our colors PowerPoint templates and PPT Slides will save the presenter time.

For A Free Business PowerPoint Templates Flow Chart Business Circular Process Slides
We present our for a free business powerpoint templates flow chart business Circular Process Slides.Use our Business PowerPoint Templates because this diagram can set an example to enthuse your team with the passion and fervour of your ideas. Download our Process and Flows PowerPoint Templates because you can Educate your team with the attention to be paid. Download our Ring Charts PowerPoint Templates because in this Slide Various threads are joining up and being stitched together providing necessary strength Now you have to take the last leap. Download our Shapes PowerPoint Templates because this slide shows each path to the smallest detail. Present our Circle Charts PowerPoint Templates because this Layout can explain the relevance of the different layers and stages in getting down to your core competence, ability and desired result.Use these PowerPoint slides for presentations relating to Business,chart, circle, colors, concept,contemporary, corporate, cycle, data,design, detail, development, diagram, engineering, graphic, ideas,illustration, implement, implementation,management, model, modern,organization, phase, plan, process,product, professional, project, quality,schema, set, software, stack, stage, steps, strategy, success, system, tag, team. The prominent colors used in the PowerPoint template are Blue light, Gray, Black. Customers tell us our for a free business powerpoint templates flow chart business Circular Process Slides are Lush. Customers tell us our concept PowerPoint templates and PPT Slides are Vintage. Customers tell us our for a free business powerpoint templates flow chart business Circular Process Slides are Fantastic. People tell us our corporate PowerPoint templates and PPT Slides are Fashionable. Customers tell us our for a free business powerpoint templates flow chart business Circular Process Slides will help you be quick off the draw. Just enter your specific text and see your points hit home. Customers tell us our data PowerPoint templates and PPT Slides are Breathtaking.
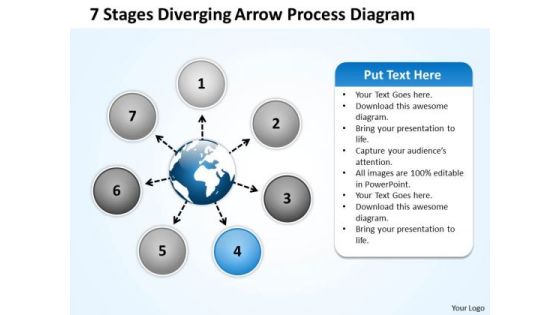
Diverging Arrow Process Diagram Ppt Relative Circular Flow PowerPoint Templates
We present our diverging arrow process diagram ppt Relative Circular Flow PowerPoint templates.Download our Process and Flows PowerPoint Templates because this diagram put it all together to form the complete picture and reach the goal. Download our Flow Charts PowerPoint Templates because displaying your ideas and highlighting your ability will accelerate the growth of your company and yours. Download and present our Circle Charts PowerPoint Templates because you have churned your mind and come up with effective ways and means to further refine it. Present our Ring Charts PowerPoint Templates because there are a bucketful of brilliant ideas swirling around within your group. Present our Globe PowerPoint Templates because all elements of the venture are equally critical.Use these PowerPoint slides for presentations relating to Circle, colors, concept,contemporary, corporate, cycle, data,design, detail, development, diagram, engineering, graphic, ideas,illustration, implement, implementation,management, model, modern,organization, phase, plan, process,product, professional, project, quality,schema, set, software, stack, stage, steps, strategy, success, system, tag, team. The prominent colors used in the PowerPoint template are Blue, White , Black. Professionals tell us our diverging arrow process diagram ppt Relative Circular Flow PowerPoint templates are Breathtaking. People tell us our concept PowerPoint templates and PPT Slides are Dynamic. The feedback we get is that our diverging arrow process diagram ppt Relative Circular Flow PowerPoint templates are Magical. Presenters tell us our cycle PowerPoint templates and PPT Slides are Precious. You can be sure our diverging arrow process diagram ppt Relative Circular Flow PowerPoint templates are Colorful. PowerPoint presentation experts tell us our data PowerPoint templates and PPT Slides are Efficacious.

10 Stages Converging Business Process Circular Flow Diagram PowerPoint Slides
We present our 10 stages converging business process Circular Flow Diagram PowerPoint Slides.Download and present our Arrows PowerPoint Templates because they enhance the essence of your viable ideas. Download and present our Flow charts PowerPoint Templates because this slide can help to bullet point your views. Download our Business PowerPoint Templates because it will demonstrate the strength of character under severe stress. Shine the torch ahead and bring the light to shine on all. Present our Process and Flows PowerPoint Templates because you are aware of some pitfalls ahead where you need to be cautious not to overrun and avoid a stall. Download and present our Circle charts PowerPoint Templates because you have what it takes to grow.Use these PowerPoint slides for presentations relating to Business, chart, circle, colors, concept, corporate, cycle, data, design, detail, development, diagram, engineering, graphic, ideas, illustration, image, implement, implementation, life, lifecycle, management, model, objects, organization, plan, process, product, professional, project, quality, schema, shape, stack, stage, steps, strategy, structure, success, symbol. The prominent colors used in the PowerPoint template are Yellow, Black, White. You can be sure our 10 stages converging business process Circular Flow Diagram PowerPoint Slides have awesome images to get your point across. Presenters tell us our data PowerPoint templates and PPT Slides are Beautiful. We assure you our 10 stages converging business process Circular Flow Diagram PowerPoint Slides are Delightful. Customers tell us our corporate PowerPoint templates and PPT Slides will impress their bosses and teams. Presenters tell us our 10 stages converging business process Circular Flow Diagram PowerPoint Slides are Perfect. You can be sure our corporate PowerPoint templates and PPT Slides will impress their bosses and teams.
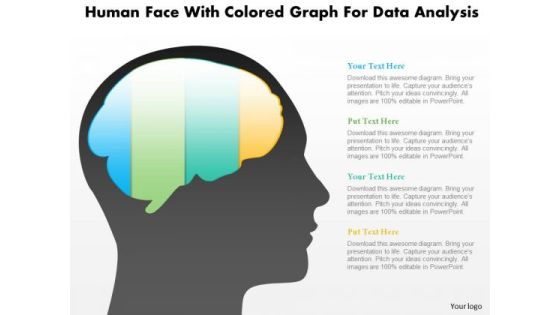
Business Diagram Human Face With Colored Graph For Data Analysis PowerPoint Slide
This diagram displays human face graphic with colored graph. This diagram can be used to represent strategy, planning, thinking of business plan. Display business options in your presentations by using this creative diagram.

10 Stages Converging Business PowerPoint Theme Process Radial Chart Slides
We present our 10 stages converging business powerpoint theme process Radial Chart Slides.Use our Arrows PowerPoint Templates because they help to lay the base of your trend of thought. Use our Flow charts PowerPoint Templates because this template with an image of helps you chart the course of your presentation. Download and present our Business PowerPoint Templates because the majestic tiger lord of all it surveys.It exudes power even when it is in repose. Present our Process and Flows PowerPoint Templates because you can Take your team along by explaining your plans. Present our Circle charts PowerPoint Templates because it is the time to bond with family, friends, colleagues and any other group of your choice.Use these PowerPoint slides for presentations relating to Business, chart, circle, colors, concept, corporate, cycle, data, design, detail, development, diagram, engineering, graphic, ideas, illustration, image, implement, implementation, life, lifecycle, management, model, objects, organization, plan, process, product, professional, project, quality, schema, shape, stack, stage, steps, strategy, structure, success, symbol. The prominent colors used in the PowerPoint template are Yellow, Black, Gray. You can be sure our 10 stages converging business powerpoint theme process Radial Chart Slides are Luxuriant. Presenters tell us our corporate PowerPoint templates and PPT Slides are effectively colour coded to prioritise your plans They automatically highlight the sequence of events you desire. We assure you our 10 stages converging business powerpoint theme process Radial Chart Slides are Efficient. Customers tell us our data PowerPoint templates and PPT Slides are One-of-a-kind. Presenters tell us our 10 stages converging business powerpoint theme process Radial Chart Slides are Stunning. You can be sure our cycle PowerPoint templates and PPT Slides are Lush.

10 Stages Converging Business Process Cycle Chart PowerPoint Slides
We present our 10 stages converging business process Cycle Chart PowerPoint Slides.Use our Arrows PowerPoint Templates because there are various viable propositions available to further your commercial interests. Download our Flow charts PowerPoint Templates because you have developed a vision of where you want to be a few years from now. Download our Business PowerPoint Templates because you are ready to flap your wings and launch off. All poised are you to touch the sky with glory. Present our Process and Flows PowerPoint Templates because this is An innovative slide design depicting driving home the relevance of a steady rhythm. Present our Circle charts PowerPoint Templates because you watch them slowly start to savour the flavour you have served them.Use these PowerPoint slides for presentations relating to Business, chart, circle, colors, concept, corporate, cycle, data, design, detail, development, diagram, engineering, graphic, ideas, illustration, image, implement, implementation, life, lifecycle, management, model, objects, organization, plan, process, product, professional, project, quality, schema, shape, stack, stage, steps, strategy, structure, success, symbol. The prominent colors used in the PowerPoint template are Yellow, White, Gray. You can be sure our 10 stages converging business process Cycle Chart PowerPoint Slides are Swanky. Presenters tell us our corporate PowerPoint templates and PPT Slides are Classic. We assure you our 10 stages converging business process Cycle Chart PowerPoint Slides are One-of-a-kind. Customers tell us our data PowerPoint templates and PPT Slides are Bold. Presenters tell us our 10 stages converging business process Cycle Chart PowerPoint Slides are Handsome. You can be sure our circle PowerPoint templates and PPT Slides are Festive.
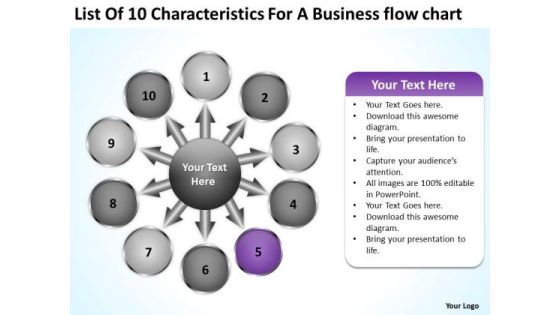
For A Free Business PowerPoint Templates Flow Chart Ppt Circular Process Slides
We present our for a free business powerpoint templates flow chart ppt Circular Process Slides.Present our Circle Charts PowerPoint Templates because Our PowerPoint Templates and Slides will let you meet your Deadlines. Use our Ring Charts PowerPoint Templates because this PPt slide highlights any anticipated problems, shortfalls or weak areas. Present our Process and Flows PowerPoint Templates because this helps in epitomised the values of teamwork. Use our Shapes PowerPoint Templates because it Creates a winner with your passion and dream. Download our Business PowerPoint Templates because infrastructure growth is an obvious requirement of today.inform your group on how exactly this potential is tailor made for you.Use these PowerPoint slides for presentations relating to Business,chart, circle, colors, concept,contemporary, corporate, cycle, data,design, detail, development, diagram, engineering, graphic, ideas,illustration, implement, implementation,management, model, modern,organization, phase, plan, process,product, professional, project, quality,schema, set, software, stack, stage, steps, strategy, success, system, tag, team. The prominent colors used in the PowerPoint template are Purple, White, Gray. Customers tell us our for a free business powerpoint templates flow chart ppt Circular Process Slides are Functional. Customers tell us our cycle PowerPoint templates and PPT Slides are Multicolored. Customers tell us our for a free business powerpoint templates flow chart ppt Circular Process Slides are Bold. People tell us our concept PowerPoint templates and PPT Slides will make the presenter look like a pro even if they are not computer savvy. Customers tell us our for a free business powerpoint templates flow chart ppt Circular Process Slides are Awesome. Customers tell us our contemporary PowerPoint templates and PPT Slides are second to none.

Business Diagram Alarm Clock With Pie Chart For Result Analysis PowerPoint Slide
This business slide displays alarm clock with pie chart. This diagram is a data visualization tool that gives you a simple way to present statistical information. This slide helps your audience examine and interpret the data you present.

10 Diverging Stages Planning Process Diagram Circular Flow PowerPoint Templates
We present our 10 diverging stages planning process diagram Circular Flow PowerPoint templates.Download our Ring Charts PowerPoint Templates because they help to focus the thoughts of your listeners. Download and present our Flow charts PowerPoint Templates because you have a handle on all the targets, a master of the game, the experienced and consummate juggler. Download our Process and flows PowerPoint Templates because it Creates a winner with your passion and dream. Download our Business PowerPoint Templates because you have churned your mind and come upwith solutions. Download our Arrows PowerPoint Templates because with the help of our Slides you can Illustrate these thoughts with this slide.Use these PowerPoint slides for presentations relating to Business, chart, circle, colors, concept, corporate, cycle, data, design, detail, development, diagram, engineering, graphic, ideas, illustration, image, implement, implementation, life, lifecycle, management, model, objects, organization, process, product, professional, project, quality, schema, shape, steps, strategy, structure, success, symbol. The prominent colors used in the PowerPoint template are Blue light, Black, White. You can be sure our 10 diverging stages planning process diagram Circular Flow PowerPoint templates are Reminiscent. Presenters tell us our circle PowerPoint templates and PPT Slides have awesome images to get your point across. We assure you our 10 diverging stages planning process diagram Circular Flow PowerPoint templates are Versatile. Customers tell us our circle PowerPoint templates and PPT Slides will make the presenter successul in his career/life. Presenters tell us our 10 diverging stages planning process diagram Circular Flow PowerPoint templates are Dynamic. You can be sure our circle PowerPoint templates and PPT Slides are Tranquil.

10 Diverging Stages Planning Process Diagram Radial Chart PowerPoint Templates
We present our 10 diverging stages planning process diagram Radial Chart PowerPoint templates.Present our Arrows PowerPoint Templates because you can Show them how to churn out fresh ideas. Present our Flow charts PowerPoint Templates because you can see In any endeavour people matter most. Download our Business PowerPoint Templates because this template helps you to grab the attention of your listeners. Use our Process and Flows PowerPoint Templates because you can enlighten your skills with the help of our topical templates. Download and present our Circle charts PowerPoint Templates because you have the plans ready for them to absorb and understand.Use these PowerPoint slides for presentations relating to Business, chart, circle, colors, concept, corporate, cycle, data, design, detail, development, diagram, engineering, graphic, ideas, illustration, image, implement, implementation, life, lifecycle, management, model, objects, organization, plan, process, product, professional, project, quality, schema, shape, stack, stage, steps, strategy, structure, success, symbol. The prominent colors used in the PowerPoint template are Purple, Black, Gray. You can be sure our 10 diverging stages planning process diagram Radial Chart PowerPoint templates are Efficacious. Presenters tell us our corporate PowerPoint templates and PPT Slides are Dazzling. We assure you our 10 diverging stages planning process diagram Radial Chart PowerPoint templates help you meet deadlines which are an element of today's workplace. Just browse and pick the slides that appeal to your intuitive senses. Customers tell us our circle PowerPoint templates and PPT Slides are Nifty. Presenters tell us our 10 diverging stages planning process diagram Radial Chart PowerPoint templates are Beautiful. You can be sure our corporate PowerPoint templates and PPT Slides are Attractive.

10 Stages Converging Business Process Cycle Layout Diagram PowerPoint Templates
We present our 10 stages converging business process Cycle Layout Diagram PowerPoint templates.Present our Arrows PowerPoint Templates because this is a good example of the strength of teamwork. Use our Flow charts PowerPoint Templates because it gives you really bright ideas. Download and present our Business PowerPoint Templates because maximising sales of your product is the intended destination. Present our Process and Flows PowerPoint Templates because it demonstrates the seeds of many of our successes. Download our Circle charts PowerPoint Templates because it expound on why you have discarded some plans as you went along to the apex and came out with the final selection which you know will make you and your team shine.Use these PowerPoint slides for presentations relating to Business, chart, circle, colors, concept, corporate, cycle, data, design, detail, development, diagram, engineering, graphic, ideas, illustration, image, implement, implementation, life, lifecycle, management, model, objects, organization, plan, process, product, professional, project, quality, schema, shape, stack, stage, steps, strategy, structure, success, symbol. The prominent colors used in the PowerPoint template are Blue, White, Black. You can be sure our 10 stages converging business process Cycle Layout Diagram PowerPoint templates are topically designed to provide an attractive backdrop to any subject. Presenters tell us our colors PowerPoint templates and PPT Slides are Energetic. We assure you our 10 stages converging business process Cycle Layout Diagram PowerPoint templates will save the presenter time. Customers tell us our corporate PowerPoint templates and PPT Slides are Splendid. Presenters tell us our 10 stages converging business process Cycle Layout Diagram PowerPoint templates are Handsome. You can be sure our circle PowerPoint templates and PPT Slides are Cheerful.

Business Diagram Flask With Data Driven Chart PowerPoint Slide
This data driven diagram has been designed with flask graphics. Download this diagram to give your presentations more effective look. It helps in clearly conveying your message to clients and audience.

Business Diagram Laptop With Data Driven Area Chart PowerPoint Slide
This diagram has been designed with laptop and data driven area chart. Download this diagram to give your presentations more effective look. It helps in clearly conveying your message to clients and audience.
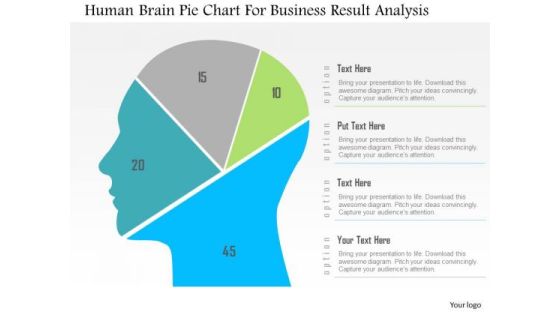
Business Diagram Human Brain Pie Chart For Business Result Analysis PowerPoint Slide
This diagram displays human face graphic divided into sections. This section can be used for data display. Use this diagram to build professional presentations for your viewers.

Business Diagram 3d Colorful Pie Graph With Magnifier Data Search PowerPoint Slide
This business slide displays 3d colorful pie graph with magnifier. This diagram is a data visualization tool that gives you a simple way to present statistical information. This slide helps your audience examine and interpret the data you present.

Business Diagram Data Driven Pie Chart Inside The Magnifier PowerPoint Slide
This business slide displays 3d colorful pie graph with magnifier. This diagram is a data visualization tool that gives you a simple way to present statistical information. This slide helps your audience examine and interpret the data you present.

Arrows Graphical View Of Different Aspects Circular Circular Network PowerPoint Templates
We present our arrows graphical view of different aspects circular Circular Network PowerPoint templates.Download our Globe PowerPoint Templates because the colour coding of our templates are specifically designed to highlight you points. Use our Ring Charts PowerPoint Templates because you have it all down to a nicety, slice by slice, layer by layer. Download our Circle Charts PowerPoint Templates because you have the process in your head, our template design showing will illuminate your thoughts. Download our Business PowerPoint Templates because you can see clearly through to the bigger bowl ahead. Time your jump to perfection and hit the nail on the head. Download our Shapes PowerPoint Templates because it have all to represent to your viewers.Use these PowerPoint slides for presentations relating to Business, chart, circle,colors, concept, corporate, cycle, data,design, detail, development, diagram,engineering, graphic, ideas, illustration,image, implement, implementation, life,lifecycle, management, model, objects,organization, phase, plan, process,product, professional, project, quality,schema, shape. The prominent colors used in the PowerPoint template are Gray, Black, White. You can be sure our arrows graphical view of different aspects circular Circular Network PowerPoint templates will make the presenter successul in his career/life. PowerPoint presentation experts tell us our cycle PowerPoint templates and PPT Slides are Beautiful. Professionals tell us our arrows graphical view of different aspects circular Circular Network PowerPoint templates are Tranquil. Presenters tell us our circle PowerPoint templates and PPT Slides will save the presenter time. Professionals tell us our arrows graphical view of different aspects circular Circular Network PowerPoint templates are Appealing. Customers tell us our design PowerPoint templates and PPT Slides are Glamorous.
Business Diagram 3d Capsule With Multiple Icons For Business Data Flow PowerPoint Slide
This diagram has been designed with 3d graphic of capsule with multiple icons. This data driven PowerPoint slide can be used to give your presentations more effective look. It helps in clearly conveying your message to clients and audience.
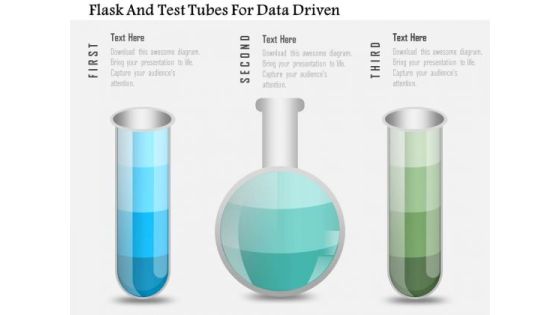
Business Diagram Flask And Test Tubes For Data Driven PowerPoint Slide
This data driven diagram has been designed with flask and test tubes. Download this diagram to give your presentations more effective look. It helps in clearly conveying your message to clients and audience.
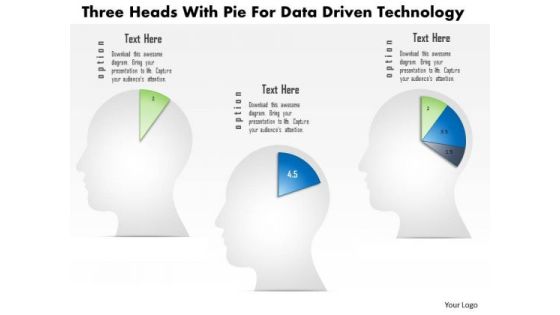
Business Diagram Three Heads With Pie For Data Driven Technology PowerPoint Slide
This business diagram displays three human faces with pie charts. This Power Point template has been designed to compare and present business data. You may use this diagram to impart professional appearance to your presentations.
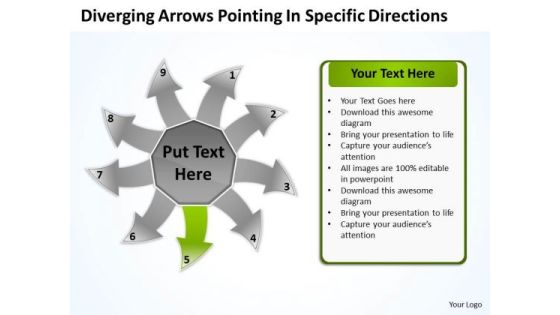
Diverging Arrows Pointing Specific Directions Ppt Cycle Process PowerPoint Slide
We present our diverging arrows pointing specific directions ppt Cycle Process PowerPoint Slide.Present our Communication PowerPoint Templates because different people with differing ideas and priorities perform together to score. Download our Arrows PowerPoint Templates because you can put down your ideas and present them using our innovative templates. Present our Circle Charts PowerPoint Templates because there is a vision, a need you can meet. Download our Business PowerPoint Templates because this layout helps you to bring some important aspects of your business process to the notice of all concerned. Streamline the flow of information across the board. Download and present our Shapes PowerPoint Templates because you will be able to Highlight these individual targets and the paths to their achievement.Use these PowerPoint slides for presentations relating to Arrow, Bio, Business, Chart, Circle, Concept, Control, Cycle, Design, Development, Diagram, Eco, Ecology, Environmental, Evaluate, Flow, Flowchart, Fresh, Graphic, Green, Idea, Infographic, Iterative, Life, Lifecycle, Management, Method, Model, Natural, Nature, Organic, Process, Quality, Recycle, Research, Schema, Spiral, Step, Strategy, Success, System. The prominent colors used in the PowerPoint template are Green, Gray, White. Customers tell us our diverging arrows pointing specific directions ppt Cycle Process PowerPoint Slide are Ultra. Customers tell us our Control PowerPoint templates and PPT Slides are Perfect. Presenters tell us our diverging arrows pointing specific directions ppt Cycle Process PowerPoint Slide are incredible easy to use. PowerPoint presentation experts tell us our Business PowerPoint templates and PPT Slides are Majestic. Customers tell us our diverging arrows pointing specific directions ppt Cycle Process PowerPoint Slide are Whimsical. Professionals tell us our Cycle PowerPoint templates and PPT Slides are Precious.

Data Analysis Increases Effectiveness And Efficiency Ppt Powerpoint Show
This is a data analysis increases effectiveness and efficiency ppt powerpoint show. This is a five stage process. The stages in this process are is data rich report opportunistic, testing the entire populations versus sample, date analysis increases effectiveness and efficiency, effective for working remotely or on site, easier to share information electronically than via hardcopy reports.
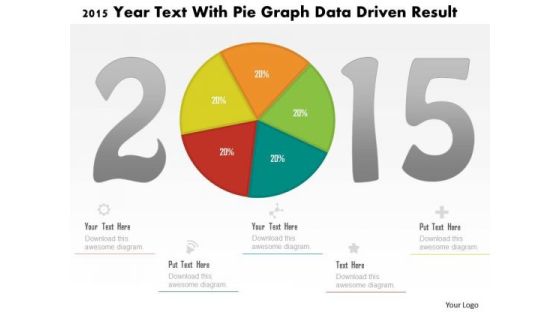
Business Diagram 2015 Year Text With Pie Graph Data Driven Result PowerPoint Slide
This business diagram displays 2015 year numbers with pie chart. This diagram is suitable to display business strategy for year 2015. Download this professional slide to present information in an attractive manner
Business Diagram Five Staged Pencil Diagram For Data Representation PowerPoint Slide
This business slide displays five staged pencil diagram. It contains pencil graphic divided into five parts. This diagram slide depicts processes, stages, steps, points, options and education information display. Use this diagram, in your presentations to express your views innovatively.
Business Diagram Three Test Tubes With Magnifier For Data Search PowerPoint Slide
This business diagram displays three test tubes with magnifying glass. This diagram is suitable to depict flow of business activities or steps. Download this professional slide to present information in an attractive manner.

Business Diagram Three Trucks For Data Representation For Business PowerPoint Slide
This business diagram displays three trucks graphic. This diagram contains trucks for percentage value growth. Use this diagram to display business growth over a period of time.
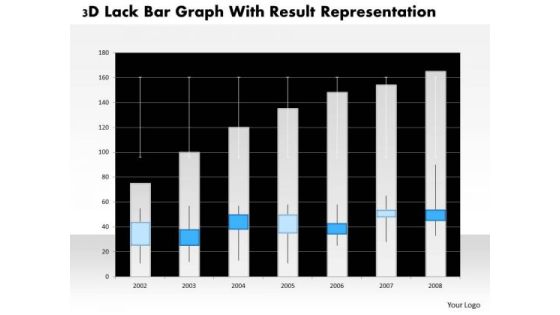
Business Diagram 3d Lack Bar Graph With Result Representation PowerPoint Slide
This business diagram has graphic of 3d lack bar graph. This diagram is a data visualization tool that gives you a simple way to present statistical information. This slide helps your audience examine and interpret the data you present.

Business Diagram Battery Connected With Bulb For Idea Generation PowerPoint Slide
This business slide displays battery icon connected with bulb. This diagram is a data visualization tool that gives you a simple way to present statistical information. This slide helps your audience examine and interpret the data you present.

Company Snapshot Highlighting Firm Updates Demonstration PDF
This slide provides information regarding firm overview highlighting details about geographical presence, annual revenues, website, major competitors, no. of employees, etc. From laying roadmaps to briefing everything in detail, our templates are perfect for you. You can set the stage with your presentation slides. All you have to do is download these easy to edit and customizable templates. Company Snapshot Highlighting Firm Updates Demonstration PDF will help you deliver an outstanding performance that everyone would remember and praise you for. Do download this presentation today.

Business Diagram Human Mind Diagram With Pie Graph For Representation PowerPoint Slide
This diagram displays human face graphic divided into sections. This section can be used for data display. Use this diagram to build professional presentations for your viewers.

Business Diagram Six Staged Pie Charts For Text Representation PowerPoint Slide
This slide displays graphic six staged pie charts. Download this diagram to present and compare business data. Use this diagram to display business process workflows in any presentation.
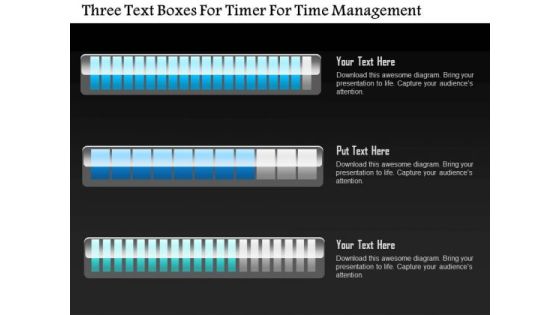
Business Diagram Three Text Boxes For Timer For Time Management PowerPoint Slide
This business diagram displays three text boxes. This diagram contains text boxes for data representation. Use this diagram to display business process workflows in any presentations.
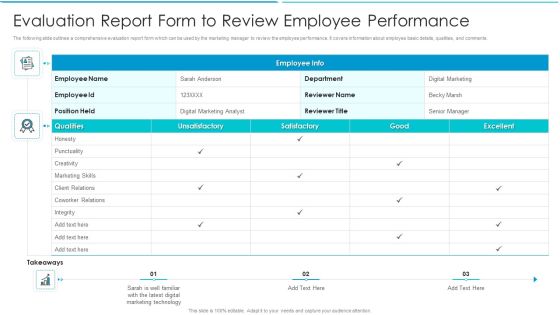
Evaluation Report Form To Review Employee Performance Inspiration PDF
The following slide outlines a comprehensive evaluation report form which can be used by the marketing manager to review the employee performance. It covers information about employee basic details, qualities, and comments. Showcasing this set of slides titled Evaluation Report Form To Review Employee Performance Inspiration PDF. The topics addressed in these templates are Marketing Technology, Digital Marketing, Digital Marketing Analyst. All the content presented in this PPT design is completely editable. Download it and make adjustments in color, background, font etc. as per your unique business setting.
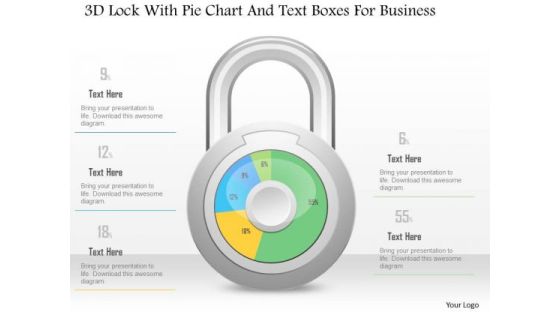
Business Diagram 3d Lock With Pie Chart And Text Boxes For Business PowerPoint Slide
This Power Point diagram has been crafted with pie chart in shape of lock. It contains diagram of lock pie chart to compare and present data in an effective manner. Use this diagram to build professional presentations for your viewers.

Business Diagram 3d Lock With Pie Graph For Result Representation PowerPoint Slide
This Power Point diagram has been crafted with pie chart in shape of lock. It contains diagram of lock pie chart to compare and present data in an effective manner. Use this diagram to build professional presentations for your viewers.

Business Diagram 3d Pencil With Text Boxes For Representation PowerPoint Slide
This Power Point diagram displays graphic of pencil with icons and text spaces. It contains diagram of colorful pencil for data display. Use this diagram to build professional presentations for your viewers.
Business Diagram Human Icons With Bubbles And Different Icons Inside PowerPoint Slide
This diagram displays graph with percentage value growth. This business slide is suitable to present and compare business data. Use this diagram to build professional presentations for your viewers.

Business Diagram Three Staged Pencil Diagram For Graph Formation PowerPoint Slide
This business diagram displays set of pencils. This Power Point template has been designed to compare and present business data. Download this diagram to represent stages of business growth.
Business Diagram Battery Icon With Power Icons Energy Technology PowerPoint Slide
This business diagram displays battery icon with power charging. Use this diagram, in your presentations to display energy saving, battery and technology. Create professional presentations using this diagram slide.

Business Diagram Battery With Alert Sign And Dices Power Technology PowerPoint Slide
This business diagram displays risk alert on battery icon. Use this diagram, in your presentations to display energy saving, battery and technology. Create professional presentations using this diagram slide.
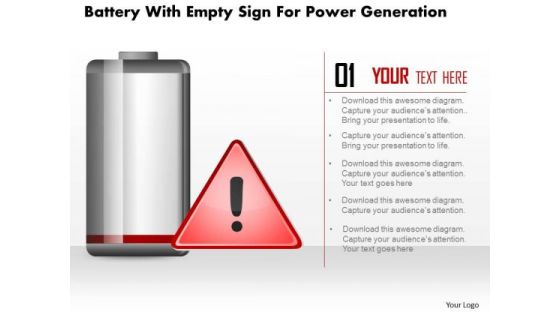
Business Diagram Battery With Empty Sign For Power Generation PowerPoint Slide
This business diagram displays empty sign alert on battery icon. Use this diagram, in your presentations to display energy saving, battery and technology. Create professional presentations using this diagram slide.

Business Diagram Five Staged Timeline Diagram For Business PowerPoint Slide
This PowerPoint template displays five points timeline diagram. This business diagram has been designed with graphic of timeline with five points, text space and start, end points. Use this diagram, in your presentations to display process steps, stages, timelines and business management. Make wonderful presentations using this business slide.
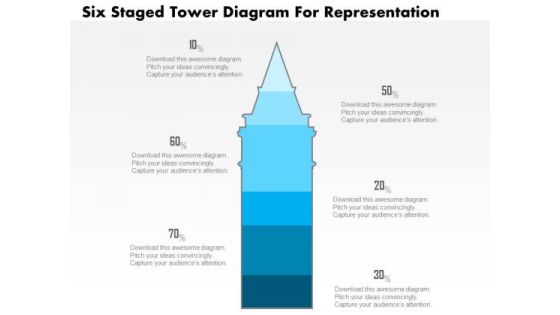
Business Diagram Five Staged Tower Diagram For Representation PowerPoint Slide
This business slide displays five staged tower diagram. It contains blue tower graphic divided into five parts. This diagram slide depicts processes, stages, steps, points, options information display. Use this diagram, in your presentations to express your views innovatively.
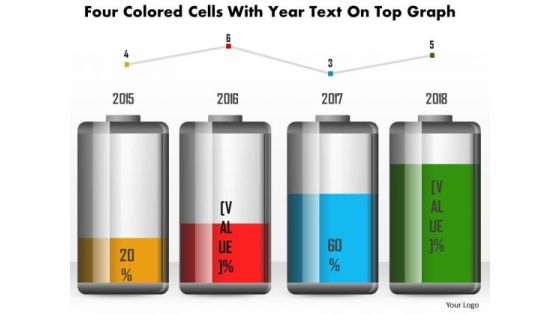
Business Diagram Four Colored Cells With Year Text On Top Graph PowerPoint Slide
This business diagram has been designed with battery cell graphic for business timeline. This slide can be used for business planning and management. Use this diagram for your business and success milestones related presentations.
Business Diagram Green Battery Cell With Full Charging Symbol PowerPoint Slide
This business diagram displays full battery charge icon. Use this diagram, in your presentations to display energy saving, battery and technology. Create professional presentations using this diagram slide.

Business Diagram Four Steps With 3d Business Person Standing Over It PowerPoint Slide
This business diagram displays bar graph with business person standing on it. This Power Point template has been designed to display personal growth. You may use this diagram to impart professional appearance to your presentations.

Business Diagram 3d Pie Chart With Arrows For Data Representation PowerPoint Slide
This business slide displays pie chart with timeline graphics. This diagram has been designed with graphic of with four arrows representing yearly data. Use this diagram, in your presentations to display process steps, stages, for business management.

Data Analysis Excel Driven Multiple Series Scatter Chart PowerPoint Slides Templates
Your Listeners Will Never Doodle. Our data analysis excel driven multiple series scatter chart powerpoint slides Templates Will Hold Their Concentration.
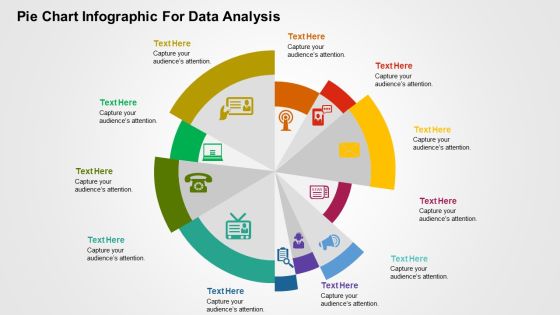
Pie Chart Infographic For Data Analysis PowerPoint Templates
This is one of the most downloaded PowerPoint template. This slide can be used for various purposes and to explain a number of processes. This can be included in your presentation to explain each step of a process and even include its relevance and importance in a single diagram. Using the uneven circular structure of the pie chart, the presenter can also explain random steps or highlight particular steps of process or parts of an organization or business that need special attention of any kind to the audience. Additionally, you can use this slide to show a transformation process or highlight key features of a product.

Company Snapshot Showcasing Essential Firm Highlights Infographics PDF
This slide provides information regarding overall highlights of firm with details about geographical presence, annual revenues, website, major competitors, no. of employees, etc. From laying roadmaps to briefing everything in detail, our templates are perfect for you. You can set the stage with your presentation slides. All you have to do is download these easy to edit and customizable templates. Company Snapshot Showcasing Essential Firm Highlights Infographics PDF will help you deliver an outstanding performance that everyone would remember and praise you for. Do download this presentation today.

Business Diagram Extract Transform Load Etl Business Intelligence Bug Data Analysis Pipeline Ppt Sli
This PowerPoint template has been designed with graphic of server. This diagram depicts the concept of ETL business intelligence with extract transform load. This slide also helps to display the data analysis pipeline.

Rebranding Brand Fresh Face Development Case Study Brand Reboot For Improved Inspiration PDF
This slide provides information regarding case study showcasing brand reboot for improved performance management. It includes details about goal, existing brand perception, initiatives, duration, etc. Slidegeeks has constructed Rebranding Brand Fresh Face Development Case Study Brand Reboot For Improved Inspiration PDF after conducting extensive research and examination. These presentation templates are constantly being generated and modified based on user preferences and critiques from editors. Here, you will find the most attractive templates for a range of purposes while taking into account ratings and remarks from users regarding the content. This is an excellent jumping-off point to explore our content and will give new users an insight into our top-notch PowerPoint Templates.
Project QA Framework Icon Demonstration PDF
Persuade your audience using this Project QA Framework Icon Demonstration PDF. This PPT design covers three stages, thus making it a great tool to use. It also caters to a variety of topics including Project QA, Framework Icon. Download this PPT design now to present a convincing pitch that not only emphasizes the topic but also showcases your presentation skills.
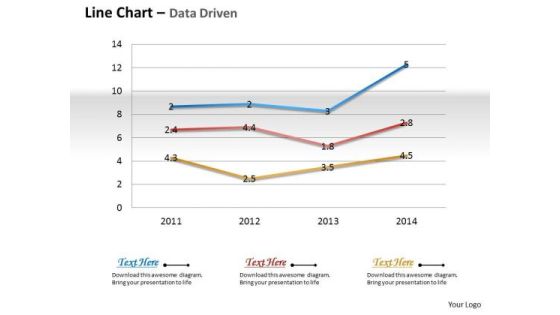
Business Data Analysis Chart Shows Changes Over The Time PowerPoint Templates
Document The Process On Our business data analysis chart shows changes over the time Powerpoint Templates. Make A Record Of Every Detail.

Steps To Create A Technology Product With A B Testing Ppt PowerPoint Presentation Styles Portfolio PDF
Presenting this set of slides with name steps to create a technology product with a b testing ppt powerpoint presentation styles portfolio pdf. This is a one stage process. The stages in this process are using data and analytics to take decisions whenever possible, keep product designs at the prototype stage and iterate until you are confident that will use development resources, use a b testing to improve conversion, give customers a simple way of providing feedback. This is a completely editable PowerPoint presentation and is available for immediate download. Download now and impress your audience.

Business Diagram Four Colored Pie Charts For Result Analysis Data Driven PowerPoint Slide
This business diagram displays graphic of pie charts. This business slide is suitable to present and compare business data. Use this diagram to build professional presentations for your viewers.
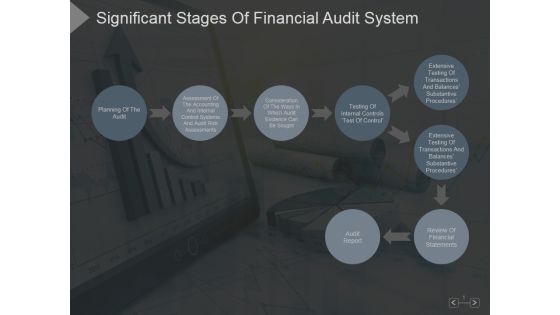
Significant Stages Of Financial Audit System Ppt PowerPoint Presentation Backgrounds
This is a significant stages of financial audit system ppt powerpoint presentation backgrounds. This is a eight stage process. The stages in this process are planning of the audit, audit report, review of financial statements, testing of internal controls.

KAM Evaluation Procedure In The Organization Skill Requirement For The Success Designs PDF
This slide provides information about the skills that are required by the key account manager in the company such as awareness of client strategy, effective leadership qualities, strong business acumen and analytical skill ability. The KAM Evaluation Procedure In The Organization Skill Requirement For The Success Designs PDF is a compilation of the most recent design trends as a series of slides. It is suitable for any subject or industry presentation, containing attractive visuals and photo spots for businesses to clearly express their messages. This template contains a variety of slides for the user to input data, such as structures to contrast two elements, bullet points, and slides for written information. Slidegeeks is prepared to create an impression.
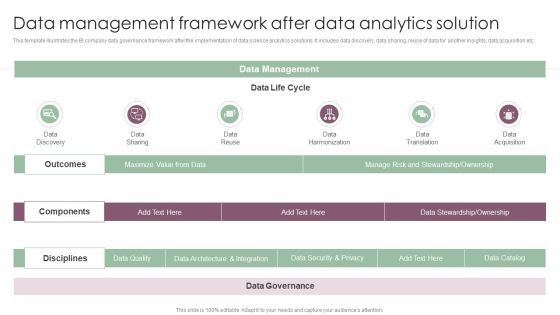
Information Analysis And BI Playbook Data Management Framework After Data Analytics Solution Template PDF
This template illustrates the BI company data governance framework after the implementation of data science analytics solutions. It includes data discovery, data sharing, reuse of data for another insights, data acquisition etc. Are you in need of a template that can accommodate all of your creative concepts This one is crafted professionally and can be altered to fit any style. Use it with Google Slides or PowerPoint. Include striking photographs, symbols, depictions, and other visuals. Fill, move around, or remove text boxes as desired. Test out color palettes and font mixtures. Edit and save your work, or work with colleagues. Download Information Analysis And BI Playbook Data Management Framework After Data Analytics Solution Template PDF and observe how to make your presentation outstanding. Give an impeccable presentation to your group and make your presentation unforgettable.

ETL Testing Process With Data Profiling Solutions Ppt Inspiration Backgrounds PDF
This slide shows extract transform load ETL testing process with data profiling which can benefit IT department to systematically evaluate the said process along to make decisions regarding data management. It contains information about profiling, staging database, data warehouse, data cubes, data mining, opal analysis, reports, etc. Presenting ETL Testing Process With Data Profiling Solutions Ppt Inspiration Backgrounds PDF to dispense important information. This template comprises one stages. It also presents valuable insights into the topics including Financial Data, Data Profiling, Data Warehouse. This is a completely customizable PowerPoint theme that can be put to use immediately. So, download it and address the topic impactfully.

