Quality Dashboard
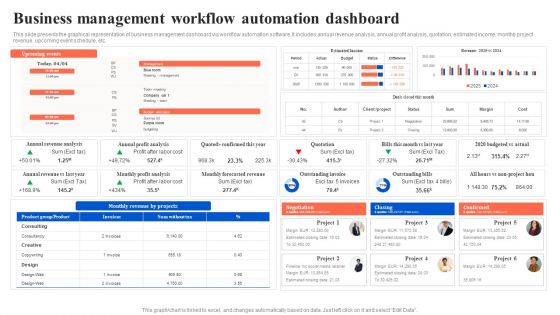
Workflow Automation For Optimizing Organizational Processes Business Management Workflow Infographics PDF
This slide presents the graphical representation of business management dashboard via workflow automation software. It includes annual revenue analysis, annual profit analysis, quotation, estimated income, monthly project revenue, upcoming event schedule, etc. Here you can discover an assortment of the finest PowerPoint and Google Slides templates. With these templates, you can create presentations for a variety of purposes while simultaneously providing your audience with an eye catching visual experience. Download Workflow Automation For Optimizing Organizational Processes Business Management Workflow Infographics PDF to deliver an impeccable presentation. These templates will make your job of preparing presentations much quicker, yet still, maintain a high level of quality. Slidegeeks has experienced researchers who prepare these templates and write high quality content for you. Later on, you can personalize the content by editing the Workflow Automation For Optimizing Organizational Processes Business Management Workflow Infographics PDF.

Agile Supported Software Advancement Playbook Tracking User Stories Across Agile Project Development Professional PDF
This slide provides information regarding dashboard for tracking user stories across agile project development including work items, etc. Here you can discover an assortment of the finest PowerPoint and Google Slides templates. With these templates, you can create presentations for a variety of purposes while simultaneously providing your audience with an eye catching visual experience. Download Agile Supported Software Advancement Playbook Tracking User Stories Across Agile Project Development Professional PDF to deliver an impeccable presentation. These templates will make your job of preparing presentations much quicker, yet still, maintain a high level of quality. Slidegeeks has experienced researchers who prepare these templates and write high quality content for you. Later on, you can personalize the content by editing the Agile Supported Software Advancement Playbook Tracking User Stories Across Agile Project Development Professional PDF.
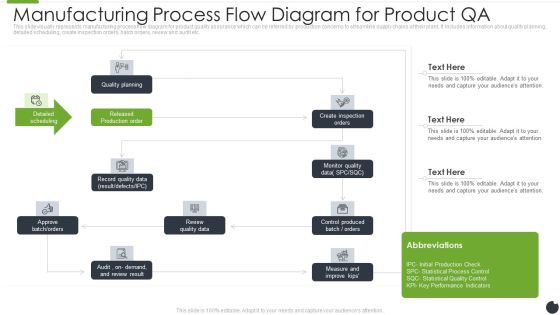
Manufacturing Process Flow Diagram For Product QA Mockup PDF
This slide visually represents manufacturing process flow diagram for product quality assurance which can be referred by production concerns to streamline supply chains of their plant. It includes information about quality planning, detailed scheduling, create inspection orders, batch orders, review and audit etc. Showcasing this set of slides titled manufacturing process flow diagram for product qa mockup pdf. The topics addressed in these templates are quality planning, approve batch and orders, review quality data. All the content presented in this PPT design is completely editable. Download it and make adjustments in color, background, font etc. as per your unique business setting.

Defining Work And Set Responsibilities Of Team Members Ideas PDF
This slide highlights roles and responsibilities of team members associated with quality risk management. This is a building projects risk landscape vendor supplier analysis dashboard guidelines pdf template with various stages. Focus and dispense information on four stages using this creative set, that comes with editable features. It contains large content boxes to add your information on topics like defining work and set responsibilities of team members. You can also showcase facts, figures, and other relevant content using this PPT layout. Grab it now.

Human Resource Metrics With New Hire Turnover Professional PDF
This slide showcases human resource dashboard that can help to track the KPIs that are time to fill, quality of hire, hiring source and new hire turnover. It also illustrates the performance score graph that can help to evaluate the recruitment efficiency of different HR employees. Pitch your topic with ease and precision using this Human Resource Metrics With New Hire Turnover Professional PDF. This layout presents information on Hiring Source, New Hire Turnover, Hr Employees Performance Score. It is also available for immediate download and adjustment. So, changes can be made in the color, design, graphics or any other component to create a unique layout.
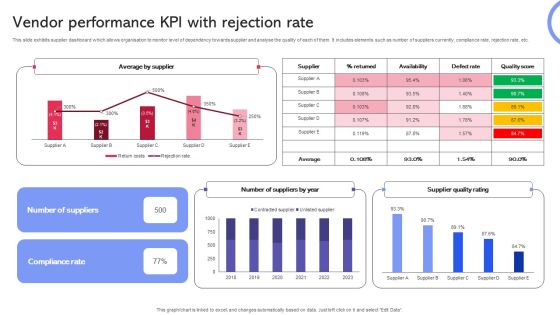
Vendor Performance KPI With Rejection Rate Inspiration PDF
This slide exhibits supplier dashboard which allows organisation to monitor level of dependency towards supplier and analyse the quality of each of them. It includes elements such as number of suppliers currently, compliance rate, rejection rate, etc. Pitch your topic with ease and precision using this Vendor Performance KPI With Rejection Rate Inspiration PDF. This layout presents information on Vendor Performance KPI, Rejection Rate. It is also available for immediate download and adjustment. So, changes can be made in the color, design, graphics or any other component to create a unique layout.
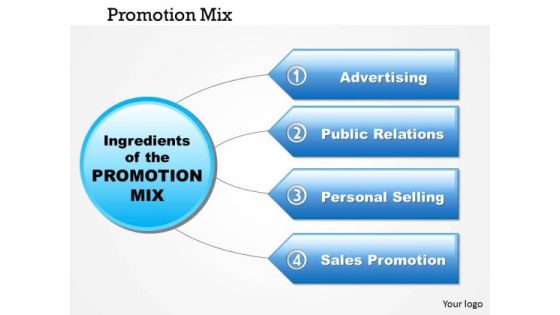
Business Framework Promotion Mix PowerPoint Presentation
This innovative diagram has been designed to display project management data. Use this diagram in business and marketing presentations. This diagram will enhance the quality of your presentations.

Set Of Informative Data Management Diagram Sample Ppt Presentation
This is a set of informative data management diagram sample ppt presentation. This is a ten stage process. The stages in this process are metadata, quality monitoring, presentation, operational data store, data rules, process flow, access analysis, source data, quality transformation, data flow.

Project Progress Review Report Ppt PowerPoint Presentation Gallery Example Introduction PDF
Presenting this set of slides with name project progress review report ppt powerpoint presentation gallery example introduction pdf. The topics discussed in these slides are project schedule, project financials, planned spend, actual spend, variance, resourcing costs, quality assurance, quality assurance. This is a completely editable PowerPoint presentation and is available for immediate download. Download now and impress your audience.
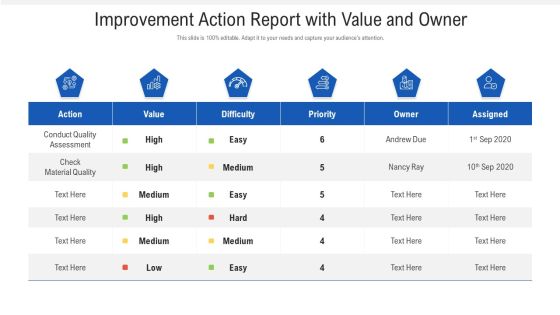
Improvement Action Report With Value And Owner Ppt PowerPoint Presentation Professional Themes PDF
Deliver an awe-inspiring pitch with this creative improvement action report with value and owner ppt powerpoint presentation professional themes pdf bundle. Topics like conduct quality assessment, check material quality, difficulty can be discussed with this completely editable template. It is available for immediate download depending on the needs and requirements of the user.

Data Validation Process With Improve And Monitor Ppt PowerPoint Presentation Summary Ideas PDF
Presenting data validation process with improve and monitor ppt powerpoint presentation summary ideas pdf to dispense important information. This template comprises six stages. It also presents valuable insights into the topics including analyze and catalog organizational data, determine and define organizational policies, evaluate data quality on basis of industrial benchmark, analyze and identify root cause for data corruption., overall impact analysis, process and govern to improve data quality as per standard, track data quality in continuity for performance. This is a completely customizable PowerPoint theme that can be put to use immediately. So, download it and address the topic impactfully.

Qa Management In Improvement Of Product Manufacturing Guidelines PDF
This slide represents the activities performed for assuring quality in manufacturing of products. It involves analyzing quality control data, identifying process improvements, performing root cause analysis and determining preventative actions. Persuade your audience using this qa management in improvement of product manufacturing guidelines pdf. This PPT design covers four stages, thus making it a great tool to use. It also caters to a variety of topics including analyzing quality control data, identifying process improvements, performing root cause analysis, determining preventative actions. Download this PPT design now to present a convincing pitch that not only emphasizes the topic but also showcases your presentation skills.
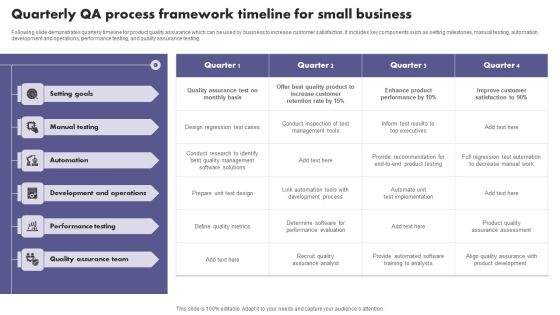
Quarterly QA Process Framework Timeline For Small Business Infographics PDF
Following slide demonstrates quarterly timeline for product quality assurance which can be used by business to increase customer satisfaction. It includes key components such as setting milestones, manual testing, automation, development and operations, performance testing, and quality assurance testing. Showcasing this set of slides titled Quarterly QA Process Framework Timeline For Small Business Infographics PDF. The topics addressed in these templates are Development And Operations, Performance Testing, Quality Assurance Team. All the content presented in this PPT design is completely editable. Download it and make adjustments in color, background, font etc. as per your unique business setting.

International Delivery Framework For Project Management And Team Engagement Ppt PowerPoint Presentation Model Infographics PDF
Presenting international delivery framework for project management and team engagement ppt powerpoint presentation model infographics pdf. to dispense important information. This template comprises two stages. It also presents valuable insights into the topics including enhanced roi, lower ro, quality, flexibility, scalability, best practices, requirement analysis, architecture design, offshore team, maintenance and support, solution deployment, quality assurance and testing, data migration, project management, domain expertise, business process transformation, technology expertise, consulting, knowledge management, quality processes, change management. This is a completely customizable PowerPoint theme that can be put to use immediately. So, download it and address the topic impactfully.
KPI Metrics For SQA Ppt PowerPoint Presentation Icon Deck PDF
This slide shows the KPI metrics which can be used by an organization to measure the software quality. It includes passed test defects fixed per day, Average time to test, quality ratio, etc. Showcasing this set of slides titled KPI Metrics For SQA Ppt PowerPoint Presentation Icon Deck PDF. The topics addressed in these templates are Quality Ratio, Kpis, Passed Tests. All the content presented in this PPT design is completely editable. Download it and make adjustments in color, background, font etc. as per your unique business setting.

Business Framework Project Management Data PowerPoint Presentation
This diagram displays push pull communication framework. This diagram may used to displays push pull strategy. Use this diagram in business presentations. This diagram will enhance the quality of your presentations.

Critical Surveys For Market Research Example Ppt Image
This is a critical surveys for market research example ppt image. This is a seven stage process. The stages in this process are determine research design, data collection, visualization and analysis, define research objective, instrument development, data quality check, reporting.

Stock Photo Black Brown Pie Chart For Business Result PowerPoint Slide
This high quality image is designed with pie chart. Use this image to make business reports. Use this outstanding image in presentations relating to data analysis and reports. Go ahead and add charm to your presentations.
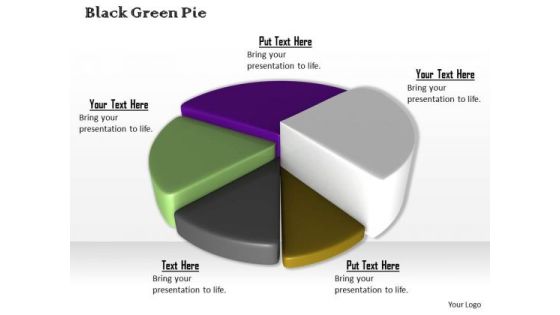
Stock Photo Colorful 3d Pie Chart For Business Result PowerPoint Slide
This high quality image is designed with pie chart. Use this image to make business reports. Use this outstanding image in presentations relating to data analysis and reports. Go ahead and add charm to your presentations.
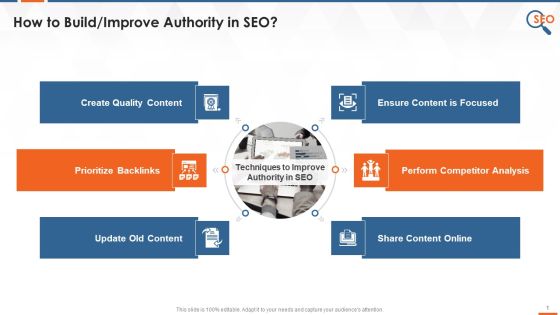
Techniques To Improve Authority In SEO Training Ppt
The purpose of this slide is to showcase the multiple techniques to build high authority in SEO, such as creating quality content, ensuring content is focused, prioritizing backlinks, performing competitor analysis, updating old content, and sharing content online.
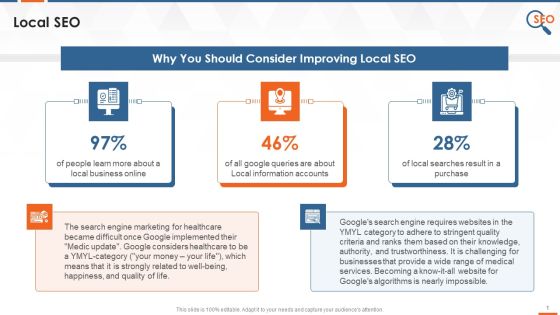
Local SEO For Healthcare Industry Is A Must Training Ppt
This slide covers as local SEO strategy for healthcare industry. It also depicts that Googles search engine requires websites in the YMYL category to adhere to stringent quality criteria and ranks them based on their knowledge, authority, and trustworthiness.
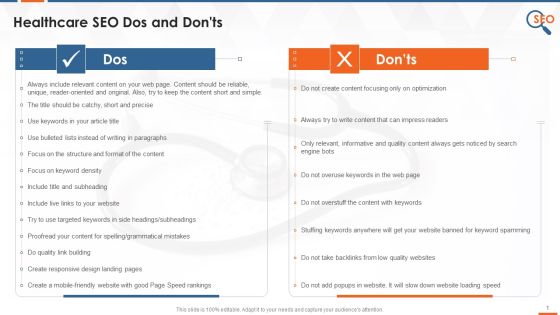
SEO Dos And Donts For Healthcare Firms Training Ppt
This slide covers dos and donts of the healthcare SEO such as creating landing pages with responsive design, optimizing for mobile, not taking backlinks from low quality websites, etc.

On Page SEO Significance And Ranking Parameters Training Ppt
The purpose of this slide is to provide a brief introduction regarding off-page SEO. It also highlights its significance and multiple ranking factors such as building quality backlinks, guest blogging, brand mentions, etc.
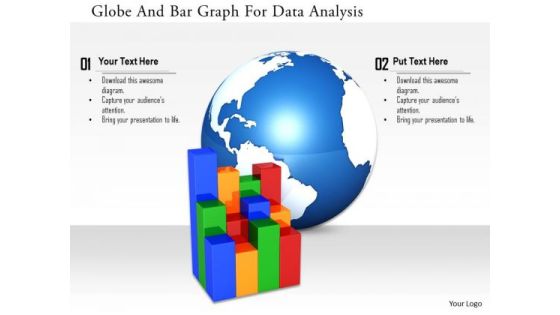
Stock Photo Globe And Bar Graph For Data Analysis Image Graphics For PowerPoint Slide
This image slide has been designed with business graph with globe in background. This image slide represents topics like global business, economic growth. This image will enhance the quality of your presentations.
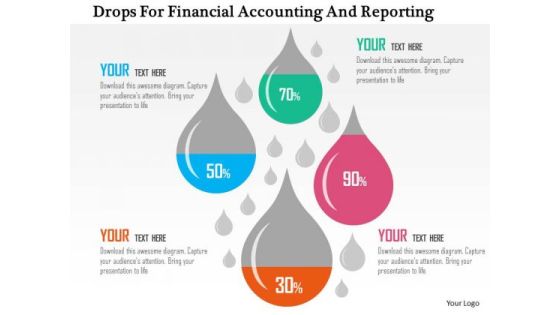
Business Diagram Drops For Financial Accounting And Reporting Presentation Template
This business diagram has been designed with drops displaying financial ratios. Download this diagram to depict financial and accounting ratios. Use this slide to build quality presentations for your viewers.
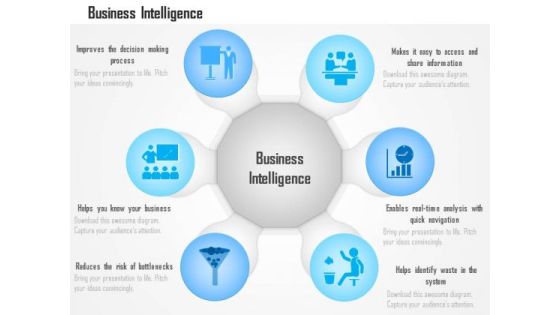
Business Diagram Benefits Advantages Of Business Intelligence Data Analytics Ppt Slide
This technology diagram has been designed with graphic of circular chart with various icons. This slide contains the concept of business intelligence data analytics. Explain advantages of business intelligence in any technical presentations with this quality diagram.

Data Service Analytics Diagram Ppt Inspiration
This is a data service analytics diagram ppt inspiration. This is a eight stage process. The stages in this process are traffic demand estimation, policy control analytics, data processing, device analytics, service quality analytics, charging verification, productivity, statistical research.
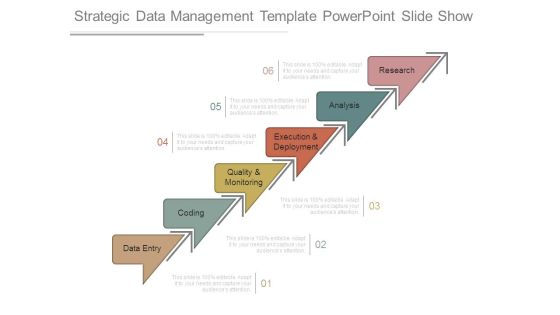
Strategic Data Management Template Powerpoint Slide Show
This is a strategic data management template powerpoint slide show. This is a six stage process. The stages in this process are research, analysis, execution and deployment, quality and monitoring, coding, data entry.
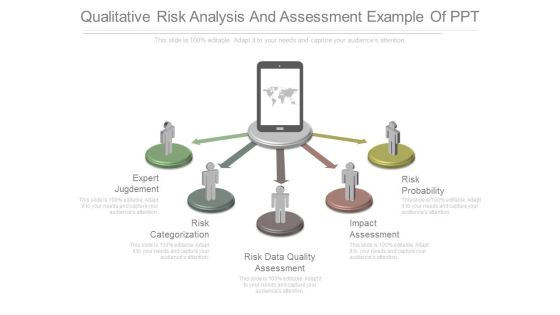
Qualitative Risk Analysis And Assessment Example Of Ppt
This is a qualitative risk analysis and assessment example of ppt. This is a five stage process. The stages in this process are expert jugdement, risk categorization, risk data quality assessment, impact assessment, risk probability.
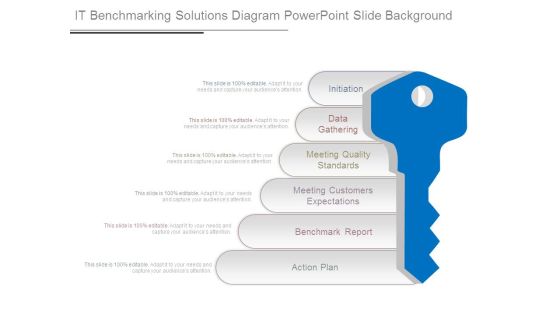
It Benchmarking Solutions Diagram Powerpoint Slide Background
This is a it benchmarking solutions diagram powerpoint slide background. This is a six stage process. The stages in this process are initiation, data gathering, meeting quality standards, meeting customers expectations, benchmark report, action plan.

Stock Photo 3d Globe With Social Web For Data Protection Concept PowerPoint Slide
Graphic of 3d globe and web has been used to craft this power point image template. This PPT contains the concept of data protection and social network. Use this PPT and build quality presentation for your viewers.

Illustration Of Save Money Concept Powerpoint Templates
This business slide has been designed with infographic square. These text boxes can be used for data representation. Use this diagram for your business presentations. Build a quality presentation for your viewers with this unique diagram.

4 Phases Of Data Interpretation And Evaluation Lifecycle Guidelines PDF
This slide demonstrates stages of data analytics and assessment lifecycle. It includes four phases such as ingestion, data quality and governance, data lake administration and analytics. Presenting 4 Phases Of Data Interpretation And Evaluation Lifecycle Guidelines PDF to dispense important information. This template comprises four stages. It also presents valuable insights into the topics including Ingestion, Data Quality And Governance, Analytics. This is a completely customizable PowerPoint theme that can be put to use immediately. So, download it and address the topic impactfully.
Retailing Approaches For Excellent End User Engagement And Experiences Tracking Essential Retail Slides PDF
This slide provides details regarding the dashboard for tracking retail store activities in terms of customer retention, rate of return, volume sales, etc. Deliver and pitch your topic in the best possible manner with this retailing approaches for excellent end user engagement and experiences tracking essential retail slides pdf Use them to share invaluable insights on tracking essential retail store activities dashboard and impress your audience. This template can be altered and modified as per your expectations. So, grab it now.

Data Governance And Data Management Pyramid Ppt Example
This is a data governance and data management pyramid ppt example. This is a five stage process. The stages in this process are data sets, analytical models, discovery, ingestion hdfs, visualize, data quality and management.

Annual Report Template Powerpoint Slide Information
This is a annual report template powerpoint slide information. This is a six stage process. The stages in this process are market expansion, supply chain, quality control, company philosophy, balance sheet, auditor letter.
Four Triangles With Globe Team Result Analysis Report Icons Powerpoint Templates
This good quality business PPT helps in clearly conveying your message to clients and audience. It contains graphics of four triangles. Download this diagram to depict global team planning and result analysis. Present your views using our innovative slide
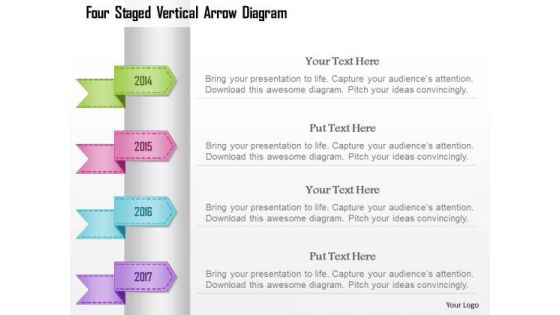
Busines Diagram Four Staged Vertical Arrow Diagram Presentation Template
Four staged vertical arrow diagram has been used to design this business diagram. This business diagram contains the concept of data representation. This pre designed high quality image slide will make your presentations simply the best.

Business Diagram Four Staged Torn Paper For Text Display PowerPoint Template
Four staged torn paper style text boxes has been used to design this power point template. This PPT contains the concept of text representation for business process. Use this PPT and build quality presentation for data and process related topics.

Case Study Of Using Analytical Solution To Monitor Gas Data Brochure PDF
Deliver an awe inspiring pitch with this creative case study of using analytical solution to monitor gas data brochure pdf bundle. Topics like identifying productivity and quality of hydrocarbon, identifying top of reservoir and quality of hydrocarbon, recognizing productive and non productive intervals can be discussed with this completely editable template. It is available for immediate download depending on the needs and requirements of the user.
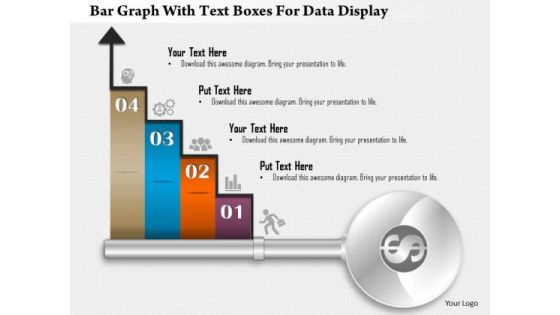
Business Diagram Bar Graph With Text Boxes For Data Display Presentation Template
Our above business diagram displays bar graph. It contains four steps on bar graph with icons. Use this diagram to display four stages of business growth. Download this Power Point slide to build quality presentation for your viewers.

Flow Chart Ppt PowerPoint Presentation Infographic Template Mockup
This is a flow chart ppt powerpoint presentation infographic template mockup. This is a four stage process. The stages in this process are define collection elements, create collection plans, perform, transaction, collect quality results.

Key Approaches For Data Migration Strategic Plan Demonstration PDF
The following slide highlights some relevant approaches for data migration to ensure data integrity. It includes components such as pre migration, migration, quality assurance and post migration. Presenting Key Approaches For Data Migration Strategic Plan Demonstration PDF to dispense important information. This template comprises four stages. It also presents valuable insights into the topics including Pre Migration, Quality Assurance, Post Migration. This is a completely customizable PowerPoint theme that can be put to use immediately. So, download it and address the topic impactfully.

Stock Photo Bar Graph With Growth Arrow PowerPoint Slide
This creative image displays design of Bar Graph with Growth Arrow. This image has been designed to depict business on an Upward Trend. Create an impact with this quality image and make professional presentations.
Business Diagram Three Colorful Balloons With Text PowerPoint Template
Three colorful balloons with text box has been used to craft this power point template slide. This PPt slide contains the concept of business data presentation. Use this PPT slide and build quality presentation on data related presentations.

Sales Quarterly Performance Review System Service Support Department Infographics PDF
This slide shows sales customer service division quarterly business review QBR. It provides information about quality, accuracy, absenteeism, attrition, call flow, employee tenure, etc. Pitch your topic with ease and precision using this Sales Quarterly Performance Review System Service Support Department Infographics PDF. This layout presents information on KPI, Goal, Quality Accuracy. It is also available for immediate download and adjustment. So, changes can be made in the color, design, graphics or any other component to create a unique layout.

Business Diagram Bar Graph For Result Display On Mobile Presentation Template
This Power Point template has been designed with graphic of bar graph on mobile phone. This business diagram can be used to make business reports. Download this Power Point slide to build quality presentation for your viewers.

Business Process Management Lifecycle Diagram Powerpoint Slides Deck
This is a business process management lifecycle diagram powerpoint slides deck. This is a seven stage process. The stages in this process are business process management lifecycle, design, reporting and analytics, technology, monitoring, execution, optimization, quality monitoring.

Business Diagram Four Staged Road Sign Diagram For Text Representation Presentation Template
Four staged road sign diagram has been used to design this power point template. This PPT contains the concept of text and data representation. Use this PPT and build quality presentation for your viewers.

Cost Management System Diagram Ppt Slide Show
This is a cost management system diagram ppt slide show. This is a seven stage process. The stages in this process are research and development, quality control, marketing, financial accounting, production reporting, inventory management, production planning and scheduling, cost accounting.
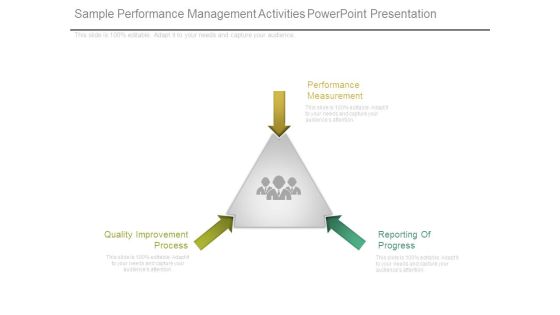
Sample Performance Management Activities Powerpoint Presentation
This is a sample performance management activities powerpoint presentation. This is a four stage process. The stages in this process are quality improvement process, performance measurement, reporting of progress.

Improved Search Engine Ranking Example Powerpoint Slide Download
This is a improved search engine ranking example powerpoint slide download. This is a eight stage process. The stages in this process are seo success, word occurrences, page depth, headings, quality content, manual boosting, word position, meta data.

Business Model Ppt PowerPoint Presentation Portfolio File Formats
This is a business model ppt powerpoint presentation portfolio file formats. This is a four stage process. The stages in this process are future potential, high quality user data, premium targeted ads, high profit potential.

Business Process Management Powerpoint Slides Download
This is a business process management powerpoint slides download. This is a eight stage process. The stages in this process are customer care, it infrastructure, data, suppliers, it system, market research, quality monitoring, tech support.

Business Diagram Circles With Pencils For Business Structures Presentation Template
This business diagram has been designed with graphic of pencils with text circles. This slide helps to depict business data and process. Use this slide to build quality presentations for your viewers.
Linear Arrow Process Diagram With Icons Powerpoint Template
This business slide has been designed with infographic of linear arrow. This arrow infographic can be used for data representation. Use this diagram for your business presentations. Build a quality presentation for your viewers with this unique diagram.

Planned Statistics Assessment Template Ppt Diagrams
This is a planned statistics assessment template ppt diagrams. This is a eight stage process. The stages in this process are quality context, competitors, stakeholders and users, processes and data, resources, evaluation, tools and techniques, structure.
Four Staged Pie Chart With Icons Powerpoint Templates
A good quality PowerPoint template is the foundation for every presentation. This PPT slide contains graphics of pie chart. Download this slide to outline business data. This slide is innovatively designed to highlight your worthy views.

Portfolio Revision Methodology Powerpoint Topics
This is a portfolio revision methodology powerpoint topics. This is a two stage process. The stages in this process are current portfolio, new portfolio, shy short term treasuries, tip inflation protected bonds, stocks, data analysis, shv cash equivalent, vtip short term inflation protected bonds, agg u s high quality bonds, bandx international high quality bonds, vwob: emerging markets government bonds, stocks no changes to existing tickers.

Portfolio Revision Strategy Ppt Slide Templates
This is a portfolio revision strategy ppt slide templates. This is a two stage process. The stages in this process are shy short term treasuries, tip inflation protected bonds, stocks, shv cash equivalent , vtip short term inflation protected bonds, agg u s high quality bonds, bandx international high quality bonds, vwob emerging markets government bonds, stocks no changes to existing tickers, current portfolio, data analysis, new portfolio.

 Home
Home