Quality Check

Onboarding Journey For Effective Client Communication Customer Onboarding Journey Survey Results Infographics PDF
This exhibits the survey results for client onboarding journey. Major results covered are customers change brands if purchase procedure is difficult, customers prefer personalization, highly engaged users make more purchases, etc. Take your projects to the next level with our ultimate collection of Onboarding Journey For Effective Client Communication Customer Onboarding Journey Survey Results Infographics PDF. Slidegeeks has designed a range of layouts that are perfect for representing task or activity duration, keeping track of all your deadlines at a glance. Tailor these designs to your exact needs and give them a truly corporate look with your own brand colors they will make your projects stand out from the rest.

Comprehensive Resource Guide To Master GPT 3 Risks And Limitations Of Using GPT 3 Technology Slides PDF
This slide showcases restrictions and risks of GPT 3 that hinder its overall performance. It include information about mimicry of human text, decreased accuracy in answers and general bias. Take your projects to the next level with our ultimate collection of Comprehensive Resource Guide To Master GPT 3 Risks And Limitations Of Using GPT 3 Technology Slides PDF. Slidegeeks has designed a range of layouts that are perfect for representing task or activity duration, keeping track of all your deadlines at a glance. Tailor these designs to your exact needs and give them a truly corporate look with your own brand colors they will make your projects stand out from the rest.
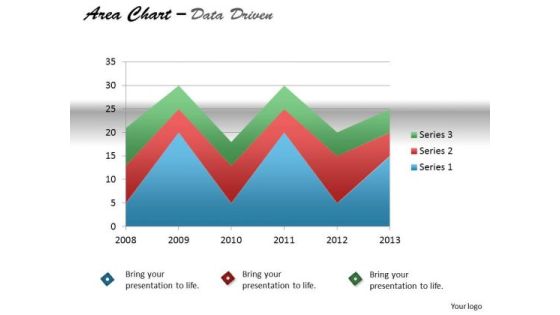
Quantitative Data Analysis Driven Display Series With Area Chart PowerPoint Slides Templates
Our quantitative data analysis driven display series with area chart powerpoint slides Templates Enjoy Drama. They Provide Entertaining Backdrops.
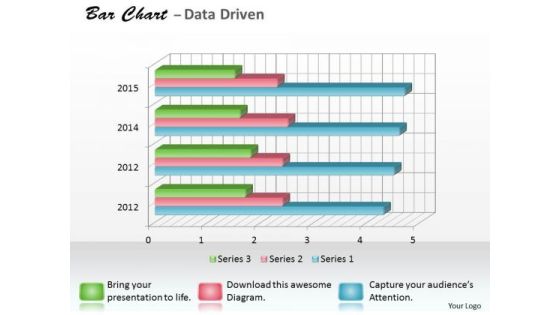
Data Analysis Programs 3d Bar Chart For Research In Statistics PowerPoint Templates
Draw It Out On Our data analysis programs 3d bar chart for research in statistics Powerpoint Templates . Provide Inspiration To Your Colleagues.
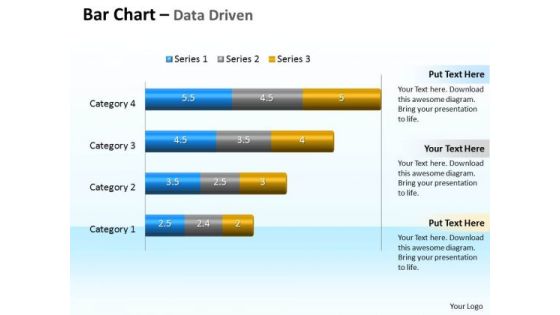
Data Analysis Programs 3d Bar Chart To Compare Categories PowerPoint Templates
Discover Decisive Moments With Our data analysis programs 3d bar chart to compare categories Powerpoint Templates . They Help Make That Crucial Difference.
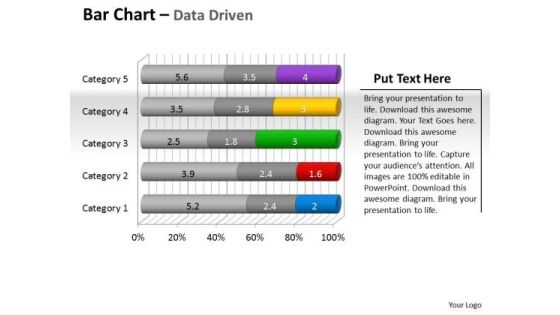
Data Analysis Programs 3d Bar Chart To Put Information PowerPoint Templates
Draw Up Your Agenda On Our data analysis programs 3d bar chart to put information Powerpoint Templates . Coax Your Audience Into Acceptance.
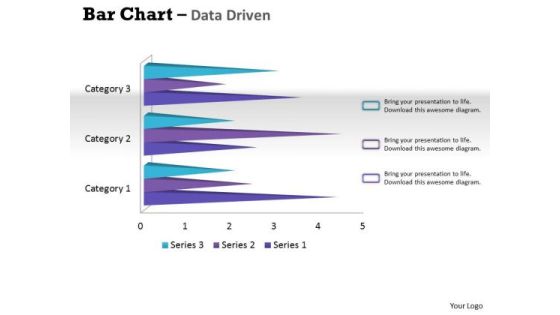
Data Analysis Techniques 3d Bar Chart For Financial Solutions PowerPoint Templates
Make Your Dreams A Reality With Our data analysis techniques 3d bar chart for financial solutions Powerpoint Templates . Your Ideas Will Begin To Take Shape.
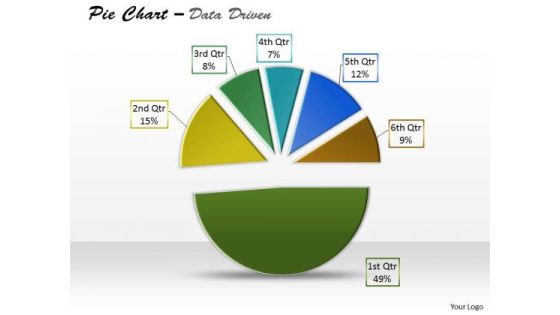
Data Analysis Template Driven Express Business Facts Pie Chart PowerPoint Slides Templates
Display Your Drive On Our data analysis template driven express business facts pie chart powerpoint slides Templates . Invigorate The Audience With Your Fervor.

Data Analysis Template Driven Ineract With Stock Chart PowerPoint Slides Templates
Drive Your Passion With Our data analysis template driven ineract with stock chart powerpoint slides Templates . Steer Yourself To Achieve Your Aims.

Data Analysis Template Driven Line Chart Business Graph PowerPoint Slides Templates
Bottle Your Thoughts In Our data analysis template driven line chart business graph powerpoint slides Templates . Pass It Around For Your Audience To Sip.
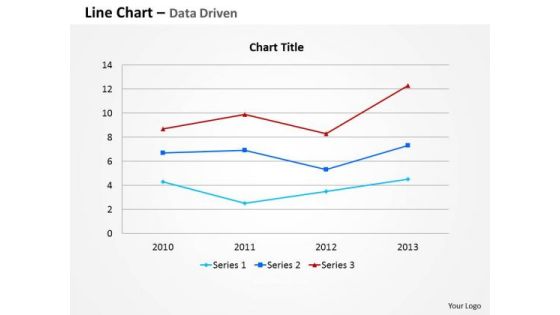
Data Analysis Template Driven Line Chart For Business Information PowerPoint Slides Templates
Your Thoughts Are Dripping With Wisdom. Lace It With Our data analysis template driven line chart for business information powerpoint slides Templates .
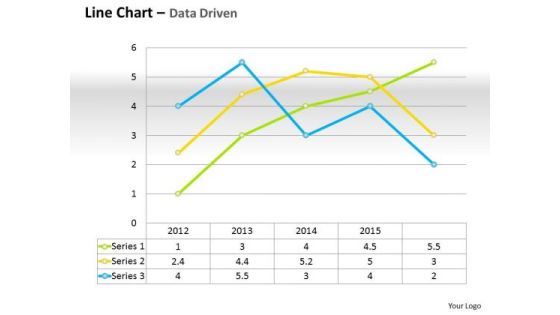
Data Analysis Template Driven Line Chart For Business Performance PowerPoint Slides Templates
Do Not Allow Things To Drift. Ring In Changes With Our data analysis template driven line chart for business performance powerpoint slides Templates .
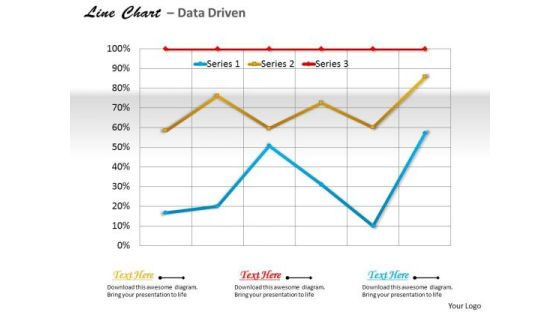
Data Analysis Template Driven Line Chart For Business Trends PowerPoint Slides Templates
Use Our data analysis template driven line chart for business trends powerpoint slides Templates As The Bit. Drill Your Thoughts Into Their Minds.

Data Analysis Template Driven Stock Chart For Market Trends PowerPoint Slides Templates
Drive Your Team Along The Road To Success. Take The Wheel With Our data analysis template driven stock chart for market trends powerpoint slides Templates .
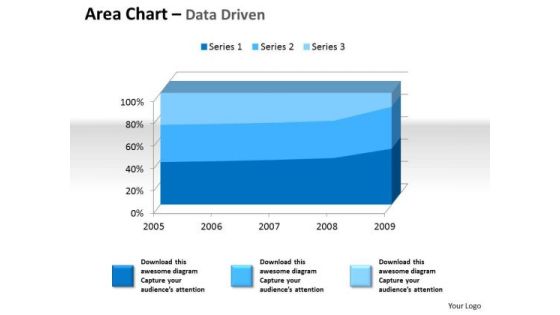
Examples Of Data Analysis Market 3d Area Chart For Quantiative PowerPoint Templates
Drum It Up With Our examples of data analysis market 3d area chart for quantiative Powerpoint Templates . Your Thoughts Will Raise The Tempo.

Examples Of Data Analysis Market 3d Business Intelligence And PowerPoint Templates
Our examples of data analysis market 3d business intelligence and Powerpoint Templates Are Dual Purpose. They Help Instruct And Inform At The Same Time.
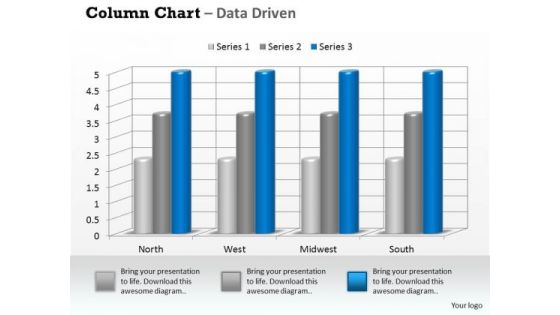
Examples Of Data Analysis Market 3d Business On Regular Intervals PowerPoint Templates
Drum It Out Loud And Clear On Our examples of data analysis market 3d business on regular intervals Powerpoint Templates . Your Words Will Ring In Their Ears.

Examples Of Data Analysis Market 3d Business Trend Series Chart PowerPoint Templates
Duct It Through With Our examples of data analysis market 3d business trend series chart Powerpoint Templates . Your Ideas Will Reach Into Their Minds Intact.

Examples Of Data Analysis Market Driven Plotting The Business Values PowerPoint Slides Templates
Ring The Duck With Our examples of data analysis market driven plotting the business values powerpoint slides Templates . Acquire The Points With Your Ideas.

Examples Of Data Analysis Market Driven Radar Chart To Compare PowerPoint Slides Templates
Rely On Our examples of data analysis market driven radar chart to compare powerpoint slides Templates In Any Duel. They Will Drive Home Your Point.
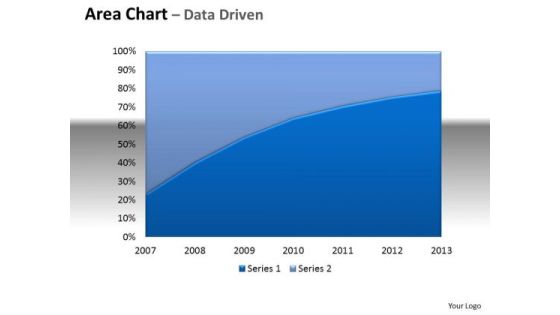
Financial Data Analysis Area Chart With Plotted Line Center PowerPoint Templates
Be The Doer With Our financial data analysis area chart with plotted line center Powerpoint Templates . Put Your Thoughts Into Practice.
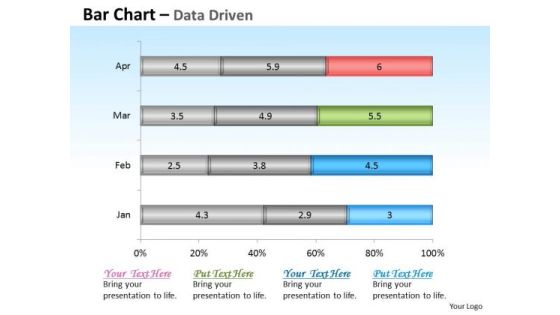
Financial Data Analysis Driven Base Bar Chart Design PowerPoint Slides Templates
Get The Domestics Right With Our financial data analysis driven base bar chart design powerpoint slides Templates . Create The Base For Thoughts To Grow.

Financial Data Analysis Driven Compare Market Share Of Brand PowerPoint Templates
Doll Up Your Thoughts With Our financial data analysis driven compare market share of brand Powerpoint Templates . They Will Make A Pretty Picture.
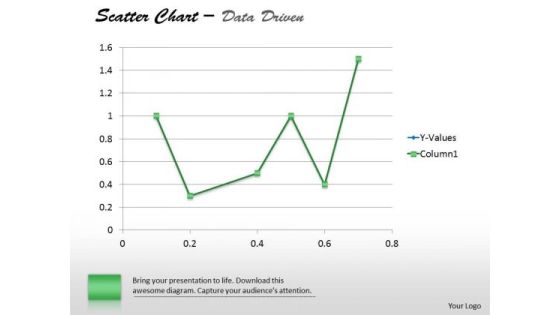
Financial Data Analysis Driven Demonstrate Statistics With Scatter Chart PowerPoint Slides Templates
Establish The Dominance Of Your Ideas. Our financial data analysis driven demonstrate statistics with scatter chart powerpoint slides Templates Will Put Them On Top.
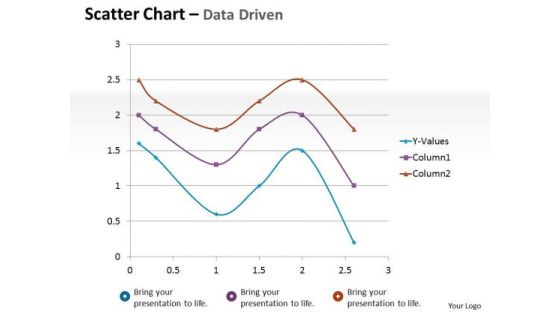
Financial Data Analysis Driven Scatter Chart Mathematical Diagram PowerPoint Slides Templates
Dominate Proceedings With Your Ideas. Our financial data analysis driven scatter chart mathematical diagram powerpoint slides Templates Will Empower Your Thoughts.
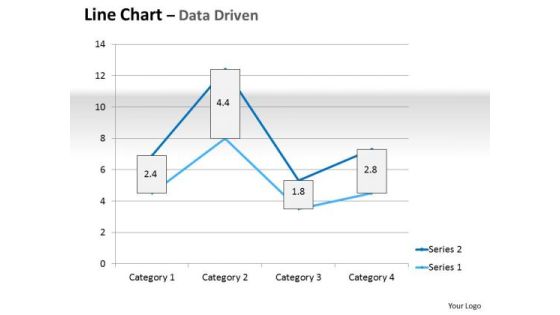
Multivariate Data Analysis Driven Line Chart Market Graph PowerPoint Slides Templates
Plan For All Contingencies With Our multivariate data analysis driven line chart market graph powerpoint slides Templates . Douse The Fire Before It Catches.
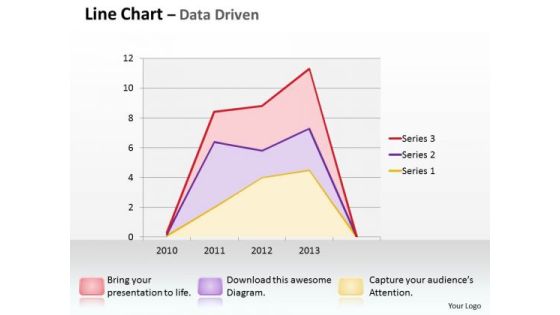
Multivariate Data Analysis Driven Line Chart Shows Revenue Trends PowerPoint Slides Templates
Good Camaraderie Is A Key To Teamwork. Our multivariate data analysis driven line chart shows revenue trends powerpoint slides Templates Can Be A Cementing Force.
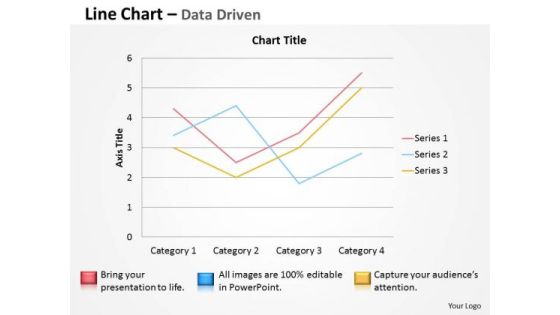
Multivariate Data Analysis Driven Line Chart To Demonstrate PowerPoint Slides Templates
Brace Yourself, Arm Your Thoughts. Prepare For The Hustle With Our multivariate data analysis driven line chart to demonstrate powerpoint slides Templates .
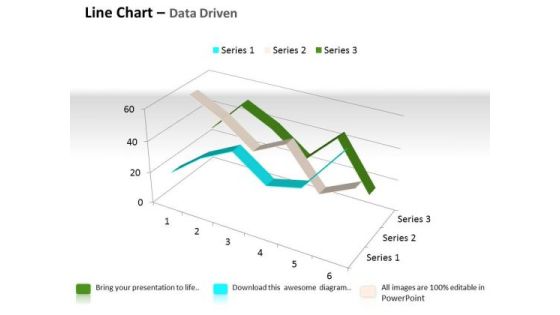
Quantitative Data Analysis 3d Line Chart For Comparison Of PowerPoint Templates
Touch Base With Our quantitative data analysis 3d line chart for comparison of Powerpoint Templates . Review Your Growth With Your Audience.

Quantitative Data Analysis 3d Pie Chart For Business Process PowerPoint Templates
Put Them On The Same Page With Our quantitative data analysis 3d pie chart for business process Powerpoint Templates . Your Team Will Sing From The Same Sheet.
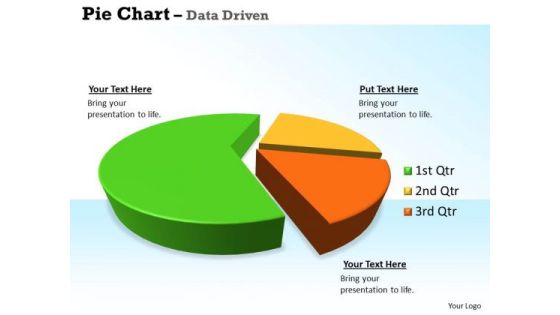
Quantitative Data Analysis 3d Pie Chart For Business Statistics PowerPoint Templates
Our quantitative data analysis 3d pie chart for business statistics Powerpoint Templates Allow You To Do It With Ease. Just Like Picking The Low Hanging Fruit.

Quantitative Data Analysis Driven Economic Status Line Chart PowerPoint Slides Templates
Be The Dramatist With Our quantitative data analysis driven economic status line chart powerpoint slides Templates . Script Out The Play Of Words.

Quantitative Data Analysis Driven Economic With Column Chart PowerPoint Slides Templates
Add Some Dramatization To Your Thoughts. Our quantitative data analysis driven economic with column chart powerpoint slides Templates Make Useful Props.
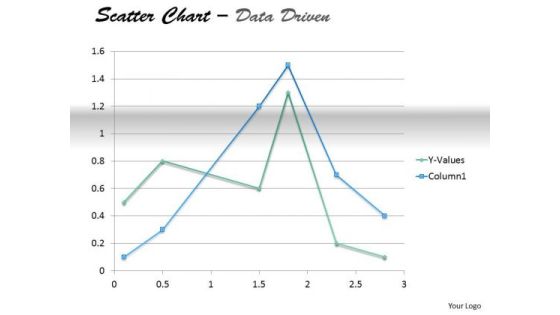
Examples Of Data Analysis Market Driven Present In Scatter Chart PowerPoint Slides Templates
Your Thoughts Will Take To Our examples of data analysis market driven present in scatter chart powerpoint slides Templates Like A Duck To Water. They Develop A Binding Affinity.
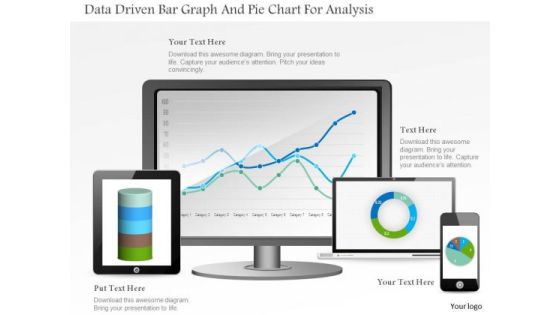
Business Diagram Data Driven Bar Graph And Pie Chart For Analysis PowerPoint Slide
This PowerPoint template displays technology gadgets with various business charts. Use this diagram slide, in your presentations to make business reports for statistical analysis. You may use this diagram to impart professional appearance to your presentations.

Business Diagram Tablet With Pie And Business Bar Graph For Result Analysis PowerPoint Slide
This PowerPoint template displays technology gadgets with various business charts. Use this diagram slide, in your presentations to make business reports for statistical analysis. You may use this diagram to impart professional appearance to your presentations.

Business Diagram Alarm Clock With Pie Chart For Result Analysis PowerPoint Slide
This business slide displays alarm clock with pie chart. This diagram is a data visualization tool that gives you a simple way to present statistical information. This slide helps your audience examine and interpret the data you present.
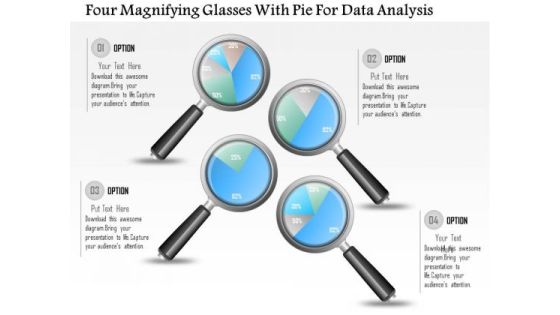
Business Diagram Four Magnifying Glasses With Pie For Data Analysis PowerPoint Slide
This business diagram displays graphic of pie charts in shape of magnifying glasses This business slide is suitable to present and compare business data. Use this diagram to build professional presentations for your viewers.
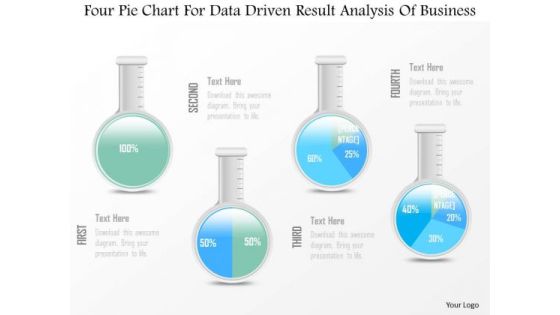
Business Diagram Four Pie Chart For Data Driven Result Analysis Of Business PowerPoint Slide
This business diagram displays graphic of pie charts in shape of flasks. This business slide is suitable to present and compare business data. Use this diagram to build professional presentations for your viewers.
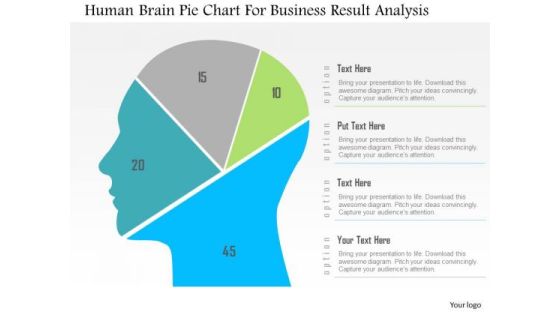
Business Diagram Human Brain Pie Chart For Business Result Analysis PowerPoint Slide
This diagram displays human face graphic divided into sections. This section can be used for data display. Use this diagram to build professional presentations for your viewers.
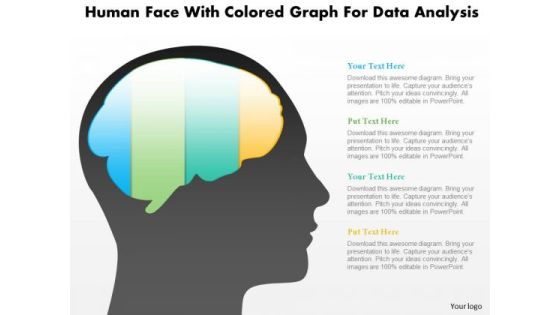
Business Diagram Human Face With Colored Graph For Data Analysis PowerPoint Slide
This diagram displays human face graphic with colored graph. This diagram can be used to represent strategy, planning, thinking of business plan. Display business options in your presentations by using this creative diagram.

Software Testing Service Delivery Excellence Model Mockup PDF
This slide showcases delivery excellence framework for software testing services which helps integrate business processes across diverse technologies. It provides information regarding end to end testing, test automation, data testing and security testing. Showcasing this set of slides titled Software Testing Service Delivery Excellence Model Mockup PDF. The topics addressed in these templates are Performance Testing, Digital Test Assurance, Security Testing. All the content presented in this PPT design is completely editable. Download it and make adjustments in color, background, font etc. as per your unique business setting.

Business Diagram Extract Transform Load Etl Business Intelligence Bug Data Analysis Pipeline Ppt Sli
This PowerPoint template has been designed with graphic of server. This diagram depicts the concept of ETL business intelligence with extract transform load. This slide also helps to display the data analysis pipeline.

Picture Of Trade Secret Security Merits Ppt PowerPoint Presentation Model Shapes PDF
Pitch your topic with ease and precision using this picture of trade secret security merits ppt powerpoint presentation model shapes pdf. This layout presents information on trade secret doe not require registration cost, they have immediate effect, they do not require compliance with official procedures such as disclosure of information to any government authority, they are not limited with time unless patents are not revealed to the public. It is also available for immediate download and adjustment. So, changes can be made in the color, design, graphics or any other component to create a unique layout.
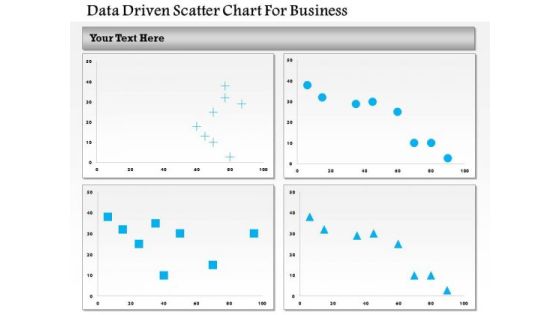
Business Diagram Data Driven Scatter Chart For Business PowerPoint Slide
This business diagram has been designed with four comparative charts. This slide suitable for data representation. You can also use this slide to present business analysis and reports. Use this diagram to present your views in a wonderful manner.

Information Security Storage Limitation Principle Of GDPR Law Designs PDF
This slide conveys the GDPR laws storage limitation principle, which prohibits you from holding personal data for longer than is required and requires you to justify your reasons for maintaining data. Get a simple yet stunning designed Information Security Storage Limitation Principle Of GDPR Law Designs PDF. It is the best one to establish the tone in your meetings. It is an excellent way to make your presentations highly effective. So, download this PPT today from Slidegeeks and see the positive impacts. Our easy to edit Information Security Storage Limitation Principle Of GDPR Law Designs PDF can be your go to option for all upcoming conferences and meetings. So, what are you waiting for Grab this template today.
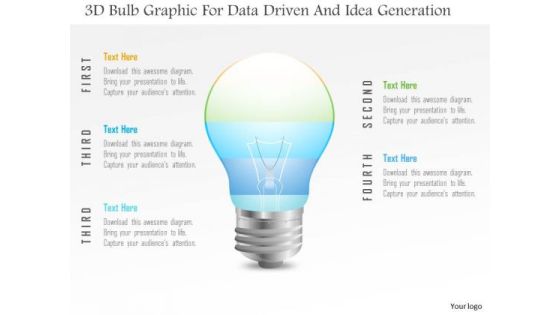
Business Diagram 3d Bulb Graphic For Data Driven And Idea Generation PowerPoint Slide
This Power Point template has been designed with 3d bulb graphic. Use this slide to represent technology idea and strategy concepts. Download this diagram for your business presentations and get exclusive comments on your efforts.
Business Diagram 3d Capsule With Multiple Icons For Business Data Flow PowerPoint Slide
This diagram has been designed with 3d graphic of capsule with multiple icons. This data driven PowerPoint slide can be used to give your presentations more effective look. It helps in clearly conveying your message to clients and audience.

Business Diagram 3d Colorful Pie Graph With Magnifier Data Search PowerPoint Slide
This business slide displays 3d colorful pie graph with magnifier. This diagram is a data visualization tool that gives you a simple way to present statistical information. This slide helps your audience examine and interpret the data you present.
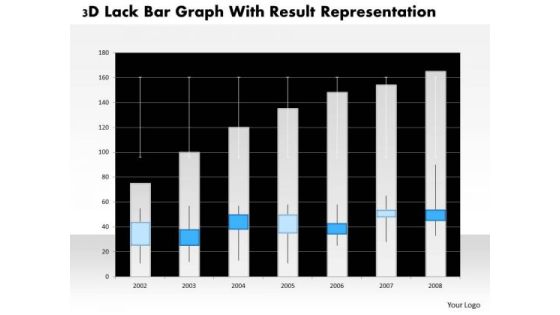
Business Diagram 3d Lack Bar Graph With Result Representation PowerPoint Slide
This business diagram has graphic of 3d lack bar graph. This diagram is a data visualization tool that gives you a simple way to present statistical information. This slide helps your audience examine and interpret the data you present.
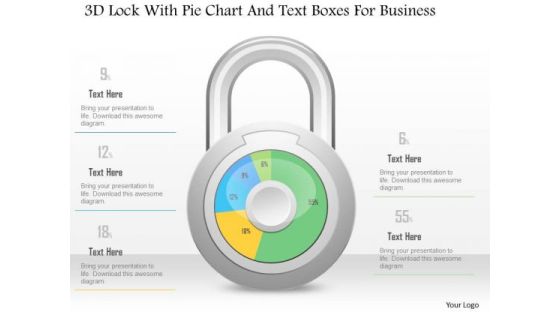
Business Diagram 3d Lock With Pie Chart And Text Boxes For Business PowerPoint Slide
This Power Point diagram has been crafted with pie chart in shape of lock. It contains diagram of lock pie chart to compare and present data in an effective manner. Use this diagram to build professional presentations for your viewers.

Business Diagram 3d Lock With Pie Graph For Result Representation PowerPoint Slide
This Power Point diagram has been crafted with pie chart in shape of lock. It contains diagram of lock pie chart to compare and present data in an effective manner. Use this diagram to build professional presentations for your viewers.

Business Diagram 3d Pencil With Text Boxes For Representation PowerPoint Slide
This Power Point diagram displays graphic of pencil with icons and text spaces. It contains diagram of colorful pencil for data display. Use this diagram to build professional presentations for your viewers.
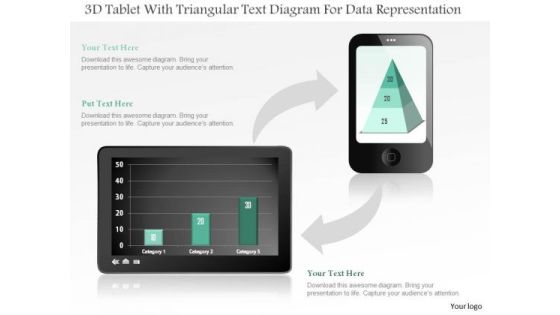
Business Diagram 3d Tablet With Triangular Text Diagram For Data Representation PowerPoint Slide
This business diagram displays bar graph on tablet and pyramid chart on mobile phone. Use this diagram, to make reports for interactive business presentations. Create professional presentations using this diagram.

Business Diagram 3d Thumb Chart And Tablet For Data Representation PowerPoint Slide
This business diagram displays graphic of 3d thumb up chart with icons on computer screen. This business slide contains the concept of business data representation. Use this diagram to build professional presentations for your viewers.
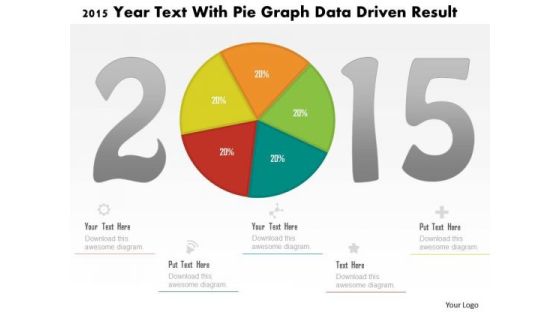
Business Diagram 2015 Year Text With Pie Graph Data Driven Result PowerPoint Slide
This business diagram displays 2015 year numbers with pie chart. This diagram is suitable to display business strategy for year 2015. Download this professional slide to present information in an attractive manner

Business Diagram Battery Connected With Bulb For Idea Generation PowerPoint Slide
This business slide displays battery icon connected with bulb. This diagram is a data visualization tool that gives you a simple way to present statistical information. This slide helps your audience examine and interpret the data you present.
Business Diagram Battery Icon With Power Icons Energy Technology PowerPoint Slide
This business diagram displays battery icon with power charging. Use this diagram, in your presentations to display energy saving, battery and technology. Create professional presentations using this diagram slide.
 Home
Home
