AI PPT Maker
Templates
PPT Bundles
Design Services
Business PPTs
Business Plan
Management
Strategy
Introduction PPT
Roadmap
Self Introduction
Timelines
Process
Marketing
Agenda
Technology
Medical
Startup Business Plan
Cyber Security
Dashboards
SWOT
Proposals
Education
Pitch Deck
Digital Marketing
KPIs
Project Management
Product Management
Artificial Intelligence
Target Market
Communication
Supply Chain
Google Slides
Research Services
 One Pagers
All Categories
-
Home
- Customer Favorites
- Quality Assurance Dashboard
Quality Assurance Dashboard

Business And Strategy 8 Steps Quality Circle Process Chart Ppt Development
We present our business and strategy 8 steps quality circle process chart ppt development.Download our Competition PowerPoint Templates because It will Strengthen your hand with your thoughts. They have all the aces you need to win the day. Present our Marketing PowerPoint Templates because Our PowerPoint Templates and Slides will let your words and thoughts hit bullseye everytime. Use our Arrows PowerPoint Templates because Our PowerPoint Templates and Slides will Embellish your thoughts. They will help you illustrate the brilliance of your ideas. Use our Business PowerPoint Templates because Timeline crunches are a fact of life. Meet all deadlines using our PowerPoint Templates and Slides. Present our Circle Charts PowerPoint Templates because Our PowerPoint Templates and Slides will let you Hit the target. Go the full distance with ease and elan.Use these PowerPoint slides for presentations relating to Achievement, arrow, business, chart, communication, competition, development, diagram, direction, financial, forward, graphic, growth, increase, investment, leadership, management, marketing, moving, organization, presentation, profit, progress, report, representation, shape, sign, stakeholder, success, symbol, target, teamwork, tool, upwards, way, win. The prominent colors used in the PowerPoint template are Blue, Gray, Black.
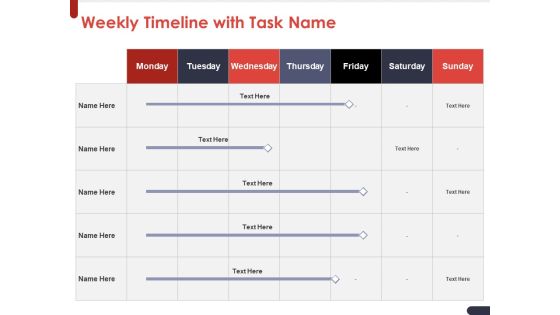
Project Quality Planning And Controlling Weekly Timeline With Task Name Diagrams PDF
Manage your complex projects and organize them simultaneously with this detailed Gantt Chart PowerPoint Template. Track your milestones, tasks, phases, activities, subtasks amongst other constituents that will give you an updated visual of your project. Reflect your planning horizon and capture your release plan in one view with this Gantt Chart PowerPoint presentation template. You can plot various dependencies directly on this Timeline PowerPoint Presentation Layout to see which tasks are still in the pipeline and how the delays in them are impacting the schedules and deadlines of the project. Apart from this, you can also share this updated visual with your team members and stakeholders, thus making it a resourceful tool to be incorporated in your business structure. Not only this but also the editable layout of this slide helps you to add your data and statistics at your convenience.
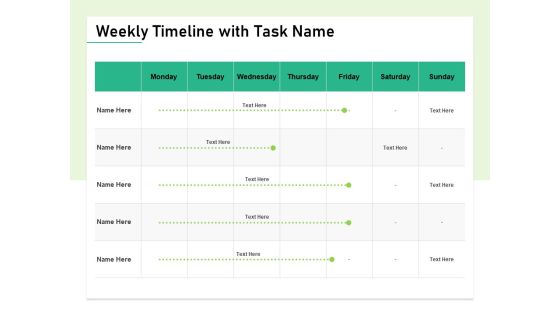
Quality Management Plan QMP Weekly Timeline With Task Name Infographics PDF
Manage your complex projects and organize them simultaneously with this detailed Gantt Chart PowerPoint Template. Track your milestones, tasks, phases, activities, subtasks amongst other constituents that will give you an updated visual of your project. Reflect your planning horizon and capture your release plan in one view with this Gantt Chart PowerPoint presentation template. You can plot various dependencies directly on this Timeline PowerPoint Presentation Layout to see which tasks are still in the pipeline and how the delays in them are impacting the schedules and deadlines of the project. Apart from this, you can also share this updated visual with your team members and stakeholders, thus making it a resourceful tool to be incorporated in your business structure. Not only this but also the editable layout of this slide helps you to add your data and statistics at your convenience.
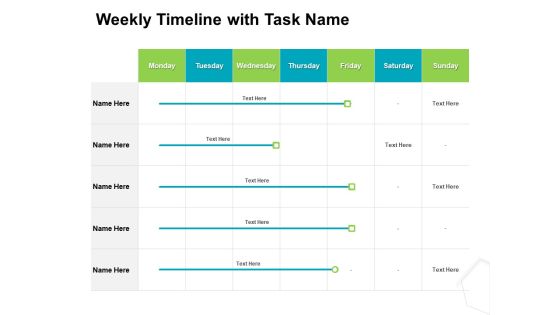
Project Quality Management Plan Weekly Timeline With Task Name Designs PDF
Manage your complex projects and organize them simultaneously with this detailed Gantt Chart PowerPoint Template. Track your milestones, tasks, phases, activities, subtasks amongst other constituents that will give you an updated visual of your project. Reflect your planning horizon and capture your release plan in one view with this Gantt Chart PowerPoint presentation template. You can plot various dependencies directly on this Timeline PowerPoint Presentation Layout to see which tasks are still in the pipeline and how the delays in them are impacting the schedules and deadlines of the project. Apart from this, you can also share this updated visual with your team members and stakeholders, thus making it a resourceful tool to be incorporated in your business structure. Not only this but also the editable layout of this slide helps you to add your data and statistics at your convenience.
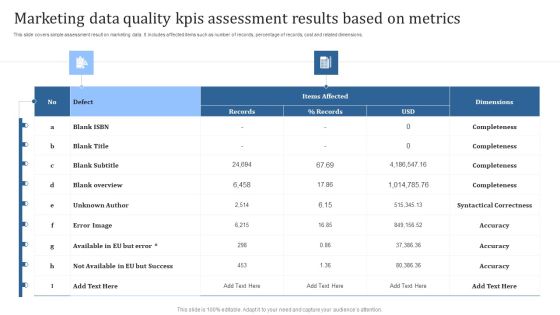
Marketing Data Quality Kpis Assessment Results Based On Metrics Summary PDF
This slide covers simple assessment result on marketing data. It includes affected items such as number of records, percentage of records, cost and related dimensions. Showcasing this set of slides titled Error Image, Unknown Author, Blank Overview. The topics addressed in these templates are Error Image, Unknown Author, Blank Overview. All the content presented in this PPT design is completely editable. Download it and make adjustments in color, background, font etc. as per your unique business setting.

Administered Data And Analytic Quality Playbook Ppt PowerPoint Presentation Complete Deck With Slides
Induce strategic thinking by presenting this complete deck. Enthrall your audience by deploying this thought provoking PPT deck. It can be downloaded in both standard and widescreen aspect ratios, thus making it a complete package to use and deploy. Convey your thoughts and actions using the thrity eight slides presented in this complete deck. Additionally, feel free to alter its components like color, graphics, design, etc, to create a great first impression. Grab it now by clicking on the download button below.
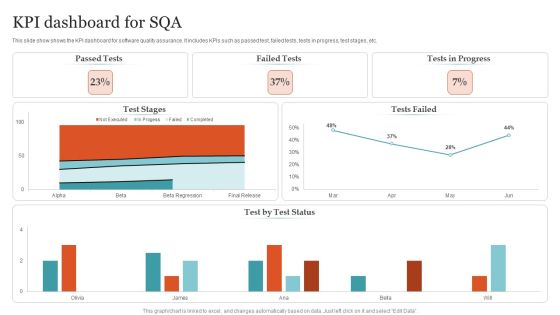
KPI Dashboard For SQA Ppt PowerPoint Presentation Gallery Structure PDF
This slide show shows the KPI dashboard for software quality assurance. It includes KPIs such as passed test, failed tests, tests in progress, test stages, etc. Pitch your topic with ease and precision using this KPI Dashboard For SQA Ppt PowerPoint Presentation Gallery Structure PDF. This layout presents information on Passed Tests, Failed Tests, Tests Progress . It is also available for immediate download and adjustment. So, changes can be made in the color, design, graphics or any other component to create a unique layout.
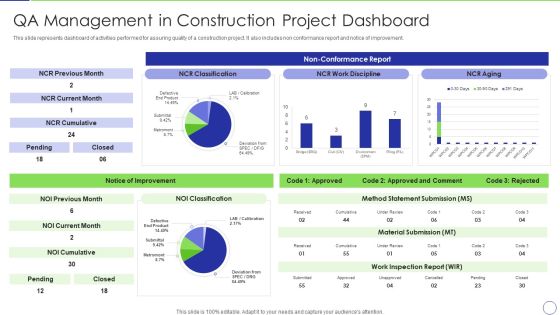
Qa Management In Construction Project Dashboard Information PDF
This slide represents dashboard of activities performed for assuring quality of a construction project. It also includes non conformance report and notice of improvement. Showcasing this set of slides titled qa management in construction project dashboard information pdf. The topics addressed in these templates are qa management in construction project dashboard. All the content presented in this PPT design is completely editable. Download it and make adjustments in color, background, font etc. as per your unique business setting.
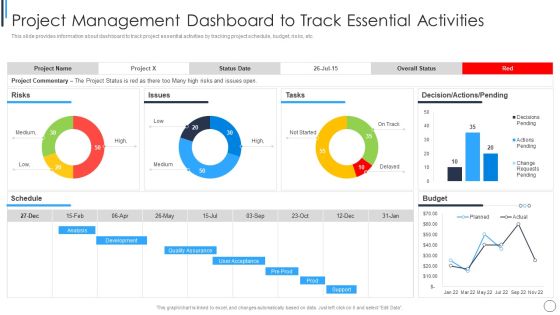
Playbook For Successful Project Management Project Management Dashboard Information PDF
This slide provides information about dashboard to track project essential activities by tracking project schedule, budget, risks, etc.Deliver an awe inspiring pitch with this creative Playbook For Successful Project Management Project Management Dashboard Information PDF bundle. Topics like Quality Assurance, Development, Analysis can be discussed with this completely editable template. It is available for immediate download depending on the needs and requirements of the user.

Dashboard Ppt PowerPoint Presentation Themes
This is a dashboard ppt powerpoint presentation themes. This is a two stage process. The stages in this process are low, high, poor, good, excellent.

Four Steps Of Project Performance Scope Of Work Quality And Satisfaction Ppt PowerPoint Presentation Infographic Template Pictures
This is a four steps of project performance scope of work quality and satisfaction ppt powerpoint presentation infographic template pictures. This is a five stage process. The stages in this process are project dashboard, project kpis, project metrics.

Customer Relationship Management Dashboard CRM Application Dashboard Quarter Icons PDF
This graph or chart is linked to excel, and changes automatically based on data. Just left click on it and select Edit Data.Deliver and pitch your topic in the best possible manner with this customer relationship management dashboard crm application dashboard quarter icons pdf. Use them to share invaluable insights on marketing funnel all time, opportunity generation by quarter, active prospects, new prospects, new opportunities and impress your audience. This template can be altered and modified as per your expectations. So, grab it now.

Marketers Guide To Data Analysis Optimization Analyzing Quality Scores To Determine Relevance Of Ad Content Diagrams PDF
This slide covers a brief introduction to quality score KPI along with improvement strategies such as using ad group and keyword structure, writing relevant and compelling ad copies, using ad formats and dynamic headlines. If you are looking for a format to display your unique thoughts, then the professionally designed Marketers Guide To Data Analysis Optimization Analyzing Quality Scores To Determine Relevance Of Ad Content Diagrams PDF is the one for you. You can use it as a Google Slides template or a PowerPoint template. Incorporate impressive visuals, symbols, images, and other charts. Modify or reorganize the text boxes as you desire. Experiment with shade schemes and font pairings. Alter, share or cooperate with other people on your work. Download Marketers Guide To Data Analysis Optimization Analyzing Quality Scores To Determine Relevance Of Ad Content Diagrams PDF and find out how to give a successful presentation. Present a perfect display to your team and make your presentation unforgettable.
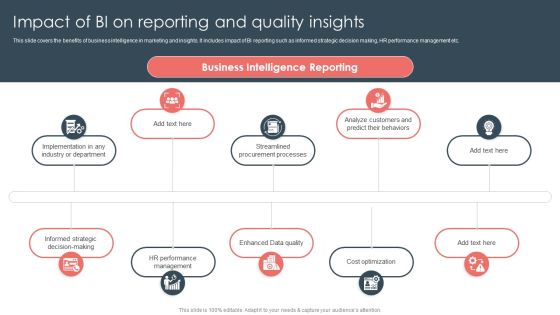
Overview Of BI For Enhanced Decision Making Impact Of BI On Reporting And Quality Insights Demonstration PDF
This slide covers the benefits of business intelligence in marketing and insights. It includes impact of BI reporting such as informed strategic decision making, HR performance management etc. Do you have an important presentation coming up Are you looking for something that will make your presentation stand out from the rest Look no further than Overview Of BI For Enhanced Decision Making Impact Of BI On Reporting And Quality Insights Demonstration PDF. With our professional designs, you can trust that your presentation will pop and make delivering it a smooth process. And with Slidegeeks, you can trust that your presentation will be unique and memorable. So why wait Grab Overview Of BI For Enhanced Decision Making Impact Of BI On Reporting And Quality Insights Demonstration PDF today and make your presentation stand out from the rest.

Business Intelligence Performance Dashboard Ppt Powerpoint Slides
This is a business intelligence performance dashboard ppt powerpoint slides. This is a six stage process. The stages in this process are total revenue, detailed profit of top product line, part capacity allocation, market share, customer satisfaction, quality notification.

Weekly Marketing Investment Report Dashboard Ideas PDF
This slide illustrates the overview of advertising expenditure weekly performance metrics. It incorporate total budget spent and estimated for advertising, estimated and actual registration, revenue, conversion metrics rates etc. Showcasing this set of slides titled Weekly Marketing Investment Report Dashboard Ideas PDF. The topics addressed in these templates are Conversion Metrics, Quality Of Traffic, Quality Of Transaction. All the content presented in this PPT design is completely editable. Download it and make adjustments in color, background, font etc. as per your unique business setting.

Creating A Recruitment Dashboard Powerpoint Sample
This is a creating a recruitment dashboard powerpoint sample. This is a two stage process. The stages in this process are critical success factors, sourcing channels, recruiter efficiency, acceptance rate, key performance indicators, candidate, manager satisfaction, quality of hire, efficiency ratio.
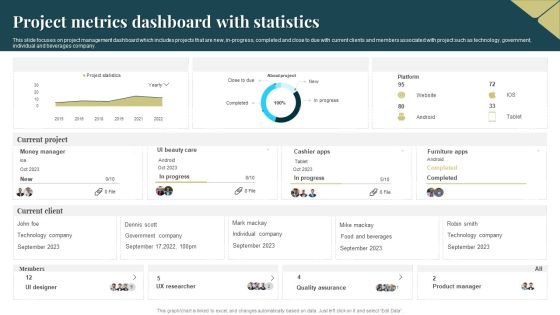
Project Metrics Dashboard With Statistics Slides PDF
This slide focuses on project management dashboard which includes projects that are new, in progress, completed and close to due with current clients and members associated with project such as technology, government, individual and beverages company. Showcasing this set of slides titled Project Metrics Dashboard With Statistics Slides PDF. The topics addressed in these templates are Quality Assurance, Product Manager, Technology. All the content presented in this PPT design is completely editable. Download it and make adjustments in color, background, font etc. as per your unique business setting.

Customer Service Benchmarking Dashboard Percentage Ppt Slides
This is a customer service benchmarking dashboard percentage ppt slides. This is a four stage process. The stages in this process are finance, business, marketing.

Dashboard For Managing Warehouse Operations Mockup PDF
This slide showcases dashboard that can help organization to manage and track the warehouse operations. Its key elements are order, volume, inventory, monthly KPIs and global financial performance. Here you can discover an assortment of the finest PowerPoint and Google Slides templates. With these templates, you can create presentations for a variety of purposes while simultaneously providing your audience with an eye catching visual experience. Download Dashboard For Managing Warehouse Operations Mockup PDF to deliver an impeccable presentation. These templates will make your job of preparing presentations much quicker, yet still, maintain a high level of quality. Slidegeeks has experienced researchers who prepare these templates and write high quality content for you. Later on, you can personalize the content by editing the Dashboard For Managing Warehouse Operations Mockup PDF.

Dashboard Ppt PowerPoint Presentation Styles Vector
This is a dashboard ppt powerpoint presentation styles vector. This is a two stage process. The stages in this process are low, high, poor, good, excellent.

Ppc Campaign Performance Measuring Dashboard Background PDF
Mentioned slide displays KPI dashboard that can be used to track the performance of PPC campaign. Metrics covered are AD cost, clicks, impressions, CTR and cost per conversion.The best PPT templates are a great way to save time, energy, and resources. Slidegeeks have 100 precent editable powerpoint slides making them incredibly versatile. With these quality presentation templates, you can create a captivating and memorable presentation by combining visually appealing slides and effectively communicating your message. Download Ppc Campaign Performance Measuring Dashboard Background PDF from Slidegeeks and deliver a wonderful presentation.

SEO Content Review KPI Dashboard Summary PDF
The following slide highlights the KPAs of content strategy to determine keyword gaps and get quality traffic. It includes KPIs such as no. of pages crawled, content health status, basic web requirements, site user experience, major concerns etc. Pitch your topic with ease and precision using this SEO Content Review KPI Dashboard Summary PDF. This layout presents information on Fundamental Web Requirements, Needs Improvement. It is also available for immediate download and adjustment. So, changes can be made in the color, design, graphics or any other component to create a unique layout.

Dashboard Ppt Powerpoint Presentation Infographics Deck
This is a dashboard ppt powerpoint presentation infographics deck. This is a two stage process. The stages in this process are low, high, poor, good, excellent.

Software Dashboard Manager Test Diagram Presentation Examples
This is a software dashboard manager test diagram presentation examples. This is a four stage process. The stages in this process are issues by risk level, reported issues, location on map, top contributing factors.

Dashboard Project Plan Presentation Powerpoint Example
This is a dashboard project plan presentation powerpoint example. This is a four stage process. The stages in this process are build, test, design, analysis.
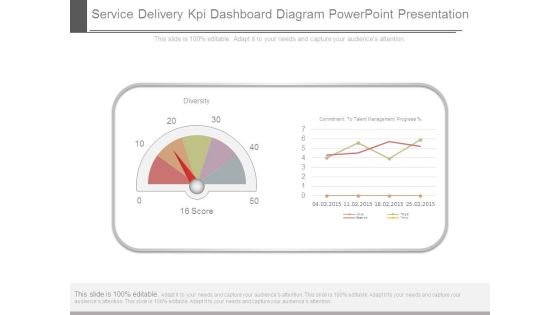
Service Delivery Kpi Dashboard Diagram Powerpoint Presentation
This is a service delivery kpi dashboard diagram powerpoint presentation. This is a two stage process. The stages in this process are diversity, commitment to talent management progress.
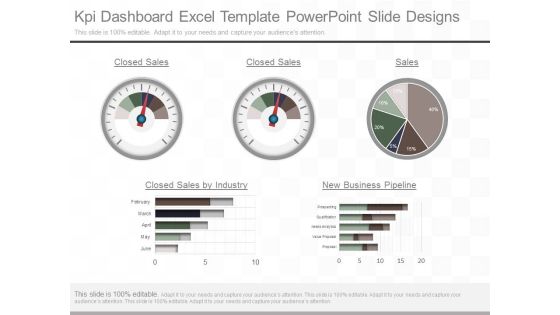
Kpi Dashboard Excel Template Powerpoint Slide Designs
This is a kpi dashboard excel template powerpoint slide designs. This is a five stage process. The stages in this process are closed sales, closed sales, sales, closed sales by industry, new business pipeline, february, march april, may, june, prospecting, qualification, needs analytics, value proposal, proposal.
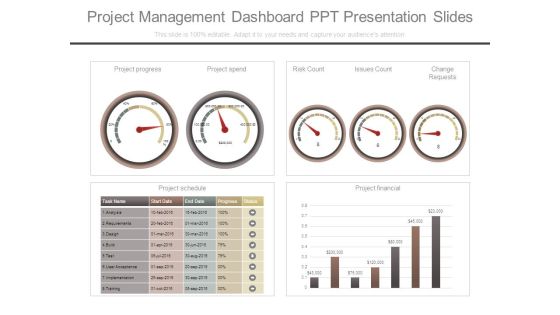
Project Management Dashboard Ppt Presentation Slides
This is a project management dashboard ppt presentation slides. This is a four stage process. The stages in this process are project progress, project spend, risk count, issues count, change requests, project schedule, project financial, task name, start date, end date, progress, status, analysis, requirements, design, build, test, user acceptance, implementation, training.
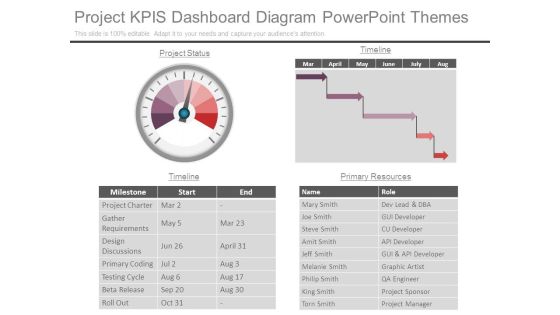
Project Kpis Dashboard Diagram Powerpoint Themes
This is a project kpis dashboard diagram powerpoint themes. This is a one stage process. The stages in this process are project status, timeline, name, role, milestone, start, end, primary resources, project charter, gather requirements, design discussions, primary coding, testing cycle, beta release, roll out, mary smith, joe smith, steve smith, amit smith, jeff smith, melanie smith, philip smith, king smith, torn smith, dev lead and dba, gui developer, cu developer, api developer, gui and api developer, graphic artist, qa engineer, project sponsor, project manager.

Cost Reporting Dashboard Example Powerpoint Slides
This is a cost reporting dashboard example powerpoint slides. This is a five stage process. The stages in this process are cost, quality, project, process planning, analysis.

Interactive Dashboard Examples Ppt Samples Download
This is a interactive dashboard examples ppt samples download. This is a two stage process. The stages in this process are call quality, network utilization.

Company Positioning Charts Dashboard Ppt Background Template
This is a company positioning charts dashboard ppt background template. This is a four stage process. The stages in this process are possible dimension, best product, best price, operational excellence, choice, service, quality, competition, your company.
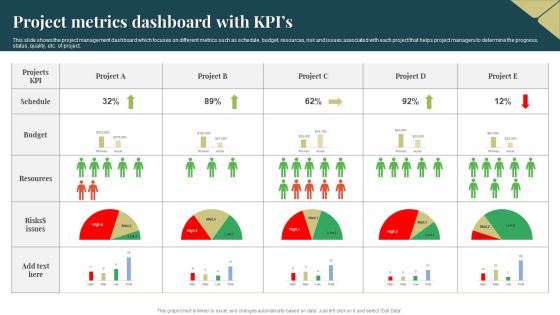
Project Metrics Dashboard With Kpis Ideas PDF
This slide shows the project management dashboard which focuses on different metrics such as schedule, budget, resources, risk and issues associated with each project that helps project managers to determine the progress, status, quality, etc. of project. Pitch your topic with ease and precision using this Project Metrics Dashboard With Kpis Ideas PDF. This layout presents information on Resources, Budget, Risks. It is also available for immediate download and adjustment. So, changes can be made in the color, design, graphics or any other component to create a unique layout.
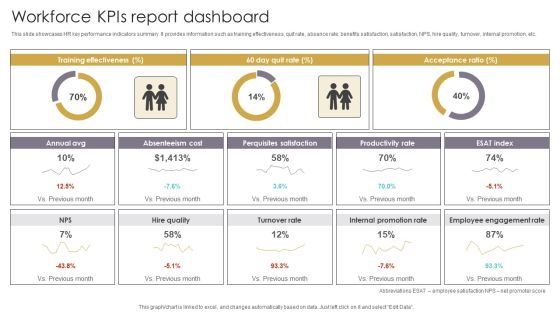
Workforce Kpis Report Dashboard Slides PDF
This slide showcases HR key performance indicators summary. It provides information such as training effectiveness, quit rate, absence rate, benefits satisfaction, satisfaction, NPS, hire quality, turnover, internal promotion, etc. Pitch your topic with ease and precision using this Workforce Kpis Report Dashboard Slides PDF. This layout presents information on Acceptance Ratio, Absenteeism Cost, Perquisites Satisfaction. It is also available for immediate download and adjustment. So, changes can be made in the color, design, graphics or any other component to create a unique layout.

Service Desk Incident Management Dashboard Summary PDF
The following slide showcases problem management dashboard to provide real time snapshot of service desk. The dashboard includes request by status, teams and resolution by channels. Showcasing this set of slides titled Service Desk Incident Management Dashboard Summary PDF. The topics addressed in these templates are Open Incidents Service, Requests By Teams. All the content presented in this PPT design is completely editable. Download it and make adjustments in color, background, font etc. as per your unique business setting.

Dashboard Based Management Template Powerpoint Designs
This is a dashboard based management template powerpoint designs. This is a four stage process. The stages in this process are forecast, report, plan, control.

Client Support Management Dashboard Designs PDF
This slide shows KPI dashboard of customer service delivery management. It includes key performance indicators such as total support requests received, support status, total solved and unsolved issues, etc. Pitch your topic with ease and precision using this Client Support Management Dashboard Designs PDF. This layout presents information on Client Support, Management Dashboard. It is also available for immediate download and adjustment. So, changes can be made in the color, design, graphics or any other component to create a unique layout.

Customer Healthcare Service Management Dashboard Themes PDF
The slide shows a dashboard for health care consultant to effectively manage of booked appointments. It includes key elements such as review score, patients, appointment sin current month, recently attended appointments, monthly revenue, previous months attended meetings, etc. Showcasing this set of slides titled Customer Healthcare Service Management Dashboard Themes PDF. The topics addressed in these templates are Customer Healthcare Service, Management Dashboard. All the content presented in this PPT design is completely editable. Download it and make adjustments in color, background, font etc. as per your unique business setting.

Customer Support And Service Dashboard Ppt Slides
This is a customer support and service dashboard ppt slides. This is a six stage process. The stages in this process are total customer experience, physical benefits, rational benefits, emotional benefits, sensing benefits, people, product.
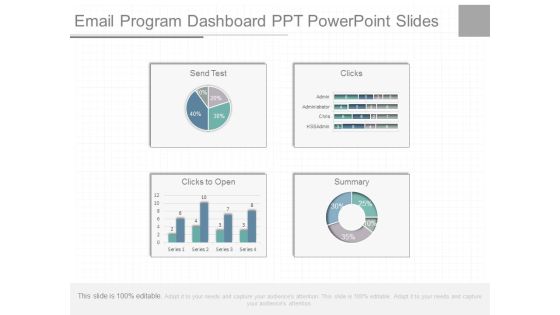
Email Program Dashboard Ppt Powerpoint Slides
This is a email program dashboard ppt powerpoint slides. This is a four stage process. The stages in this process are send test, clicks, clicks to open, summary, admin, administrator, chris, hssadmin.

Determine IT Spending Management Dashboard Download PDF
This slide provides information regarding IT spending management dashboard for tracking parameters such as asset controller, cost by service, potential savings, etc. Deliver and pitch your topic in the best possible manner with this Determine IT Spending Management Dashboard Download PDF. Use them to share invaluable insights on Cost Entity Summary, Cost Over Time, Cost By Service and impress your audience. This template can be altered and modified as per your expectations. So, grab it now.
Devops Continuous Workflow Tracking Dashboard Slides PDF
This slide provides the glimpse of facts and figures related to continuous monitoring of project with DevOps. It includes planned vs. completed work items, work item priority wise, active bugs severity wise, etc. Showcasing this set of slides titled Devops Continuous Workflow Tracking Dashboard Slides PDF. The topics addressed in these templates are Continuous Workflow, Tracking Dashboard, Sprint Analysis By Assignee. All the content presented in this PPT design is completely editable. Download it and make adjustments in color, background, font etc. as per your unique business setting.

Vehicle Management System Dashboard Graphics PDF
This slide represents the dashboard to help fleet managers to monitor the vehicles and the drivers in real-time. It represents KPIs such as vehicle status, service reminders, open issues, inspections summary, service costs etc. Pitch your topic with ease and precision using this Vehicle Management System Dashboard Graphics PDF. This layout presents information on Vehicle Management System, Representing Maintenance Status. It is also available for immediate download and adjustment. So, changes can be made in the color, design, graphics or any other component to create a unique layout.
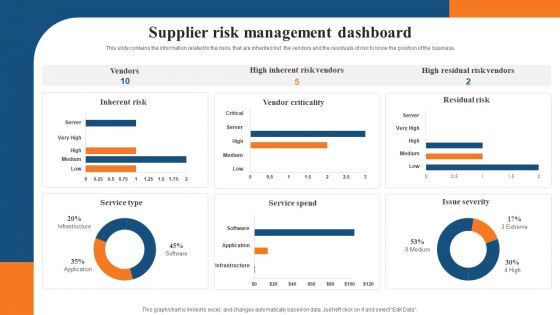
Supplier Risk Management Dashboard Introduction PDF
This slide contains the information related to the risks that are inherited but the vendors and the residuals of risk to know the position of the business. Showcasing this set of slides titled Supplier Risk Management Dashboard Introduction PDF. The topics addressed in these templates are Service Spend, Inherent Risk, Risk Vendors. All the content presented in this PPT design is completely editable. Download it and make adjustments in color, background, font etc. as per your unique business setting.

Employee Performance Management KPI Dashboard Structure PDF
The following slide depicts the overview of staff performance management system to achieve goals and evaluate business growth. It includes key elements such as absenteeism rate, overtime hours, training costs, labor effectiveness etc. Take your projects to the next level with our ultimate collection of Employee Performance Management KPI Dashboard Structure PDF. Slidegeeks has designed a range of layouts that are perfect for representing task or activity duration, keeping track of all your deadlines at a glance. Tailor these designs to your exact needs and give them a truly corporate look with your own brand colors they will make your projects stand out from the rest.
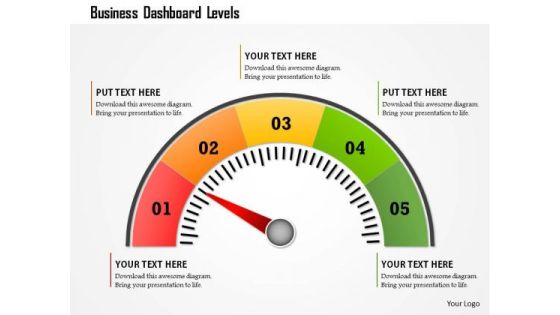
Business Framework Business Dashboard Levels PowerPoint Presentation
This business diagram displays colored meter with multiple levels. Use this diagram to display business process. This diagram can be used to indicate performance measures. This is an excellent diagram to impress your audiences.
KPI Dashboards Per Industry Market Research Customer Satisfaction Dashboard Ppt PowerPoint Presentation Icon Outfit PDF
Deliver and pitch your topic in the best possible manner with this kpi dashboards per industry market research customer satisfaction dashboard ppt powerpoint presentation icon outfit pdf. Use them to share invaluable insights on quality, pricing, design, service, net promoter score, customer effort score, nps and ces development month and impress your audience. This template can be altered and modified as per your expectations. So, grab it now.
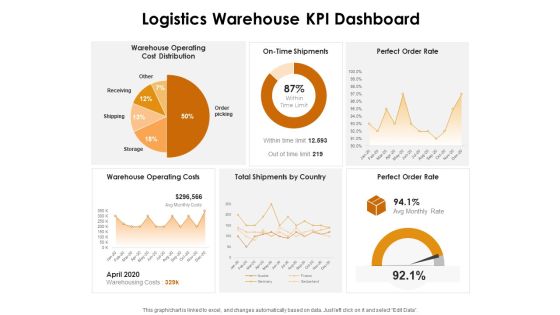
KPI Dashboards Per Industry Logistics Warehouse KPI Dashboard Ppt PowerPoint Presentation Inspiration Skills PDF
Deliver and pitch your topic in the best possible manner with this kpi dashboards per industry logistics warehouse kpi dashboard ppt powerpoint presentation inspiration skills pdf. Use them to share invaluable insights on warehouse operating cost distribution, time shipments, perfect order rate, warehouse operating costs, total shipments country, perfect order rate and impress your audience. This template can be altered and modified as per your expectations. So, grab it now.

Competitive Procurement Pricing Benchmarks Analysis Dashboard Graphics PDF
This slide shows the dashboard representing the procurement price benchmarking comparative analysis report. It shows information related to quality KPIs, return cost analysis, supplier quality range and project analysis. Showcasing this set of slides titled Competitive Procurement Pricing Benchmarks Analysis Dashboard Graphics PDF. The topics addressed in these templates are Return Cost Analysis, Project Analysis, Supplier Quality Rating. All the content presented in this PPT design is completely editable. Download it and make adjustments in color, background, font etc. as per your unique business setting.
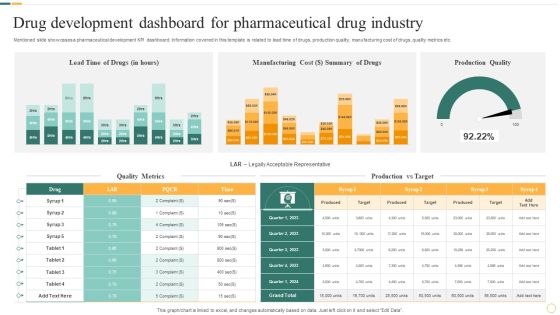
Drug Development Dashboard For Pharmaceutical Drug Industry Portrait PDF
Mentioned slide showcases a pharmaceutical development KPI dashboard. Information covered in this template is related to lead time of drugs, production quality, manufacturing cost of drugs, quality metrics etc. Showcasing this set of slides titled Drug Development Dashboard For Pharmaceutical Drug Industry Portrait PDF. The topics addressed in these templates are Manufacturing Cost, Summary Of Drugs, Production Quality. All the content presented in this PPT design is completely editable. Download it and make adjustments in color, background, font etc. as per your unique business setting.

Call Center Kpis Reporting And Analytics Dashboard Download PDF
This slide covers contact center reporting and analytics metrics dashboard. It involves metrics such as total unsuccessful calls, competence, activity, agent details and quality rate. Pitch your topic with ease and precision using this Call Center Kpis Reporting And Analytics Dashboard Download PDF. This layout presents information on Activity, Quality, Dashboard. It is also available for immediate download and adjustment. So, changes can be made in the color, design, graphics or any other component to create a unique layout.
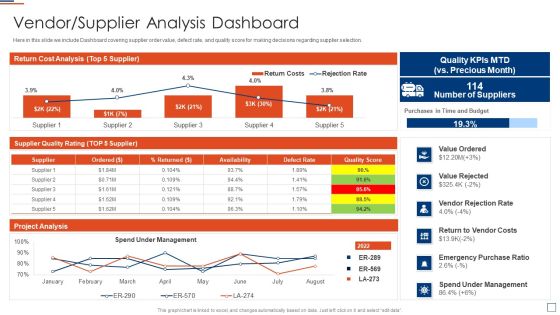
Risk Evaluation And Mitigation Vendor Supplier Analysis Dashboard Clipart PDF
Here in this slide we include Dashboard covering supplier order value, defect rate, and quality score for making decisions regarding supplier selection. Deliver an awe inspiring pitch with this creative Risk Evaluation And Mitigation Vendor Supplier Analysis Dashboard Clipart PDF bundle. Topics like Cost Analysis, Project Analysis, Supplier Quality can be discussed with this completely editable template. It is available for immediate download depending on the needs and requirements of the user.
Performance Tracking Dashboard For 5G Architecture Ideas PDF
This slide describes the performance tracking dashboard for 5G architecture by covering the details of subscribers, quality of experience, consumption, customer support, coverage, devices, and dimensions.Deliver an awe inspiring pitch with this creative Performance Tracking Dashboard For 5G Architecture Ideas PDF bundle. Topics like Quality Experience, Consumption, Customer Support can be discussed with this completely editable template. It is available for immediate download depending on the needs and requirements of the user.
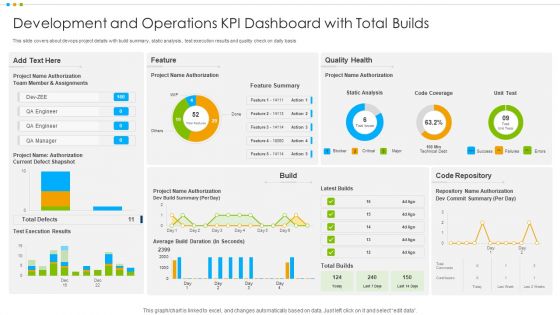
Development And Operations KPI Dashboard With Total Builds Ideas PDF
This slide covers about devops project details with build summary, static analysis , test execution results and quality check on daily basis.Showcasing this set of slides titled Development And Operations KPI Dashboard With Total Builds Ideas PDF The topics addressed in these templates are Member Assignments, Code Repository, Quality Health All the content presented in this PPT design is completely editable. Download it and make adjustments in color, background, font etc. as per your unique business setting.

Catering And Restaurant Promotion Marketing Analysis Dashboard Graphics PDF
This slide shows the dashboard representing data of restaurant and catering for analysis of its marketing performance. It includes details related to presentation of food platters, functionality and flow of set up, quality of food, aesthetics of catering supplies etc.Showcasing this set of slides titled Catering And Restaurant Promotion Marketing Analysis Dashboard Graphics PDF The topics addressed in these templates are Consistent Serving, Functionally, Quality Food All the content presented in this PPT design is completely editable. Download it and make adjustments in color, background, font etc. as per your unique business setting.

Key Performance Indicator Dashboard For Transportation Management Formats PDF
The following slide highlights key performance indicator dashboard for transportation management illustrating transportation cost, effectiveness, utilization and quality for last month and current month in America, Europe and Asia, it considers delivery and return cost, packing productivity and time, packing material cost and equipment utilization. Showcasing this set of slides titled Key Performance Indicator Dashboard For Transportation Management Formats PDF. The topics addressed in these templates are Transportation Cost, Effectiveness, Utilization, Quality. All the content presented in this PPT design is completely editable. Download it and make adjustments in color, background, font etc. as per your unique business setting.

Call Center Metrics Dashboard With Average Queue Time Topics PDF
Mentioned slide outlines call center KPI dashboard which gives insights into customer agent performance. The KPI covered in the slide are total voicemail, average talk time, queue time, average quality rate, agent performance, etc. Pitch your topic with ease and precision using this Call Center Metrics Dashboard With Average Queue Time Topics PDF. This layout presents information on Efficiency, Quality, Activity. It is also available for immediate download and adjustment. So, changes can be made in the color, design, graphics or any other component to create a unique layout.

Project Metrics Dashboard With Outstanding Issues Themes PDF
This slide shows the project management dashboard which includes the status, ongoing activities such as building system and interface, preparing quality standards, issues such as finding test manager, descoping risky items with burndown chart, timeline, etc. Showcasing this set of slides titled Project Metrics Dashboard With Outstanding Issues Themes PDF. The topics addressed in these templates are Quality, System, Project Timeline. All the content presented in this PPT design is completely editable. Download it and make adjustments in color, background, font etc. as per your unique business setting.
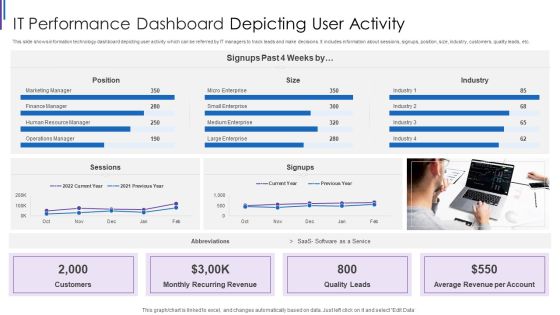
IT Performance Dashboard Depicting User Activity Inspiration PDF
This slide shows information technology dashboard depicting user activity which can be referred by IT managers to track leads and make decisions. It includes information about sessions, signups, position, size, industry, customers, quality leads, etc. Pitch your topic with ease and precision using this IT Performance Dashboard Depicting User Activity Inspiration PDF. This layout presents information on Monthly Recurring Revenue, Average Revenue Per, Account Quality Leads, Customers Position Sessions. It is also available for immediate download and adjustment. So, changes can be made in the color, design, graphics or any other component to create a unique layout.
