AI PPT Maker
Templates
PPT Bundles
Design Services
Business PPTs
Business Plan
Management
Strategy
Introduction PPT
Roadmap
Self Introduction
Timelines
Process
Marketing
Agenda
Technology
Medical
Startup Business Plan
Cyber Security
Dashboards
SWOT
Proposals
Education
Pitch Deck
Digital Marketing
KPIs
Project Management
Product Management
Artificial Intelligence
Target Market
Communication
Supply Chain
Google Slides
Research Services
 One Pagers
All Categories
-
Home
- Customer Favorites
- Qualitative
Qualitative

Company Need Administration Mechanisms Methods Requirement Management Plan Sample PDF
This slide covers the requirement management plan communicating with the other primary interrelated software development methodologies workflow to achieve the goals. Also covers the requirement analysis workflow with the other software development workflows. Deliver an awe-inspiring pitch with this creative company need administration mechanisms methods requirement management plan sample pdf bundle. Topics like requirement analysis, planning, implementation plan can be discussed with this completely editable template. It is available for immediate download depending on the needs and requirements of the user.
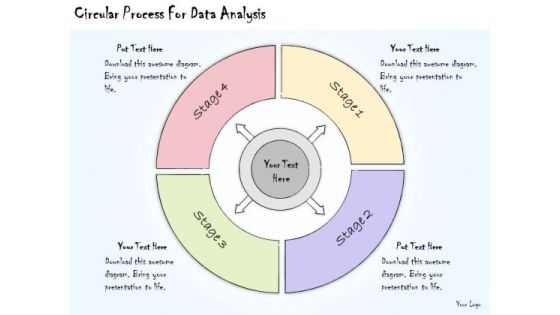
Ppt Slide Circular Process For Data Analysis Marketing Plan
Our PPT Slide circular process for data analysis marketing plan Powerpoint Templates Deliver At Your Doorstep. Let Them In For A Wonderful Experience. Dig Out The Dope With Our Business Plan Powerpoint Templates. Your Thoughts Will Expose The Truth.

Ppt Slide Statistical Analysis With Parallel Arrows Business Diagrams
Draw It Out On Our PPT Slide statistical analysis with parallel arrows business diagrams Powerpoint Templates. Provide Inspiration To Your Colleagues. Motivate The Disheartened With Our Business Plan Powerpoint Templates. Inspire Them With The Goodness In You.

Colored Swot Analysis For Strength And Weakness PowerPoint Template
Concept of SWOT analysis has been displayed in this power point template. This PPT contains the graphic of colored square. This PPT diagram contains the weakness and strength. Use this PPT for your management and business related presentations.
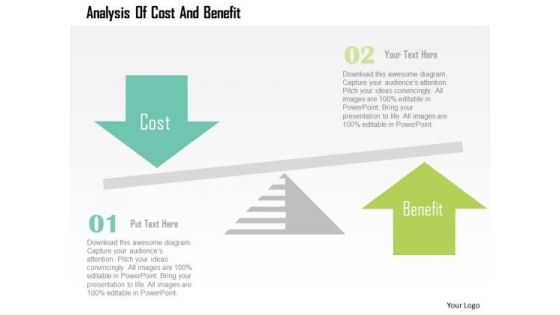
Business Diagram Analysis Of Cost And Benefit Presentation Template
This business diagram contains graphics of balancing scale with arrows of cost and benefit. You may use this diagram for analysis of cost and benefit. Communicate effectively with your group through this slide.

Business Diagram Colorful Gear For Swot Analysis Presentation Template
This business slide has been designed with graphics of colorful gear divided into four parts. Download this diagram to present SWOT analysis. Cement your ideas in the minds of your listeners with this slide.

Business Diagram Test Tubes For Research And Analysis Presentation Template
This diagram is suitable for research and analysis. This diagram template contains the graphic of test tubes. Adjust the above diagram into your Presentations to visually support your contents.
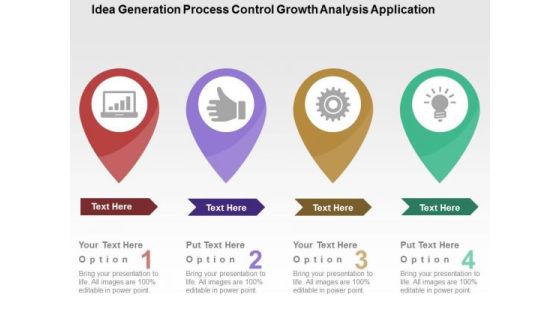
Idea Generation Process Control Growth Analysis Application PowerPoint Template
The template can be used to represent the concepts of idea generation, process control and growth analysis. Our above slide contains various icons for apps. Capture the attention of your audience.

Three Arrow Tags For Data Analysis PowerPoint Template
Our professionally designed business diagram is as an effective tool to display data analysis. It contains graphics of three arrow tags. This template is specifically created to highlight you points.

Timeline With Year Based Analysis And Business Apps PowerPoint Template
Create dynamic presentations with our professional template containing graphics of timeline with business icons. This diagram may be used to display planning and analysis. Download this template to leave permanent impression on your audience.
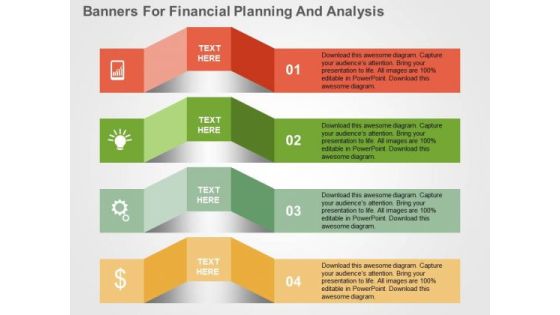
Banners For Financial Planning And Analysis PowerPoint Template
Visually support your presentation with our above template illustrating diagram of banners. It contains graphics of concepts of financial planning and analysis. Etch your views in the brains of your audience with this diagram slide.

Pie Chart On Magnifying Glass For Business Analysis PowerPoint Template
Visually support your presentation with our above template showing pie chart on magnifying glass. This slide has been professionally designed to emphasize the concept of market research and analysis. Deliver amazing presentations to mesmerize your audience.
Circles With Icons For Swot Analysis PowerPoint Template
Visually support your presentation with our above template showing four circles with icons. This slide has been professionally designed to present SWOT analysis. This template offers an excellent background to build impressive presentation.
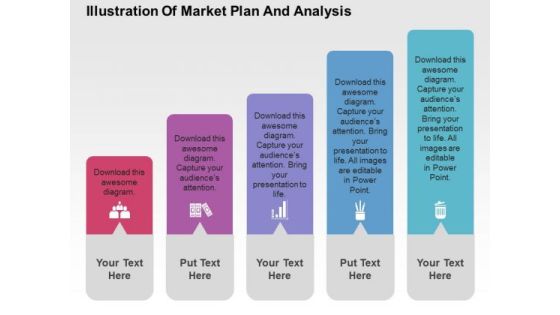
Illustration Of Market Plan And Analysis PowerPoint Templates
The above slide displays five text boxes with icons. This template has been designed to present market plan and analysis. Imprint your concepts with this PPT slide in your presentations.

Fish Bone For Cause And Effect Analysis PowerPoint Templates
This PPT slide has been designed with graphic fish bone diagram. Download this fishbone slide to present cause and effect analysis. Accelerate the impact of your ideas using this image.

Pie Chart For Financial Ratio Analysis PowerPoint Templates
Create visually amazing presentations with this slide of pie chart. This PPT slide of pie chart for financial ratio analysis. Add this diagram in your presentations to visually support your content.

Dashboard Diagram For Finance And Strategic Analysis Powerpoint Slides
This PowerPoint template display graphics of clock with arrows around it and dollar symbol in center. You may use this PPT slide for financial and strategic analysis. This dashboard slide may useful for multilevel status report creation and approval process.

Dashboard To Simplify Business Data Analysis Powerpoint Slides
This PowerPoint template graphics of meter chart. Download this PPT chart to simplify business data analysis. This PowerPoint slide is of great help in the business sector to make realistic presentations and provides effective way of presenting your newer thoughts.
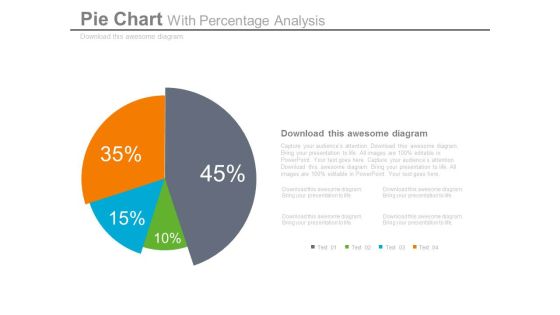
Pie Chart Dashboard Style For Percentage Analysis Powerpoint Slides
This dashboard PPT template contains graphics of pie chart. This dashboard PowerPoint template helps to display percentage analysis in a visual manner. Download this PPT slide for quick decision-making.
Pie Chart With Icons For Business Analysis Powerpoint Slides
This dashboard template contains graphics of pie chart with icons. This dashboard PowerPoint template helps to display business analysis in a visual manner. Download this template to make impressive presentations.
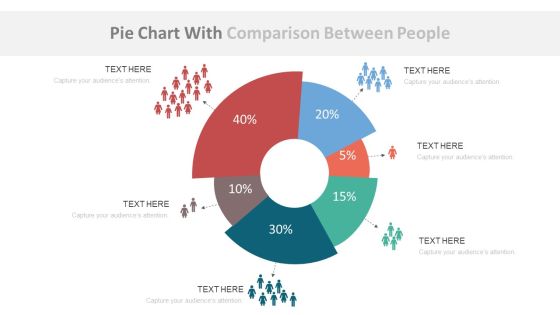
Pie Chart With Population Ratio Analysis Powerpoint Slides
This dashboard template contains graphics of pie chart with icons. This dashboard PowerPoint template helps to display population ratio analysis in a visual manner. Download this template to make impressive presentations.
Four Cubes For Financial Ratio Analysis Powerpoint Template
This business slide displays graphics of four cubes. This PPT slide has been designed to portray concept of financial ratio analysis. Download this PPT slide design to make interactive presentations.
Four Cubes For Fnancial Ratio Analysis Powerpoint Template
This business slide displays graphics of four cubes. This PPT slide has been designed to portray concept of financial ratio analysis. Download this PPT slide design to make interactive presentations.

Business Meeting For Planning And Analysis Powerpoint Template
Graphic of business meeting has been used to design this power point template diagram. This PPT diagram contains the concept of business planning and analysis. Use this PPT diagram for business and marketing related presentations.
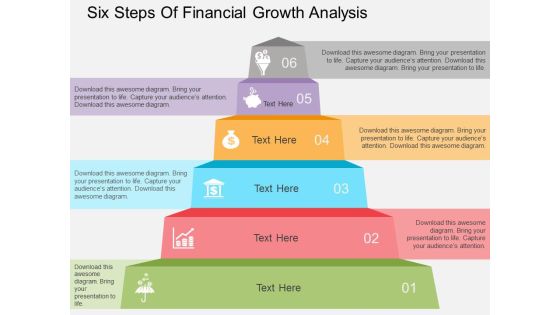
Six Steps Of Financial Growth Analysis Powerpoint Templates
Financial growth analysis can be defined with this business diagram slide. This PowerPoint template contains the graphic of six steps with business icons. Download this editable diagram slide to build unique presentations.
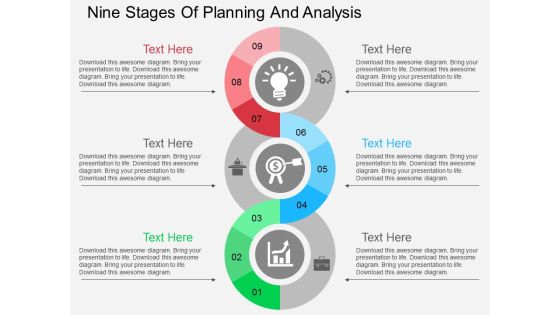
Nine Stages Of Planning And Analysis Powerpoint Templates
Our above business diagram has been designed with spiral info graphic diagram. This slide is suitable to present planning and analysis. Use this business diagram to present your work in a more smart and precise manner.

Alphabet Steps For Financial Strategy Analysis Powerpoint Slides
This PowerPoint template has been designed with alphabet steps with icons. This PPT slide may be used to display financial strategy analysis. Make outstanding business presentation with this template.
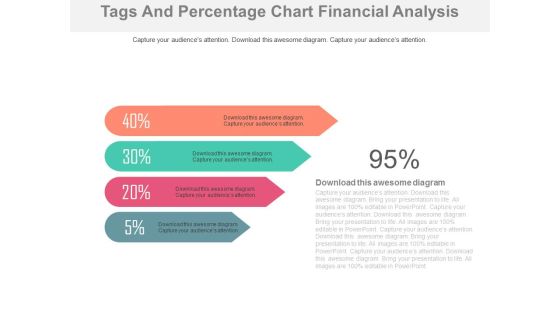
Four Percentage Tags For Financial Analysis Powerpoint Slides
This PowerPoint template contains design of four percentage tags. You may download this PPT slide to display financial analysis. You can easily customize this template to make it more unique as per your need.
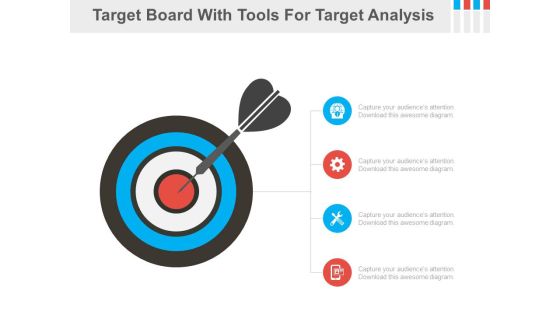
Four Tools For Marketing Target Analysis Powerpoint Slides
This PPT slide contains graphics of target board with four icons. You may download this PPT slide as tool for marketing target analysis. Impress your audiences by using this PPT slide.
Five Mountain Chart With Icons For Financial Analysis Powerpoint Slides
Our above PPT slide contains five mountains with icons and financial values. This PowerPoint template helps to exhibit financial analysis for business growth. Use this diagram to impart more clarity to subject and to create more sound impact on viewers.
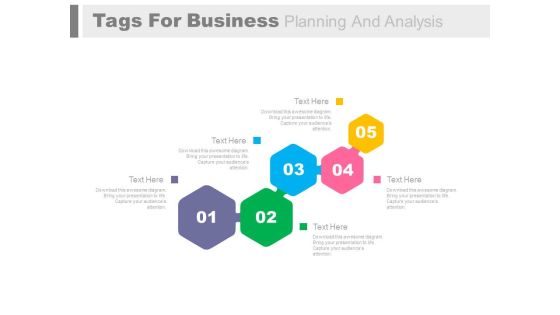
Five Steps For Business Process And Analysis Powerpoint Slides
Five steps process flow have been displayed in this business slide. This business diagram helps to exhibit business process and analysis. Use PowerPoint template to build an exclusive presentation.

Four Text Boxes For Swot Analysis Powerpoint Slides
This PPT slide has been designed with graphics of four steps text boxes diagram. This business diagram helps to exhibit SWOT analysis. Use this PowerPoint template to build an exclusive presentation.
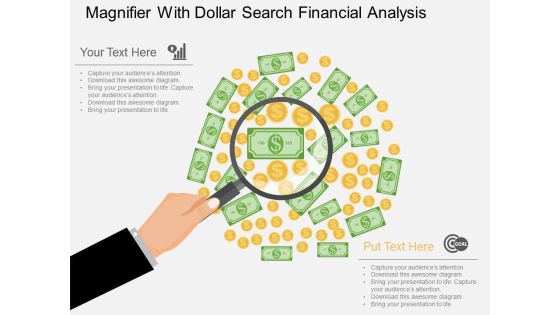
Magnifier With Dollar Search Financial Analysis Powerpoint Template
Our above business slide contains graphics of magnifier on dollar notes. This diagram can be used to display dollar search and financial analysis. Capture the attention of your audience with this professional slide.
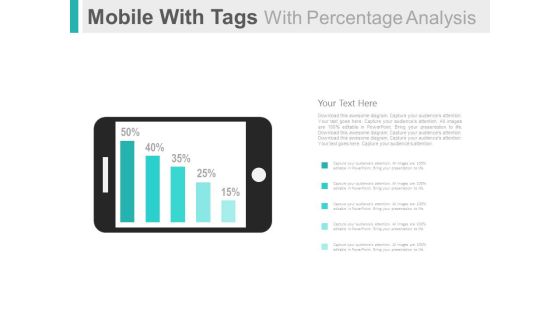
Mobile For Online Survey And Analysis Powerpoint Slides
This PowerPoint template has been designed with graphics of mobile and percentage bar graph. This PPT slide can be used to display online survey and analysis. You can download finance PowerPoint template to prepare awesome presentations.

Pie Charts For Financial Ratio Analysis Powerpoint Slides
This PowerPoint template has been designed with diagram of pie charts. This PPT slide can be used to prepare presentations for profit growth report and also for financial data analysis. You can download finance PowerPoint template to prepare awesome presentations.
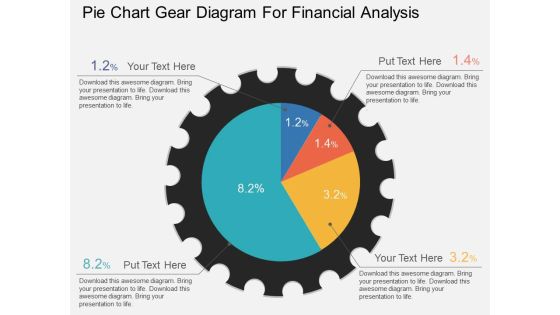
Pie Chart Gear Diagram For Financial Analysis Powerpoint Template
This PowerPoint template has been designed with graphic of pie chart gear diagram. This PPT slide can be used to display financial analysis. Download this PPT diagram slide to make your presentations more effective.

Business Vision And Mission Strategy Analysis Powerpoint Slides
This PowerPoint template displays pictures of corporate team member. You may download this PPT slide to depict corporate vision, mission and strategy analysis. Add this slide to your presentation and impress your superiors.

Linear Timeline Steps For Year Based Analysis Powerpoint Slides
This PowerPoint template has been designed with linear timeline steps. This PPT slide may be helpful to display year based business analysis. Download this PowerPoint timeline template to make impressive presentations.
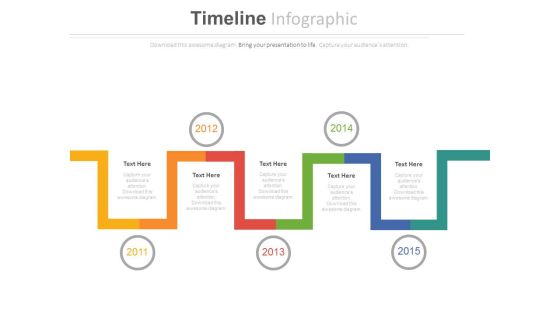
Timeline Steps For Year Based Analysis Powerpoint Slides
This PowerPoint timeline template can be used for multiple purposes including vision planning, new milestones and tasks. This PPT slide may be helpful to display timeline steps and year based analysis. Download this PowerPoint timeline template to make impressive presentations.

Bar Graph With Yearly Statistical Analysis Powerpoint Slides
This PowerPoint template contains diagram of bar graph with yearly percentage ratios. You may download this slide to display statistical analysis. You can easily customize this template to make it more unique as per your need.

Three Person Tags For Management Analysis Powerpoint Slides
This PowerPoint template has been designed with three persons tags. You may use this slide to display management analysis. Make your mark with this unique slide and create an impression that will endure.

Five Steps For Data Compare And Analysis Powerpoint Template
Our above slide contains graphics of five steps chart. This PowerPoint template is useful for data compare and analysis. Use this diagram to impart more clarity to subject and to create more sound impact on viewers.
Four Steps And Icons For Business Analysis Powerpoint Template
Our above PPT slide contains four steps with icons. This PowerPoint template helps to display business strategy and analysis. Use this diagram to impart more clarity to subject and to create more sound impact on viewers.

Bar Graph For Year Based Analysis Powerpoint Slides
This PowerPoint template has been designed with year based bar graph. This diagram may be used to display yearly statistical analysis. Use this PPT slide design to make impressive presentations.

Circle Chart With Percentage Value Analysis Powerpoint Slides
This PowerPoint template has been designed with circular process diagram. This business diagram helps to exhibit financial process control and analysis. Use this diagram to visually support your content.

Four Tags For Financial Review And Analysis Powerpoint Slides
This PowerPoint template has been designed with four tags and financial values. This PowerPoint template helps to exhibit financial review and analysis. Use this diagram slide to build an exclusive presentation.

Pie Chart For Financial Ratio Analysis Powerpoint Slides
This PPT slide contains graphics of eight stage pie chart. Download this PowerPoint template slide for financial ratio analysis. This diagram is editable you can edit text, color, shade and style as per you need.
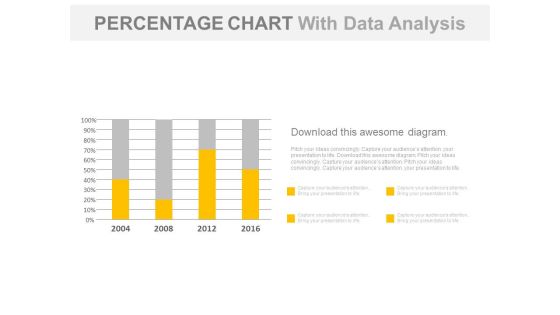
Year Based Chart With Percentage Data Analysis Powerpoint Slides
Our above business slide contains year based statistical chart. This PowerPoint template can be used to display percentage data analysis. Capture the attention of your audience with this slide.

Four Steps For Financial Data Analysis Powerpoint Slides
This PowerPoint contains four circles with percentage values. Download this diagram slide to display financial data analysis. This template is editable, You can edit text, color, shade and style of this diagram as per you need.

Five Bars For Marketing Research And Analysis Powerpoint Template
This business slide contains diagram of five colorful bars. This diagram provides schematic representation of marketing research and analysis. Visual effect this slide helps in maintaining the flow of the discussion and provides more clarity to the subject.
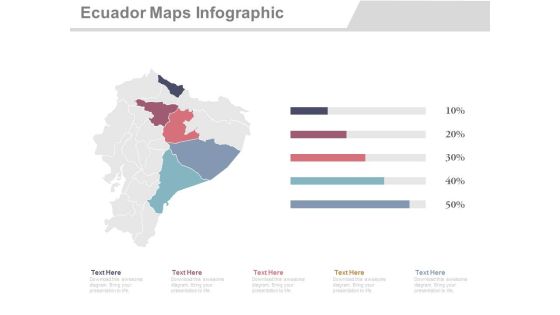
Ecuador Map With States Economic Analysis Powerpoint Slides
This PowerPoint template displays graphics of Ecuador map with different locations and percentage values. This Map template can be used in business presentations to depict economic analysis. This slide can also be used by school students for educational projects.

Four Balls On Scales For Comparison And Analysis Powerpoint Slides
This PowerPoint template has been designed with four balls on scales. You may download this PPT slide to depict comparison and analysis. Add this slide to your presentation and impress your superiors.
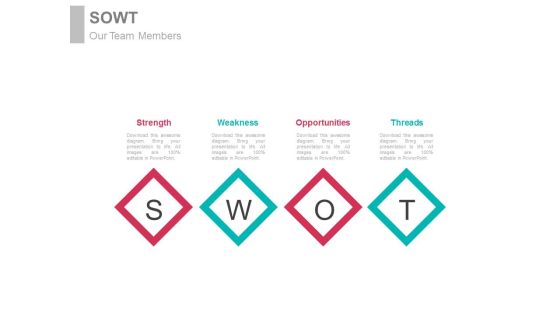
Swot Analysis Design For Management Studies Powerpoint Template
This Power Point template has been designed with SWOT analysis diagram. This PPT diagram may be used for projects in management studies. Use this PPT diagram for business and education related presentations.
Four Arrows With Icons For Business Analysis Powerpoint Slides
This professional slide contains graphics of four arrows with icons. You may use this PowerPoint template for business analysis. Add this PPT slide to your presentation and impress your superiors.

Pie Charts For Percentage Value Analysis Powerpoint Slides
Our above PPT slide displays graphics of Pie charts. This PowerPoint template may be used to display percentage value analysis. Download this template to leave permanent impression on your audience.

Bar Graph For Profit Growth Analysis Powerpoint Slides
This PowerPoint template has been designed with bar graph with percentage values. This diagram is useful to exhibit profit growth analysis. This diagram slide can be used to make impressive presentations.

Bar Graph For Yearly Statistical Analysis Powerpoint Slides
This PowerPoint template has been designed with bar graph. This PowerPoint diagram is useful to exhibit yearly statistical analysis. This diagram slide can be used to make impressive presentations.

Data Driven Comparison Charts For Analysis Powerpoint Slides
You can download this PowerPoint template to display statistical data and analysis. This PPT slide contains data driven comparison charts. Draw an innovative business idea using this professional diagram.
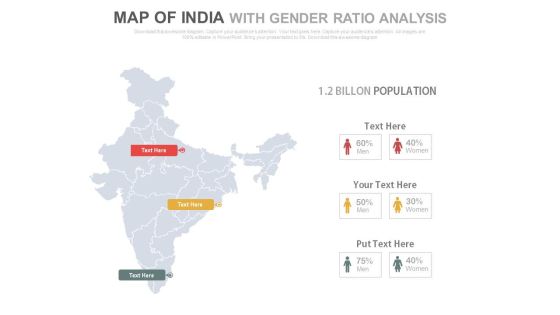
India Map Of With Gender Ratio Analysis Powerpoint Slides
This PowerPoint template displays graphics of India map with male female icons. This Map template can be used in presentations to depict gender ratio analysis. This slide can also be used by school students for educational projects.

World Map With Global Economic Analysis Powerpoint Slides
This PowerPoint template has been designed with graphics of world map. You can download this diagram to exhibit global business analysis. Above PPT slide is suitable for business presentation.

Five Year Tags Analysis Timeline Diagram Powerpoint Slides
This PowerPoint template has been designed with five years tags. This PPT slide may be helpful to display year based business analysis. Download this PowerPoint timeline template to make impressive presentations.

Bar Graph For Data Distribution And Analysis Powerpoint Slides
This PowerPoint template has been designed with bar graph. This PowerPoint diagram is useful for data distribution and analysis This diagram slide can be used to make impressive presentations.

Board With Bar Graph For Financial Analysis Powerpoint Slides
You can download this PowerPoint template to display statistical data and analysis. This PPT slide contains display board with bar graph. Draw an innovative business idea using this professional diagram.
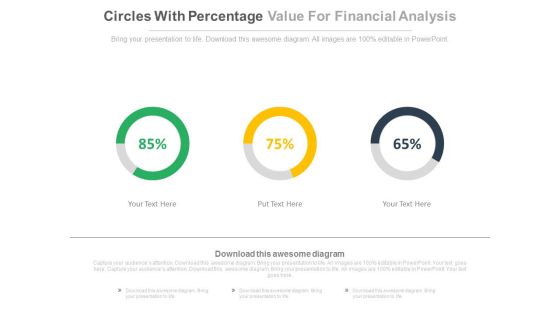
Three Circles With Percentage Values For Financial Analysis Powerpoint Slides
This PowerPoint template has been designed with three circles and percentage values. This PPT slide may be used to display financial analysis for business. Download this slide to build unique presentation.
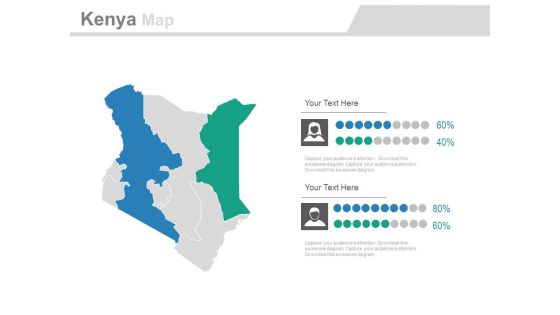
Map Of Kenya With Gender Population Analysis Powerpoint Slides
This PowerPoint map template has been designed with map of Kenya and male female icons. Use these maps to display gender population analysis in your presentations. Any text can be entered at any point in the PowerPoint map slide.
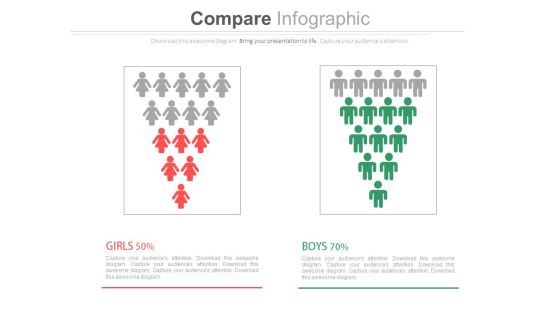
Male Female Gender Ratio Analysis Comparison Chart Powerpoint Slides
This PowerPoint template has been designed with graphics of male and female icons. Download this PPT slide to depict gender ratio analysis. Grab the attention of your team with this eye catching template.

Two Test Tubes For Compare Analysis Powerpoint Slides
This PPT slide contains graphics of two test tubes. Download this PowerPoint template for comparison and analysis. Deliver amazing presentations to mesmerize your audience by using this PPT slide design.
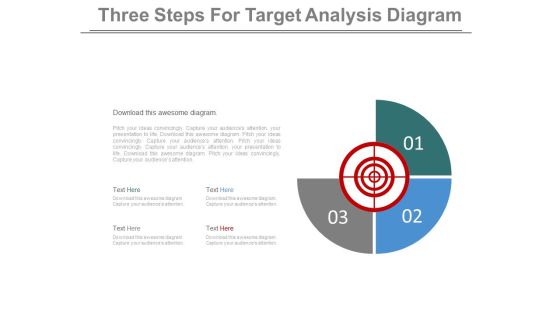
Three Steps For Target Analysis Diagram Powerpoint Slides
Our above business slide contains circular graphics of with three steps. This slide is suitable to present target analysis steps. Develop your strategy and communicate with your team with this professional slide design.

Bar Graph On Blackboard For Growth Analysis Powerpoint Template
Visually support your presentation with our above template containing bar graph on blackboard. This PowerPoint template helps to display growth analysis. Etch your views in the brains of your audience with this diagram slide.

Banners With Business Growth Analysis And Deal Icons Powerpoint Template
This PowerPoint slide contains graphics of text banners with icons. This professional slide helps to exhibit business growth, analysis and deals. Use this professional template to make impressive presentations.

Circular Diagram For Business Deal And Growth Analysis Powerpoint Template
This PowerPoint template has been designed with graphics of circular diagram. You may download this PPT diagram slide to display business deal and growth analysis. Chart the course you intend to take with this slide

Four Banners For Business Growth Analysis Powerpoint Template
This PPT slide contains graphics of four banners with icons. Download this diagram slide to display business growth analysis. This diagram is editable you can edit text, color, shade and style as per you need.

Venn Diagram For Business Intelligence And Predictive Analysis Powerpoint Slides
This power point template has been designed with two steps Venn diagram. Use this Venn diagram for business intelligence and predictive analysis. Illustrate your ideas and imprint them in the minds of your team with this template.
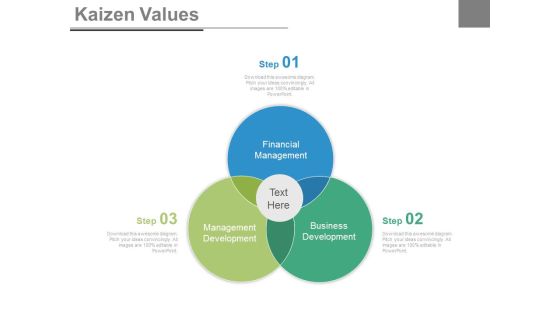
Venn Diagram For Kaizen Values Analysis Powerpoint Slides
This power point template has been designed with graphic of Venn diagram. Use this Venn diagram to display kaizen value analysis. Illustrate your ideas and imprint them in the minds of your team with this template.

Finger Print Circuit For Security Analysis Powerpoint Template
This PowerPoint template has been designed with finder print circuit diagram. Download this diagram to display technology and security analysis. Download this diagram slide to make impressive yet unique presentations.

Test Tubes And Beaker For Ratio Analysis Powerpoint Template
Visually support your presentation with our above template containing diagram of test tubes and beaker. This diagram is excellent visual tools for explaining ratio analysis. Use this diagram to make interactive presentations.

Example Of Cause And Effect Analysis Example Of Ppt
This is an example of cause and effect analysis example of ppt. This is a one stage process. The stages in this process are product positioning, consumer research, target consumer, product concept, product testing, distribution, and publicity, creative.\n\n
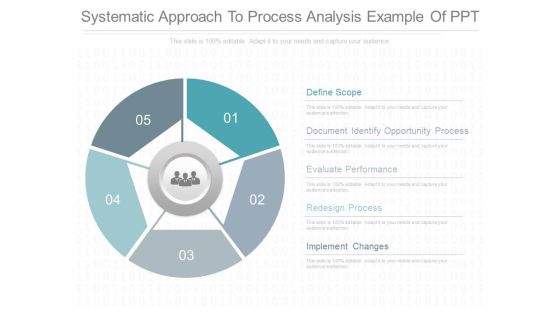
Systematic Approach To Process Analysis Example Of Ppt
This is a systematic approach to process analysis example of ppt. This is a five stage process. The stages in this process are define scope, document identify opportunity process, evaluate performance, redesign process, implement changes.
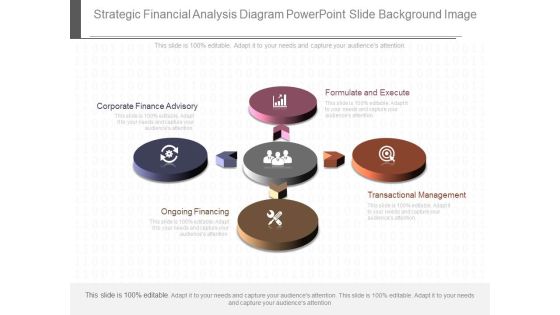
Strategic Financial Analysis Diagram Powerpoint Slide Background Image
This is a strategic financial analysis diagram powerpoint slide background image. This is a four stage process. The stages in this process are formulate and execute, transactional management, ongoing financing, corporate finance advisory.

Go To Market Swot Analysis Diagram Ppt Powerpoint Guide
This is a go to market swot analysis diagram ppt powerpoint guide. This is a six stage process. The stages in this process are strengths, weaknesses, internal factors, external factors, threats, opportunities.

Five Forces Analysis Template Diagram Example Of Ppt
This is a five forces analysis template diagram example of ppt. This is a four stage process. The stages in this process are potential entrants, buyer power, supplier power, threat of substitutes.
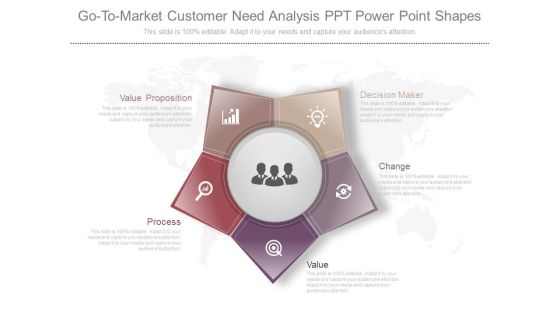
Go To Market Customer Need Analysis Ppt Powerpoint Shapes
This is a go to market customer need analysis ppt powerpoint shapes. This is a five stage process. The stages in this process are decision maker, change, value, process, value proposition.

Global And Local Challenges In Business Analysis Diagram Powerpoint Templates
This is a global and local challenges in business analysis diagram powerpoint templates. This is a four stage process. The stages in this process are regulations, education, immigration, infrastructure, r and d.

Example Of Go To Market Strategy Analysis Ppt Model
This is an example of go to market strategy analysis ppt model. This is a four stage process. The stages in this process are internal factors, external factors, strengths, weaknesses, threats, opportunities\n.
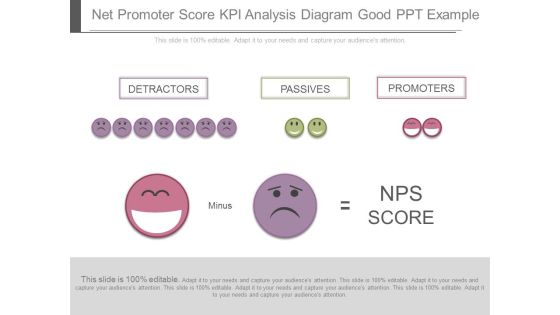
Net Promoter Score Kpi Analysis Diagram Good Ppt Example
This is a net promoter score kpi analysis diagram good ppt example. This is a three stage process. The stages in this process are detractors, passives, promoters, minus, nps score.
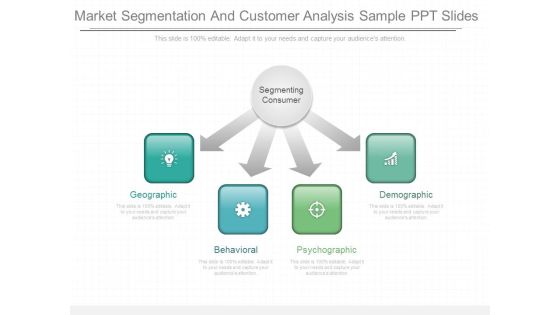
Market Segmentation And Customer Analysis Sample Ppt Slides
This is a market segmentation and customer analysis sample ppt slides. This is a four stage process. The stages in this process are segmenting consumer, geographic, behavioral, psychographic, demographic.
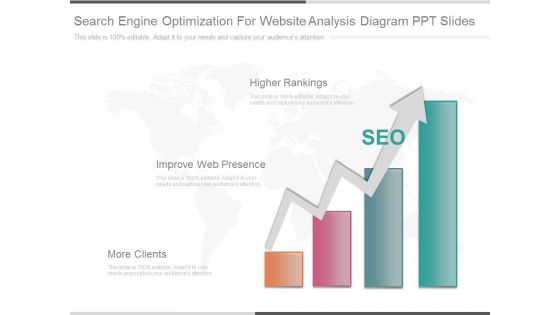
Search Engine Optimization For Website Analysis Diagram Ppt Slides
This is a search engine optimization for website analysis diagram ppt slides. This is a four stage process. The stages in this process are higher rankings, improve web presence, more clients.
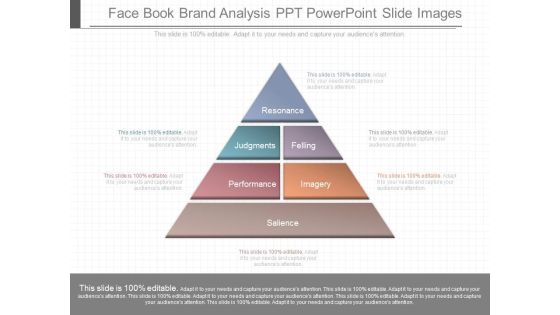
Face Book Brand Analysis Ppt Powerpoint Slide Images
This is a face book brand analysis ppt powerpoint slide images. This is a four stage process. The stages in this process are resonance, judgments, felling, performance, imagery, salience.\n\n\n\n\n \n
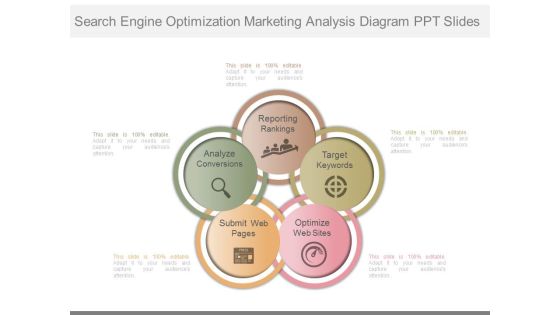
Search Engine Optimization Marketing Analysis Diagram Ppt Slides
This is a search engine optimization marketing analysis diagram ppt slides. This is a five stage process. The stages in this process are reporting rankings, analyze conversions, submit web pages, optimize web sites, target keywords.

Gap Analysis And Documentation Example Ppt Slide Templates
This is a gap analysis and documentation example ppt slide templates. This is a four stage process. The stages in this process are fact finding, documentation review, report and recommendations, results.
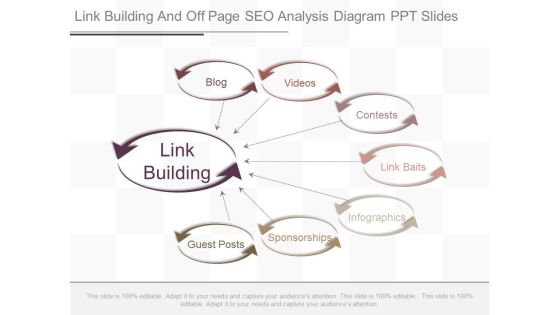
Link Building And Off Page Seo Analysis Diagram Ppt Slides
This is a link building and off page seo analysis diagram ppt slides. This is a seven stage process. The stages in this process are link building, blog, videos, contests, link baits, infographics, sponsorships, guest posts.\n\n\n\n\n\n
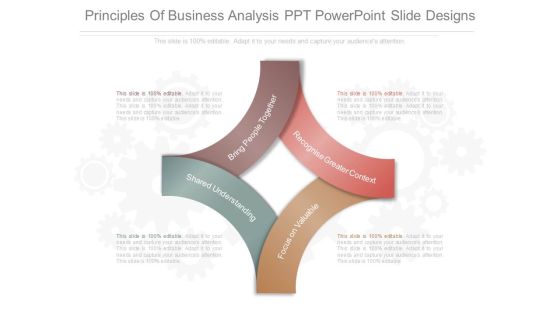
Principles Of Business Analysis Ppt Powerpoint Slide Designs
This is a principles of business analysis ppt powerpoint slide designs. This is a four stage process. The stages in this process are bring people together, recognise greater context, shared understanding, focus on valuable.
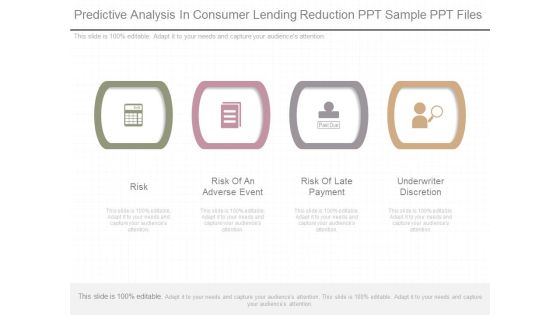
Predictive Analysis In Consumer Lending Reduction Ppt Sample Ppt Files
This is a predictive analysis in consumer lending reduction ppt sample ppt files. This is a four stage process. The stages in this process are risk, risk of an adverse event, risk of late payment, underwriter discretion.

Sales Management Analysis And Decision Making Ppt Slide Examples
This is a sales management analysis and decision making ppt slide examples. This is a six stage process. The stages in this process are the decision maker, decision, action, forecasts, interaction, resources, performance.
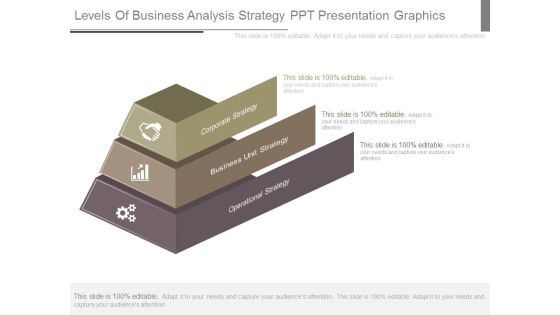
Levels Of Business Analysis Strategy Ppt Presentation Graphics
This is a levels of business analysis strategy ppt presentation graphics. This is a three stage process. The stages in this process are corporate strategy, business unit strategy, operational strategy.

Business Analysis In Agile Environment Diagram Presentation Portfolio
This is a business analysis in agile environment diagram presentation portfolio. This is a eight stage process. The stages in this process are requirement, planning, evaluation, analyze and design, implementation, test, initial planning, deployment.

Change Analysis For Business Diagram Powerpoint Slide Themes
This is a change analysis for business diagram powerpoint slide themes. This is a four stage process. The stages in this process are sustains, assess, implement, begins, vision, results.
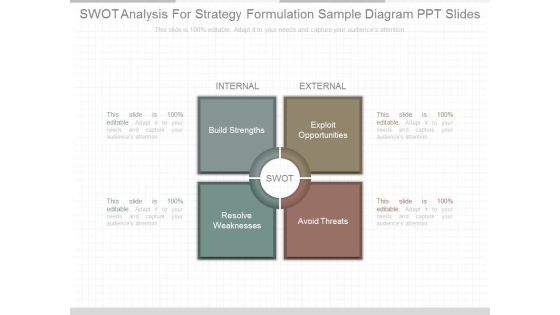
Swot Analysis For Strategy Formulation Sample Diagram Ppt Slides
This is a swot analysis for strategy formulation sample diagram ppt slides. This is a four stage process. The stages in this process are build strengths, exploit opportunities, resolve weaknesses, avoid threats.

Timeline Generator For Sales Growth Analysis Ppt Example File
This is a timeline generator for sales growth analysis ppt example file. This is a four stage process. The stages in this process are business, management, strategy, marketing, year.

Advanced Email Metrics And Analysis Services Diagram Slide
This is a advanced email metrics and analysis services diagram slide. This is a four stage process. The stages in this process are analytics data warehouse, data mining, financial modeling.
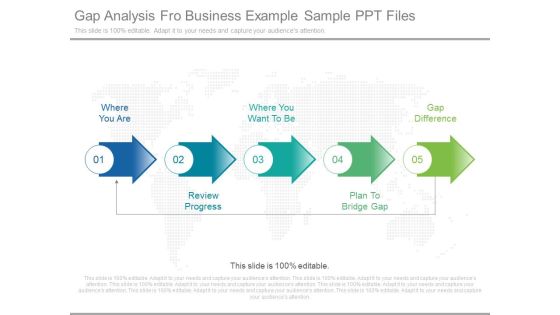
Gap Analysis Fro Business Example Sample Ppt Files
This is a gap analysis fro business example sample ppt files. This is a five stage process. The stages in this process are where you are, review progress, where you want to be, plan to bridge gap, gap difference.

Net Promoter Score Report Analysis Ppt Powerpoint Show
This is a net promoter score report analysis ppt powerpoint show. This is a three stage process. The stages in this process are detractors, passives, promoters, your nps, nps, percentage promoters, percentage detractors.

Cro With Marketing Targets Analysis Ppt Powerpoint Slides
This is a cro with marketing targets analysis ppt powerpoint slides. This is a four stage process. The stages in this process are measure and optimize, retain and grow customers, attract visitors, convert visitors to customers.

Information Sources For Big Data Analysis Diagram Ppt Slides
This is a information sources for big data analysis diagram ppt slides. This is a three stage process. The stages in this process are big data, value, volume, velocity, variety, information sources.
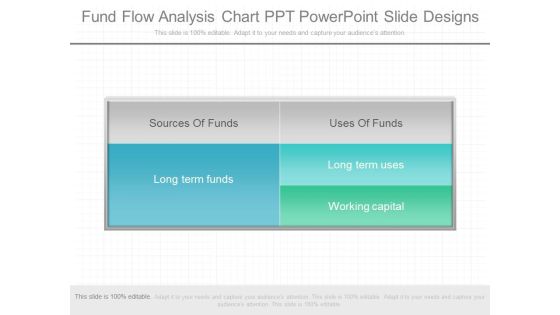
Fund Flow Analysis Chart Ppt Powerpoint Slide Designs
This is a fund flow analysis chart ppt powerpoint slide designs. This is a five stage process. The stages in this process are sources of funds, long term funds, uses of funds, long term uses, working capital.

Analysis Of Marketing System With Reference Strategy Ppt Powerpoint Guide
This is a analysis of marketing system with reference strategy ppt powerpoint guide. This is a four stage process. The stages in this process are email marketing, direct mail marketing, social media marketing, contact management.
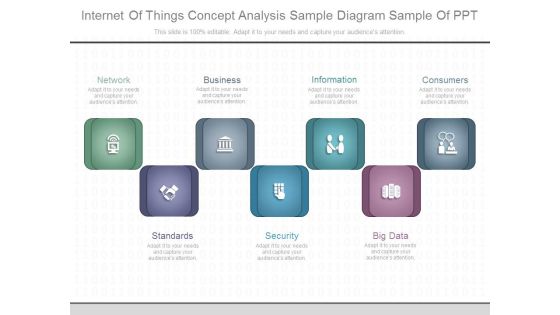
Internet Of Things Concept Analysis Sample Diagram Sample Of Ppt
This is a internet of things concept analysis sample diagram sample of ppt. This is a seven stage process. The stages in this process are network, business, information, consumers, standards, security, big data.

B2b Marketing Plan For Analysis Ppt Presentation Visual Aids
This is a b2b marketing plan for analysis ppt presentation visual aids. This is a five stage process. The stages in this process are marketing strategy, business goals, activity prioritization, execute, 12 month activity plan.
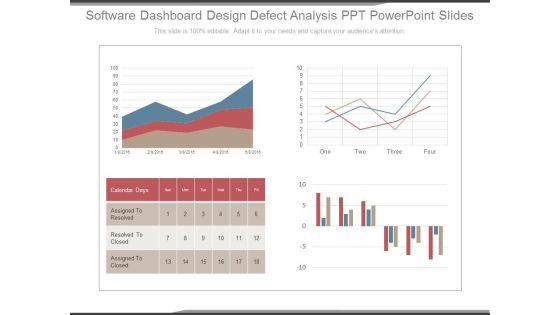
Software Dashboard Design Defect Analysis Ppt Powerpoint Slides
This is a software dashboard design defect analysis ppt powerpoint slides. This is a four stage process. The stages in this process are calendar days, assigned to resolved, resolved to closed, assigned to closed.

Process Of Marketing Campaign Analysis Ppt Powerpoint Guide
This is a process of marketing campaign analysis ppt powerpoint guide. This is a seven stage process. The stages in this process are offer, email, blogs, press releases, search engines, owned, email marketing.

Cyber Threat Analysis Sample Diagram Cyber Powerpoint Guide
This is a cyber threat analysis sample diagram cyber powerpoint guide. This is a three stage process. The stages in this process are system susceptibility, threat capability, threat accessibility.
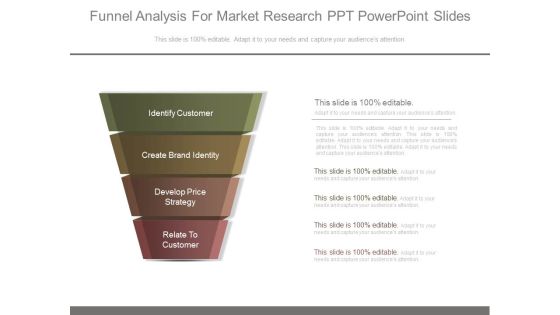
Funnel Analysis For Market Research Ppt Powerpoint Slides
This is a funnel analysis for market research ppt powerpoint slides. This is a four stage process. The stages in this process are identify customer, create brand identity, develop price strategy, relate to customer.
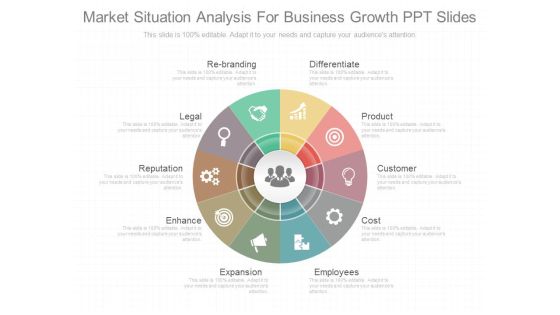
Market Situation Analysis For Business Growth Ppt Slides
This is a market situation analysis for business growth ppt slides. This is a ten stage process. The stages in this process are rebranding, legal, reputation, enhance, expansion, employees, cost, customer, product, differentiate.

Before And After Analysis Of Cro Application Ppt Presentation Design
This is a before and after analysis of cro application ppt presentation design. This is a two stage process. The stages in this process are profitable traffic, super profitable traffic, newly profitable traffic, all traffic.

Cro For Online Business Analysis Diagram Powerpoint Guide
This is a cro for online business analysis diagram powerpoint guide. This is a six stage process. The stages in this process are measure, gather insights, gather insights, study user behavior, gain insights, form hypotheses.
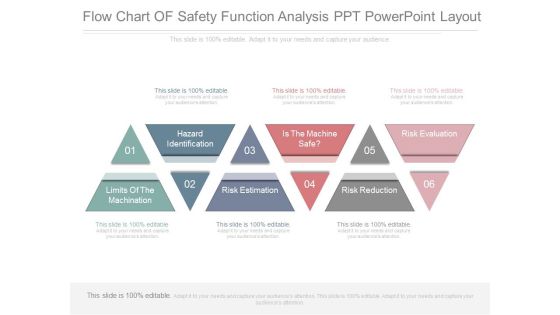
Flow Chart Of Safety Function Analysis Ppt Powerpoint Layout
This is a flow chart of safety function analysis ppt powerpoint layout. This is a six stage process. The stages in this process are hazard identification, limits of the machination, risk estimation, is the machine safe, risk reduction, risk evaluation.
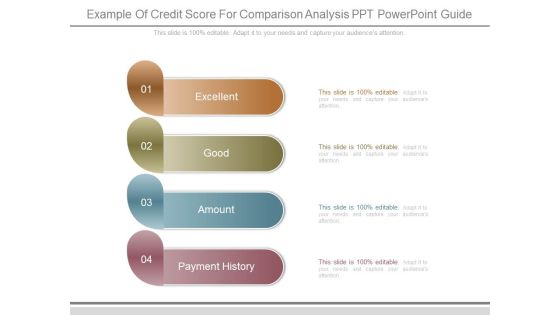
Example Of Credit Score For Comparison Analysis Ppt Powerpoint Guide
This is a example of credit score for comparison analysis ppt powerpoint guide. This is a four stage process. The stages in this process are excellent, good, amount, payment history.
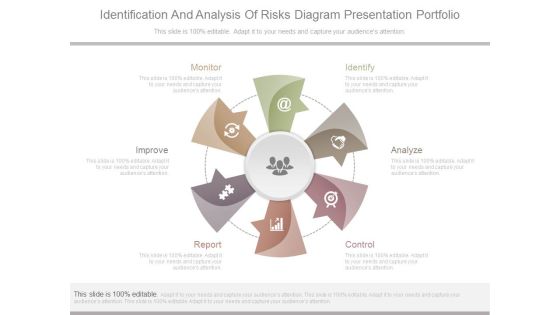
Identification And Analysis Of Risks Diagram Presentation Portfolio
This is a identification and analysis of risks diagram presentation portfolio. This is a six stage process. The stages in this process are monitor, improve, report, identify, analyze, control.

Example Of Marketing Automation Tools Analysis Diagram Example Of Ppt
This is a example of marketing automation tools analysis diagram example of ppt. This is a eight stage process. The stages in this process are email marketing, web tracking, lead scoring, sms messaging, surveys, integrations, crm, social discovery.

Cro With Marketing Targets Analysis Ppt Presentation Visuals
This is a cro with marketing targets analysis ppt presentation visuals. This is a seven stage process. The stages in this process are attract visitors, retain and grow customers, engage, respond, measure and optimize, visit, search.
