Quad Chart

Business Charts PowerPoint Templates Step By Marketing Plan Sales And Slides
Business Charts PowerPoint templates step by marketing plan Sales and Slides-This diagram consists of four Interconnected elements which can be useful to present an organized view of business services and processes. This diagram is an amazing tool to ensure that strategic planning sessions contribute to teambuilding.-Business Charts PowerPoint templates step by marketing plan Sales and Slides
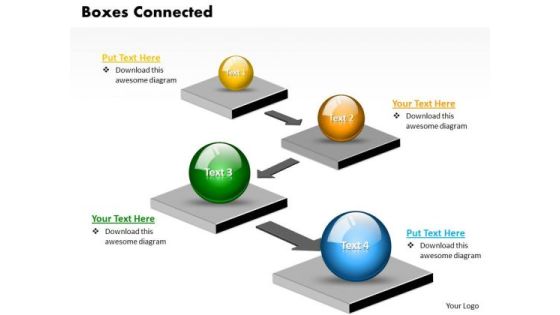
Business Charts PowerPoint Templates 3d Boxes Connected With Arrows Linear Circular Direction Sales
Business Charts PowerPoint templates 3d boxes connected with arrows linear circular direction Sales-Use this Graphical Interface to follow the Correct Path to reach the Destination. This 3D PowerPoint Diagram Shows Four Circular text boxes pointing one to the other defining which Path to follow. This Diagram will make your Presentation Attractive and Delightful to watch.
Web Analytics Icons Computer Screen With Data Charts Ppt PowerPoint Presentation Ideas Outline
This is a web analytics icons computer screen with data charts ppt powerpoint presentation ideas outline. This is a four stage process. The stages in this process are digital analytics, digital dashboard, marketing.

5 Circular Stages Involved Development Sample Flow Charts Vision PowerPoint Slides
We present our 5 circular stages involved development sample flow charts vision PowerPoint Slides.Use our Arrows PowerPoint Templates because you should explain the process by which you intend to right it. Present our Process and Flows PowerPoint Templates because it demonstrates the seeds of many of our successes. Download our Shapes PowerPoint Templates because they will Amplify your thoughts via our appropriate templates. Use our Business PowerPoint Templates because this template can project the path to sucess that you have charted. Download and present our Signs PowerPoint Templates because our PowerPoint templates designed for your ideas to sell.Use these PowerPoint slides for presentations relating to Arrows, Arrows circles, chart, circle, circular, circular Arrowss, circular flow, circulation, color, cycle, cyclic, direction, element, five, flow, four, glossy, icon, isolated, loop, motion, movement, rotation, section, set, shape, sign, symbol, vector, vibrant. The prominent colors used in the PowerPoint template are Orange, Gray, Black. The feedback we get is that our 5 circular stages involved development sample flow charts vision PowerPoint Slides help you meet deadlines which are an element of today's workplace. Just browse and pick the slides that appeal to your intuitive senses. People tell us our circles PowerPoint templates and PPT Slides will make the presenter look like a pro even if they are not computer savvy. We assure you our 5 circular stages involved development sample flow charts vision PowerPoint Slides are Detailed. Presenters tell us our chart PowerPoint templates and PPT Slides will make the presenter successul in his career/life. We assure you our 5 circular stages involved development sample flow charts vision PowerPoint Slides are Colorful. Use our circle PowerPoint templates and PPT Slides are Whimsical.
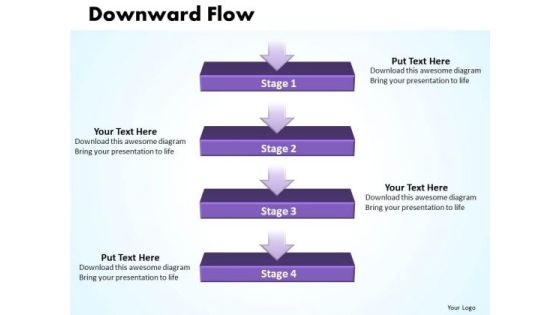
Ppt Linear Flow Process Charts 4 Power Point Stage PowerPoint Templates
PPT linear flow process charts 4 power point stage PowerPoint Templates-This Four State Diagram is a significant modeling technique for analyzing and constructing information processes.-PPT linear flow process charts 4 power point stage PowerPoint Templates-Advertise, Advertisement, Badge, Box, Business, Card, Collection, Column, Corporate, Costing, Counting, Design, Discount, Element, Featured, Finance, Grid, Hosting, Information, List, Message, Placard, Plan, Price, Pricing, Rectangle, Report, Round

Business Diagram Four Colored Pie Charts For Result Analysis Data Driven PowerPoint Slide
This business diagram displays graphic of pie charts. This business slide is suitable to present and compare business data. Use this diagram to build professional presentations for your viewers.

Four Stages Of Product Journey Map Ppt PowerPoint Presentation Diagram Graph Charts PDF
Presenting this set of slides with name four stages of product journey map ppt powerpoint presentation diagram graph charts pdf. This is a four stage process. The stages in this process are four stages of product journey map. This is a completely editable PowerPoint presentation and is available for immediate download. Download now and impress your audience.

Business Charts PowerPoint Templates 4 Reasons You Should Buy From Circular Process Tables Sales
Business Charts PowerPoint templates 4 reasons you should buy from circular process tables Sales-This PowerPoint Diagram consists of four animated Process tables of Different Colors. It can be used to symbolize four different Approaches or four distinct techniques. It consists of single color slide as well. This diagram will fit for Business Presentations.

Business Charts PowerPoint Templates 4 Steps Planning Circular Direction Diagram Sales
Business Charts PowerPoint templates 4 steps planning circular direction diagram Sales-This Rangoli Based PowerPoint Diagram shows the four step planning process in Circular Manner. It shows four Phases required in any Process related to Business. Use this Fascinating Diagram to make your Presentation delightful.
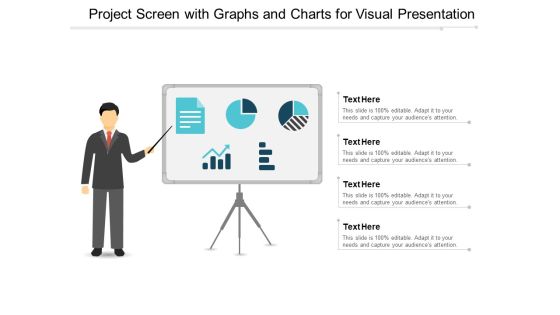
Project Screen With Graphs And Charts For Visual Presentation Ppt PowerPoint Presentation Gallery Design Inspiration
This is a project screen with graphs and charts for visual presentation ppt powerpoint presentation gallery design inspiration. This is a four stage process. The stages in this process are visual aids, communication, business.
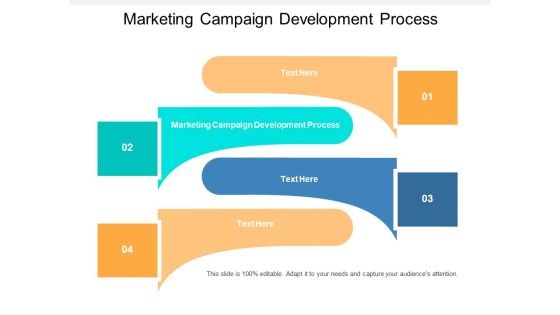
Marketing Campaign Development Process Ppt PowerPoint Presentation Diagram Graph Charts Cpb
This is a marketing campaign development process ppt powerpoint presentation diagram graph charts cpb. This is a four stage process. The stages in this process are marketing campaign development process.

Computer Screen With Business Data Charts Ppt Powerpoint Presentation Show Vector
This is a computer screen with business data charts ppt powerpoint presentation show vector. This is a four stage process. The stages in this process are business metrics, business kpi, business dashboard.

Data Statistics Charts And Key Performance Indicators Ppt Powerpoint Presentation Layouts Guide
This is a data statistics charts and key performance indicators ppt powerpoint presentation layouts guide. This is a four stage process. The stages in this process are business metrics, business kpi, business dashboard.

Financial Charts And Graphs For Statistical Analysis Ppt Powerpoint Presentation Show Layout
This is a financial charts and graphs for statistical analysis ppt powerpoint presentation show layout. This is a four stage process. The stages in this process are business metrics, business kpi, business dashboard.
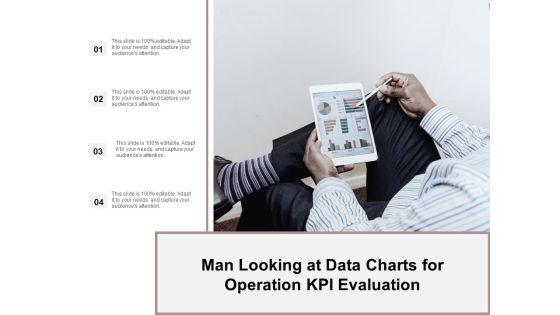
Man Looking At Data Charts For Operation Kpi Evaluation Ppt Powerpoint Presentation Ideas Demonstration
This is a man looking at data charts for operation kpi evaluation ppt powerpoint presentation ideas demonstration. This is a four stage process. The stages in this process are business metrics, business kpi, business dashboard.
Pdca Slide For Best Charts For Technical Analysis Ppt PowerPoint Presentation Icon Backgrounds PDF
This is a pdca slide for best charts for technical analysis ppt powerpoint presentation icon backgrounds pdf template with various stages. Focus and dispense information on four stages using this creative set, that comes with editable features. It contains large content boxes to add your information on topics like pdca slide for best charts for technical analysis. You can also showcase facts, figures, and other relevant content using this PPT layout. Grab it now.
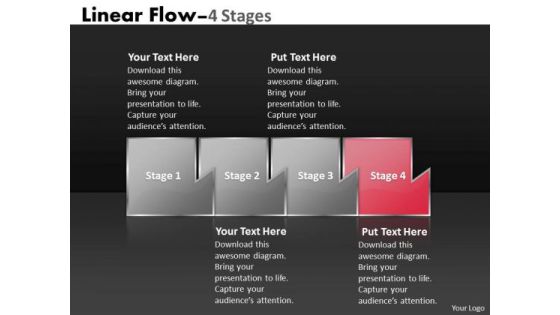
Ppt Theme Mechanism Of Four State Diagram Marketing Linear Flow Activity Charts 5 Graphic
We present our PPT Theme mechanism of four state diagram marketing linear flow activity charts 5 Graphic. Use our Business PowerPoint Templates because, illustrate the means to prevent or control them using our imaginative templates. Use our Shapes PowerPoint Templates because, our cleverly selected background hues are guaranteed to achieve this aim. Use our Design PowerPoint Templates because, the structure of our templates allows you to effectively highlight the key issues concerning the growth of your business. Use our Signs PowerPoint Templates because, have always been a source of inspiration for us all. Use our Process and Flows PowerPoint Templates because; enlighten your peers with the help of our topical templates. Use these PowerPoint slides for presentations relating to abstract, algorithm, arrow, business, chart, connection, design, development, diagram, direction, element, flow, graph, linear, linear diagram, management, organization, plan, process, section, segment, set, sign, solution, strategy, symbol, vector. The prominent colors used in the PowerPoint template are Red, Gray, and Black

E Learning Playbook Roadmap Ppt PowerPoint Presentation Diagram Graph Charts PDF
This is a E Learning Playbook Roadmap Ppt PowerPoint Presentation Diagram Graph Charts PDF template with various stages. Focus and dispense information on four stages using this creative set, that comes with editable features. It contains large content boxes to add your information on topics like Puzzle. You can also showcase facts, figures, and other relevant content using this PPT layout. Grab it now.

Marketing Mix For Global Expansion Ppt PowerPoint Presentation Diagram Graph Charts PDF
This slide showcases marketing mix that can help organization to plan and manage promotion for global expansion. Its key elements are product, price, place and promotion.If you are looking for a format to display your unique thoughts, then the professionally designed Marketing Mix For Global Expansion Ppt PowerPoint Presentation Diagram Graph Charts PDF is the one for you. You can use it as a Google Slides template or a PowerPoint template. Incorporate impressive visuals, symbols, images, and other charts. Modify or reorganize the text boxes as you desire. Experiment with shade schemes and font pairings. Alter, share or cooperate with other people on your work. Download Marketing Mix For Global Expansion Ppt PowerPoint Presentation Diagram Graph Charts PDF and find out how to give a successful presentation. Present a perfect display to your team and make your presentation unforgettable.

Artificial Surveillance Timeline Process Ppt PowerPoint Presentation Diagram Graph Charts PDF
Presenting this set of slides with name artificial surveillance timeline process ppt powerpoint presentation diagram graph charts pdf. This is a four stage process. The stages in this process are timeline, 2017 to 2020. This is a completely editable PowerPoint presentation and is available for immediate download. Download now and impress your audience.

Agenda SDN Security Architecture Ppt PowerPoint Presentation Diagram Graph Charts PDF
Do you have an important presentation coming up Are you looking for something that will make your presentation stand out from the rest Look no further than Agenda SDN Security Architecture Ppt PowerPoint Presentation Diagram Graph Charts PDF. With our professional designs, you can trust that your presentation will pop and make delivering it a smooth process. And with Slidegeeks, you can trust that your presentation will be unique and memorable. So why wait Grab Agenda SDN Security Architecture Ppt PowerPoint Presentation Diagram Graph Charts PDF today and make your presentation stand out from the rest
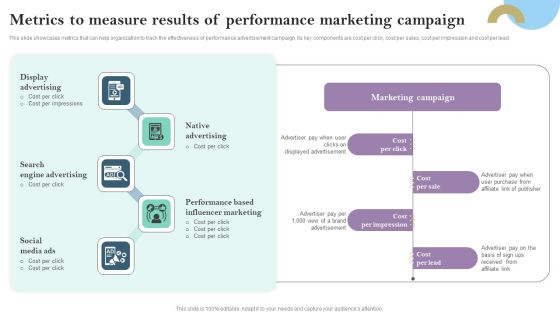
Metrics To Measure Results Of Performance Marketing Campaign Ppt PowerPoint Presentation Diagram Graph Charts PDF
This slide showcases metrics that can help organization to track the effectiveness of performance advertisement campaign. Its key components are cost per click, cost per sales, cost per impression and cost per lead Presenting this PowerPoint presentation, titled Metrics To Measure Results Of Performance Marketing Campaign Ppt PowerPoint Presentation Diagram Graph Charts PDF, with topics curated by our researchers after extensive research. This editable presentation is available for immediate download and provides attractive features when used. Download now and captivate your audience. Presenting this Metrics To Measure Results Of Performance Marketing Campaign Ppt PowerPoint Presentation Diagram Graph Charts PDF. Our researchers have carefully researched and created these slides with all aspects taken into consideration. This is a completely customizable Metrics To Measure Results Of Performance Marketing Campaign Ppt PowerPoint Presentation Diagram Graph Charts PDF that is available for immediate downloading. Download now and make an impact on your audience. Highlight the attractive features available with our PPTs.
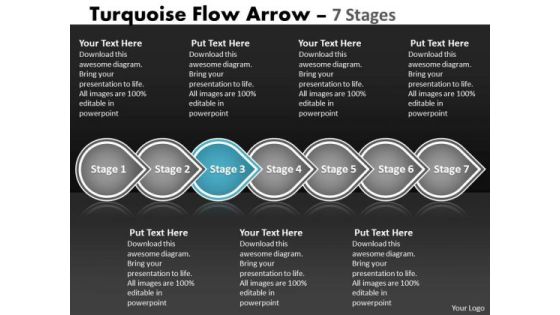
Ppt Theme Continual Seven Phase Diagram Linear Flow Method Charts 4 Design
We present our PPT Theme continual seven phase diagram linear Flow method charts 4 designs. Use our Advertising PowerPoint Templates because; emphasize the benefits of healthy food habits and lifestyles in respect of vital organs of the human anatomy. Use our Shapes PowerPoint Templates because, now fire the arrows to emblazon the desired path by which you will achieve anticipated results. Use our Signs PowerPoint Templates because, Build on your foundation or prepare for change ahead to enhance the future. Use our Marketing PowerPoint Templates because; Get your listeners to put on their thinking caps. Use our Business PowerPoint Templates because; Highlight these individual targets and the paths to their achievement. Use these PowerPoint slides for presentations relating to advertising, arrow, background, banner, bookmark, choice, concept, creative, design, direction, flow, label, layout, manual, marketing, modern, process, product, promotion, sequence, simple, special, step, symbol, tab, tag, turquoise, tutorial, two, vector, . The prominent colors used in the PowerPoint template are Blue, Gray, and White

PowerPoint Template Mechanism Of Four Stages Marketing Linear Flow Process Charts Design
We present our PowerPoint template mechanism of four stages marketing linear flow process charts design. Use our Business PowerPoint Templates because; Refine them all as you take them through the numerous filtering stages of the funnel of your quality control process. Use our Shapes PowerPoint Templates because, to take your team soaring to the pinnacle they crave. Use our Design PowerPoint Templates because, you have the product you are very confident of and are very sure it will prove immensely popular with clients all over your target areas. Use our Signs PowerPoint Templates because, explore the minutest detail of each concept and follow the trail to its conclusion. Use our Process and Flows PowerPoint Templates because, The Venn graphic comprising interlinking circles geometrically demonstrate how various functions operating independently, to a large extent, are essentially interdependent. Use these PowerPoint slides for presentations relating to Abstract, Algorithm, Arrow, Business, Chart, Connection, Design, Development, Diagram, Direction, Element, Flow, Graph, Linear, Linear Diagram, Management, Organization, Plan, Process, Section, Segment, Set, Sign, Solution, Strategy, Symbol, Vector. The prominent colors used in the PowerPoint template are Red, Blue, and Green
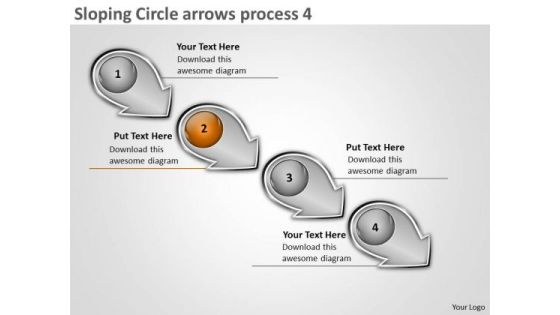
Sloping Circle Arrows Process 4 Business System Flow Charts PowerPoint Slides
We present our sloping circle arrows process 4 business system flow charts PowerPoint Slides. Use our Arrows PowerPoint Templates because; educate your listeners on the means to keep it ticking over. Use our Spheres PowerPoint Templates because, guaranteed to focus the minds of your team. Use our Symbol PowerPoint Templates because, you have analyzed the illness and know the need. Use our Marketing PowerPoint Templates because, Our PowerPoint templates give this step by step process to achieve the aim. Use our Process and Flows PowerPoint Templates because, Gears interconnected: - The Gear Train is a basic element of living and daily business. Use these PowerPoint slides for presentations relating to Arrow, Business, Circle, Circular, Collection, Connection, Cursor, Decoration, Design, Dimensional, Direction, Element, Icon, Illustration, Information, Modern, Motion, Paper, Perspective, Plastic, Pointer, Pointing, Process, Recycle, Recycling, Reflective, Set, Shape, Shiny, Sign, Symbol, Technology. The prominent colors used in the PowerPoint template are Orange, Gray, and Black
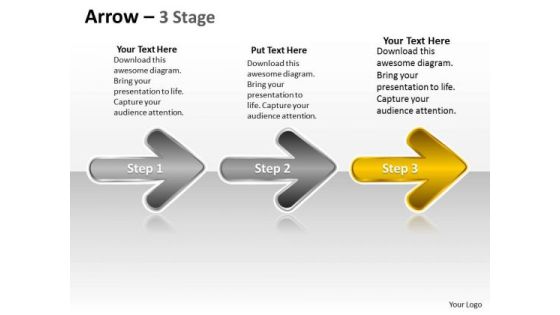
Ppt Series Of Continual Free Custom Presentation PowerPoint Charts Plan 4 Image
We present our PPT series of continual free custom presentation PowerPoint charts plan 4 Image. Use our Symbol PowerPoint Templates because, Brilliant ideas are your forte. Use our Shapes PowerPoint Templates because, Focus on each one and investigate which one would be the best fit for your needs. Use our Signs PowerPoint Templates because; Focus the light on the path to sure shot success. Use our Business PowerPoint Templates because; now imprint them on the minds of your audience via our slides. Use our Arrows PowerPoint Templates because; educate your staff on the means to provide the required support for speedy recovery. Use these PowerPoint slides for presentations relating to arrow, arrowheads, badge, banner, cerulean, colored, colorful, connection, design element, designator, directional, download, emblem, indicator, interface, internet, magenta, marker, matted, menu tool, navigation panel, next, orientation, page site, pictogram, pointer, sign. The prominent colors used in the PowerPoint template are Yellow, Gray, and White

3d Direct Illustration Of Banking Process Using 4 Stages Flow Charts PowerPoint Slides
We present our 3d direct illustration of banking process using 4 stages flow charts PowerPoint Slides. Use our Marketing PowerPoint Templates because; now funnel your marketing strategies down the cone, stage by stage, refining as you go along. Use our Shapes PowerPoint Templates because; Highlight the various ways in which we can maintain its efficiency. Use our Business PowerPoint Templates because; adorn them with your ideas and thoughts. Use our Process and Flows PowerPoint Templates because, Illuminate the spiritual brilliance of Jesus and shower the love for mankind he showed even while being crucified. Use our Arrows PowerPoint Templates because; Use our templates to emphasize your views. Use these PowerPoint slides for presentations relating to 3d, advertising, arrow, background, card, choice, concept, creative, design, direction, flow, illustration, info graphic, instruction, label, layout, manual, marketing, modern, number, options, order, pointer, process, product, promotion, sequence, simple, special, step, symbol. The prominent colors used in the PowerPoint template are Green, White, and Gray

How Big Data Is Stored And Processe Ppt PowerPoint Presentation Diagram Graph Charts PDF
Presenting How Big Data Is Stored And Processe Ppt PowerPoint Presentation Diagram Graph Charts PDF to provide visual cues and insights. Share and navigate important information on four stages that need your due attention. This template can be used to pitch topics like Relational Databases, Big Data, Cloud Solutions. In addtion, this PPT design contains high resolution images, graphics, etc, that are easily editable and available for immediate download.

Cloud Computing For Hosting Network Server Ppt Diagram Graph Charts PDF
Persuade your audience using this Cloud Computing For Hosting Network Server Ppt Diagram Graph Charts PDF. This PPT design covers four stages, thus making it a great tool to use. It also caters to a variety of topics including Cloud Computing, Hosting Network Server. Download this PPT design now to present a convincing pitch that not only emphasizes the topic but also showcases your presentation skills.

Process To Formulate Performance Marketing Campaign Ppt PowerPoint Presentation Diagram Graph Charts PDF
This slide showcases process that can help organization to formulate performance marketing campaign and run online targeted ads. Its key steps are - establish campaign objectives, determine marketing channels, run marketing campaigns and optimize campaigns Explore a selection of the finest Process To Formulate Performance Marketing Campaign Ppt PowerPoint Presentation Diagram Graph Charts PDF here. With a plethora of professionally designed and pre made slide templates, you can quickly and easily find the right one for your upcoming presentation. You can use our Process To Formulate Performance Marketing Campaign Ppt PowerPoint Presentation Diagram Graph Charts PDF to effectively convey your message to a wider audience. Slidegeeks has done a lot of research before preparing these presentation templates. The content can be personalized and the slides are highly editable. Grab templates today from Slidegeeks.

Cost For Setting Billing System Structure Ppt PowerPoint Presentation Diagram Graph Charts PDF
Following slides provide information about total cost requirements to install and operate customer billing system. It include costs such as purchasing, implementing, maintaining, hiring, training etc. Crafting an eye catching presentation has never been more straightforward. Let your presentation shine with this tasteful yet straightforward Cost For Setting Billing System Structure Ppt PowerPoint Presentation Diagram Graph Charts PDF template. It offers a minimalistic and classy look that is great for making a statement. The colors have been employed intelligently to add a bit of playfulness while still remaining professional. Construct the ideal Cost For Setting Billing System Structure Ppt PowerPoint Presentation Diagram Graph Charts PDF that effortlessly grabs the attention of your audience. Begin now and be certain to wow your customers.

Brand Positioning Statement Target Benefits Points For Assistance Ppt PowerPoint Presentation Diagram Graph Charts PDF
This slide provides information regarding brand positioning that portrays how Amazon functions, the target audience, showcases products benefits, point of assistance to highlight competitive advantage. Get a simple yet stunning designed Brand Positioning Statement Target Benefits Points For Assistance Ppt PowerPoint Presentation Diagram Graph Charts PDF. It is the best one to establish the tone in your meetings. It is an excellent way to make your presentations highly effective. So, download this PPT today from Slidegeeks and see the positive impacts. Our easy to edit Brand Positioning Statement Target Benefits Points For Assistance Ppt PowerPoint Presentation Diagram Graph Charts PDF can be your go to option for all upcoming conferences and meetings. So, what are you waiting for Grab this template today.

3d Interconnected Puzzle Illustrating 4 Stages Flow Charts Vision PowerPoint Templates
We present our 3d interconnected puzzle illustrating 4 stages flow charts vision PowerPoint templates.Use our Success PowerPoint Templates because, The success of your venture depends on the performance of every team member. Use our Puzzles or Jigsaws PowerPoint Templates because,This helps you to comprehend your plan to get the entire act together. Use our Shapes PowerPoint Templates because,This diagram helps in examine each brilliant thought in thorough detail highlighting all the pros and cons as minutely as possible. Use our Business PowerPoint Templates because,The fruits of your labour are beginning to show.Enlighten them on the great plans you have for their enjoyment Use our Metaphors-Visual Concepts PowerPoint Templates because,This template helps you to delve on these thoughts and brief your team on the value of your depth of understanding of the subject.Use these PowerPoint slides for presentations relating to Assembly, complete, concept, copy, finish, finished, fit, idea, interlock, jigsaw, match, metaphor, mystery, outline, patience, picture, piece, play, playing, point, pointing, problem, puzzle, quiz, skill, solution, solved, space, struggle, success, support, teamwork. The prominent colors used in the PowerPoint template are Blue, Gray, Black
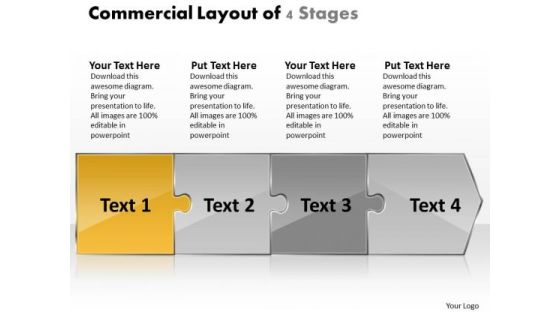
Commercial Layout Of 4 Stages Flow Charts In Office PowerPoint Slides
We present our commercial layout of 4 stages flow charts in office PowerPoint Slides.Use our Success PowerPoint Templates because,You have come up with a brilliant breakthrough idea. You can also visualise the interest it will generate. Use our Puzzles or Jigsaws PowerPoint Templates because, Activities which in themselves have many inherent business oppurtunities. Use our Arrows PowerPoint Templates because,Using our templates for your colleagues will impart knowledge tofeed. Use our Business PowerPoint Templates because, Infrastructure growth is an obvious requirement of today.Inform your group on how exactly this potential is tailor made for you Use our Metaphors-Visual Concepts PowerPoint Templates because,This diagram provides trainers a tool to teach the procedure in a highly visual, engaging way.Use these PowerPoint slides for presentations relating to Areows, Business, Assembly, complete, concept, copy, finish, finished, fit, idea, interlock, jigsaw, match, metaphor, mystery, outline, patience, picture, piece, play, playing, point, pointing, problem, puzzle, quiz, skill, solution, solved, space, struggle, success, support, teamwork. The prominent colors used in the PowerPoint template are Yellow, Gray, White

It Devops Organization Structure Ppt PowerPoint Presentation Diagram Graph Charts PDF
This slide provides the glimpse about the 4 tier of IT organization structure which focuses on base infrastructure, higher order infrastructure, business aligned capabilities, and market facing system. Do you have an important presentation coming up Are you looking for something that will make your presentation stand out from the rest Look no further than It Devops Organization Structure Ppt PowerPoint Presentation Diagram Graph Charts PDF. With our professional designs, you can trust that your presentation will pop and make delivering it a smooth process. And with Slidegeeks, you can trust that your presentation will be unique and memorable. So why wait Grab It Devops Organization Structure Ppt PowerPoint Presentation Diagram Graph Charts PDF today and make your presentation stand out from the rest.
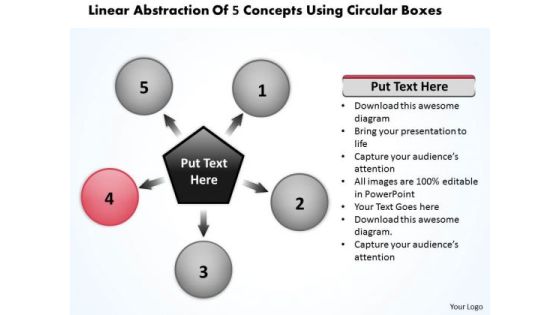
Linear Abstraction Of 5 Concepts Using Circular Boxes Ppt Charts And PowerPoint Slides
We present our linear abstraction of 5 concepts using circular boxes ppt Charts and PowerPoint Slides.Download our Shapes PowerPoint Templates because Our PowerPoint Templates and Slides come in all colours, shades and hues. They help highlight every nuance of your views. Download our Arrows PowerPoint Templates because your group can behave steady in the top bracket. Present our Process and Flows PowerPoint Templates because It can Conjure up grand ideas with our magical PowerPoint Templates and Slides. Leave everyone awestruck by the end of your presentation. Use our Business PowerPoint Templates because you can Lead your flock steadily to greater heights. Look around at the vast potential of achievement around you. Download our Signs PowerPoint Templates because forward thinking is the way to go.Use these PowerPoint slides for presentations relating to Arrow, Blank, Business, Chart, Circle, Circular, Concept, Connection, Copy, Cycle, Development, Diagram, Direction, Element, Flow, Four, Graph, Group, Mapping, Method, Model, Motion, Movement, Numbers, Organization, Pattern, Procedure, Process, Recycle, Redo, Repeat, Repetitive, Report, Resource, Reuse, Ring, Rotate, Rotation, Round, Segment, Sequence, Sequential, Shape, Sign, Space, Step, Strategy, System. The prominent colors used in the PowerPoint template are Red, Gray, Black. Use our linear abstraction of 5 concepts using circular boxes ppt Charts and PowerPoint Slides are Luxuriant. We assure you our Business PowerPoint templates and PPT Slides are Nostalgic. People tell us our linear abstraction of 5 concepts using circular boxes ppt Charts and PowerPoint Slides are designed by professionals PowerPoint presentation experts tell us our Concept PowerPoint templates and PPT Slides are second to none. PowerPoint presentation experts tell us our linear abstraction of 5 concepts using circular boxes ppt Charts and PowerPoint Slides are Precious. Use our Concept PowerPoint templates and PPT Slides are Graceful.

5 Steps Illustrated In Horizontal Manner Process Flow Charts Examples PowerPoint Templates
We present our 5 steps illustrated in horizontal manner process flow charts examples PowerPoint templates.Download and present our Arrows PowerPoint Templates because it shows you the vision of a desired destination and the best road to take to reach that goal. Download and present our Shapes PowerPoint Templates because it helps your team to align their arrows to consistently be accurate. Download our Signs PowerPoint Templates because generation of sales is the core of any business. Use our Business PowerPoint Templates because you have churned your mind and come upwith solutions. Use our Process and Flows PowerPoint Templates because this diagram has the unique ability to drive home your ideas and show how they mesh to guarantee success.Use these PowerPoint slides for presentations relating to Abstract, Arrows, business, chart, circulation, concept, conceptual, design, diagram, executive, four, icon, idea, illustration, management, map, mapping, model, numbers, organization, procedure, process, progression, resource, sequence, sequential, stages, steps, strategy,. The prominent colors used in the PowerPoint template are Green, Gray, White. The feedback we get is that our 5 steps illustrated in horizontal manner process flow charts examples PowerPoint templates are topically designed to provide an attractive backdrop to any subject. People tell us our circulation PowerPoint templates and PPT Slides are Luxuriant. We assure you our 5 steps illustrated in horizontal manner process flow charts examples PowerPoint templates are Wistful. Presenters tell us our conceptual PowerPoint templates and PPT Slides are Amazing. We assure you our 5 steps illustrated in horizontal manner process flow charts examples PowerPoint templates are Beautiful. Use our concept PowerPoint templates and PPT Slides are Striking.

Introduction To Cloud Storage Ppt PowerPoint Presentation Diagram Graph Charts PDF
This slide depicts the introduction to cloud storage, including its features such as being cost-effective, flexible, available, and its management by third party vendors. This modern and well arranged Introduction To Cloud Storage Ppt PowerPoint Presentation Diagram Graph Charts PDF provides lots of creative possibilities. It is very simple to customize and edit with the Powerpoint Software. Just drag and drop your pictures into the shapes. All facets of this template can be edited with Powerpoint no extra software is necessary. Add your own material, put your images in the places assigned for them, adjust the colors, and then you can show your slides to the world, with an animated slide included.
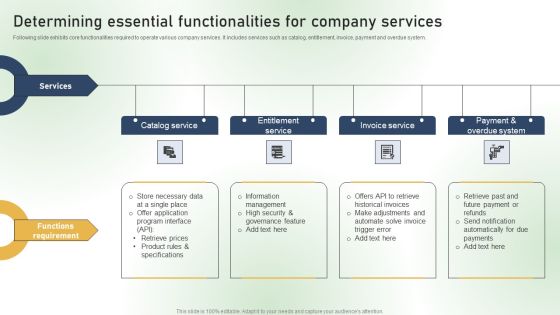
Determining Essential Functionalities For Company Services Ppt PowerPoint Presentation Diagram Graph Charts PDF
Following slide exhibits core functionalities required to operate various company services. It includes services such as catalog, entitlement, invoice, payment and overdue system. This modern and well arranged Determining Essential Functionalities For Company Services Ppt PowerPoint Presentation Diagram Graph Charts PDF provides lots of creative possibilities. It is very simple to customize and edit with the Powerpoint Software. Just drag and drop your pictures into the shapes. All facets of this template can be edited with Powerpoint no extra software is necessary. Add your own material, put your images in the places assigned for them, adjust the colors, and then you can show your slides to the world, with an animated slide included.

Comprehensive Business Overview With Mission And Core Values Ppt PowerPoint Presentation Diagram Graph Charts PDF
This slide provides glimpse about comprehensive summary of cosmetics and skin care company to provide current and background information. It includes overview, partners, core values, key facts, etc. Want to ace your presentation in front of a live audience Our Comprehensive Business Overview With Mission And Core Values Ppt PowerPoint Presentation Diagram Graph Charts PDF can help you do that by engaging all the users towards you. Slidegeeks experts have put their efforts and expertise into creating these impeccable powerpoint presentations so that you can communicate your ideas clearly. Moreover, all the templates are customizable, and easy to edit and downloadable. Use these for both personal and commercial use.

Layout Of Converging 7 Steps Linear Flow Charts And Diagrams PowerPoint Templates
We present our layout of converging 7 steps linear flow Charts and Diagrams PowerPoint templates.Download and present our Advertising PowerPoint Templates because the colour coding of our templates are specifically designed to highlight you points. Present our Arrows PowerPoint Templates because this helps you to put all your brilliant views to your audience. Use our Process and Flows PowerPoint Templates because this unique template give you an enthusiastic response and a purposeful Aye- Aye Sir. Present our Marketing PowerPoint Templates because networking is an imperative in todays world. You need to access the views of others. Similarly you need to give access to them of your abilities. Download our Shapes PowerPoint Templates because you can Enlighten them with your brilliant understanding of mental health.Use these PowerPoint slides for presentations relating to Advertising, Arrow, Background, Banner, Blue, Bookmark, Card, Choice, Concept, Creative, Design, Direction, Flow, Four, Illustration, Instruction, Label, Layout, Manual, Marketing, Modern, Next, Number, Offer, One, Options, Order, Page, Paper, Pointer, Process, Product, Promotion, Sequence, Simple, Special, Step, Symbol. The prominent colors used in the PowerPoint template are Green, Gray, Black. Use our layout of converging 7 steps linear flow Charts and Diagrams PowerPoint templates are Romantic. We assure you our Banner PowerPoint templates and PPT Slides will get their audience's attention. People tell us our layout of converging 7 steps linear flow Charts and Diagrams PowerPoint templates are Spectacular. PowerPoint presentation experts tell us our Concept PowerPoint templates and PPT Slides effectively help you save your valuable time. PowerPoint presentation experts tell us our layout of converging 7 steps linear flow Charts and Diagrams PowerPoint templates are Graceful. Use our Choice PowerPoint templates and PPT Slides are One-of-a-kind.
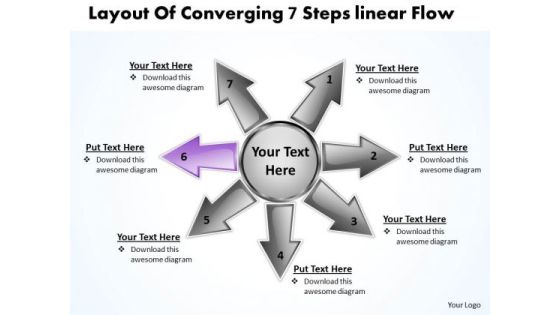
Layout Of Converging 7 Steps Linear Flow Ppt Charts And Networks PowerPoint Templates
We present our layout of converging 7 steps linear flow ppt Charts and Networks PowerPoint templates.Use our Advertising PowerPoint Templates because this PPt slide can educate your listeners on the relevance and importance of each one as per your plan and how they all contribute as you strive to hit the Bullseye. Download our Arrows PowerPoint Templates because this Layout can explain the relevance of the different layers and stages in getting down to your core competence, ability and desired result. Use our Process and Flows PowerPoint Templates because this diagram helps to reaffirm to your team your faith in maintaining the highest ethical standards. Use our Marketing PowerPoint Templates because customer satisfaction is a mantra of the marketplace. Building a loyal client base is an essential element of your business. Use our Shapes PowerPoint Templates because you have the right arrows in your quiver.Use these PowerPoint slides for presentations relating to Advertising, Arrow, Background, Banner, Blue, Bookmark, Card, Choice, Concept, Creative, Design, Direction, Flow, Four, Illustration, Instruction, Label, Layout, Manual, Marketing, Modern, Next, Number, Offer, One, Options, Order, Page, Paper, Pointer, Process, Product, Promotion, Sequence, Simple, Special, Step, Symbol. The prominent colors used in the PowerPoint template are Purple, Gray, Black. Use our layout of converging 7 steps linear flow ppt Charts and Networks PowerPoint templates are Graceful. We assure you our Banner PowerPoint templates and PPT Slides are Luxuriant. People tell us our layout of converging 7 steps linear flow ppt Charts and Networks PowerPoint templates are Adorable. PowerPoint presentation experts tell us our Concept PowerPoint templates and PPT Slides will help you be quick off the draw. Just enter your specific text and see your points hit home. PowerPoint presentation experts tell us our layout of converging 7 steps linear flow ppt Charts and Networks PowerPoint templates are Upbeat. Use our Background PowerPoint templates and PPT Slides are Liberated.

Free Business Charts Of 5 Stages Process Strategy Ppt PowerPoint Templates
We present our free business charts of 5 stages process strategy ppt PowerPoint templates.Present our Marketing PowerPoint Templates because It will let you Set new benchmarks with our PowerPoint Templates and Slides. They will keep your prospects well above par. Download our Business PowerPoint Templates because Our PowerPoint Templates and Slides will give good value for money. They also have respect for the value of your time. Download our Layers PowerPoint Templates because It will get your audience in sync. Download and present our Funnels PowerPoint Templates because Our PowerPoint Templates and Slides have the Brilliant backdrops. Guaranteed to illuminate the minds of your audience. Use our cones PowerPoint Templates because Our PowerPoint Templates and Slides will effectively help you save your valuable time. They are readymade to fit into any presentation structure. Use these PowerPoint slides for presentations relating to 2, 3, 3d, 4, 5, Analyses, Analytics, Analyze, Analyzing, Blank, Blue, Business, Buying, Channel, Chart, Cone, Conversion, Diagram, Drawing, Five, Flow, Four, Funnel, Graphics, Icon, Illustration, Internet, Lead, Level, Marketing, Part, Pipe, Purchase, Sale, Seven, Six, Slice, Sliced, Stage, Strategy, Target, Three, Traffic, Two, Vector, Web, Web marketing,. The prominent colors used in the PowerPoint template are Yellow, Gray, White.
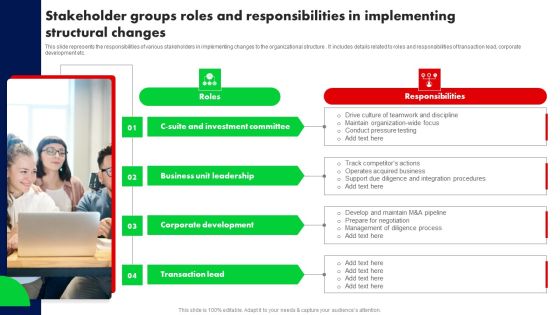
Stakeholder Groups Roles And Responsibilities In Implementing Structural Changes Ppt PowerPoint Presentation Diagram Graph Charts PDF
This slide represents the responsibilities of various stakeholders in implementing changes to the organizational structure . It includes details related to roles and responsibilities of transaction lead, corporate development etc. Retrieve professionally designed Stakeholder Groups Roles And Responsibilities In Implementing Structural Changes Ppt PowerPoint Presentation Diagram Graph Charts PDF to effectively convey your message and captivate your listeners. Save time by selecting pre made slideshows that are appropriate for various topics, from business to educational purposes. These themes come in many different styles, from creative to corporate, and all of them are easily adjustable and can be edited quickly. Access them as PowerPoint templates or as Google Slides themes. You do not have to go on a hunt for the perfect presentation because Slidegeeks got you covered from everywhere.

Different Types Of Brand Architecture Ppt PowerPoint Presentation Diagram Graph Charts PDF
This slide showcases different types of brand architecture under which organizations operates. It includes - branded house, house of brands, hybrid brand and endorsed brand architecture. Welcome to our selection of the Different Types Of Brand Architecture Ppt PowerPoint Presentation Diagram Graph Charts PDF. These are designed to help you showcase your creativity and bring your sphere to life. Planning and Innovation are essential for any business that is just starting out. This collection contains the designs that you need for your everyday presentations. All of our PowerPoints are 100 percent editable, so you can customize them to suit your needs. This multi purpose template can be used in various situations. Grab these presentation templates today.

Deployment Of Digital Twin In Retail Sector Ppt PowerPoint Presentation Diagram Graph Charts PDF
This slide describes the application of digital twin technology in the retail industry and how it can enhance the customer experience and efficient in store planning. This Deployment Of Digital Twin In Retail Sector Ppt PowerPoint Presentation Diagram Graph Charts PDF from Slidegeeks makes it easy to present information on your topic with precision. It provides customization options, so you can make changes to the colors, design, graphics, or any other component to create a unique layout. It is also available for immediate download, so you can begin using it right away. Slidegeeks has done good research to ensure that you have everything you need to make your presentation stand out. Make a name out there for a brilliant performance.

Business Diagram Four Colorful Pie Charts For Data Representation Presentation Template
This diagram is designed with four colorful pie charts. Download this diagram to analyze the key points. This diagram offers a way for your audience to visually conceptualize the process.
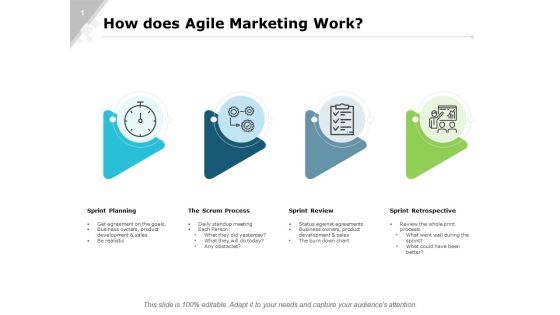
How Does Agile Marketing Work Ppt PowerPoint Presentation Diagram Graph Charts
This is a how does agile marketing work ppt powerpoint presentation diagram graph charts. This is a four stage process. The stages in this process are business, planning, strategy, marketing, management.

Improve Sales Performance And Productivity Ppt PowerPoint Presentation Diagram Graph Charts
This is a improve sales performance and productivity ppt powerpoint presentation diagram graph charts. This is a four stage process. The stages in this process are marketing effort, branding initiative, marketing initiatives.

Achievement And Failure Icon With Employee And Flag Ppt PowerPoint Presentation Diagram Graph Charts
Persuade your audience using this achievement and failure icon with employee and flag ppt powerpoint presentation diagram graph charts. This PPT design covers four stages, thus making it a great tool to use. It also caters to a variety of topics including achievement and failure icon with employee and flag. Download this PPT design now to present a convincing pitch that not only emphasizes the topic but also showcases your presentation skills.

Various Information Technology Departments In Company Slides PDF
This slide shows the IT department structure in the company that includes various division such as Research and Development, Product Development, Administration Development, Support and Security Department and IT Services Development. This is a various information technology departments in company slides pdf template with various stages. Focus and dispense information on four stages using this creative set, that comes with editable features. It contains large content boxes to add your information on topics like product development, administration department, research and development, support and security department. You can also showcase facts, figures, and other relevant content using this PPT layout. Grab it now.

Channels To Set Smart And Measurable Product Objectives Structure PDF
Presenting channels to set smart and measurable product objectives structure pdf to dispense important information. This template comprises four stages. It also presents valuable insights into the topics including product strategy, product roadmap, goal and initiatives. This is a completely customizable PowerPoint theme that can be put to use immediately. So, download it and address the topic impactfully.

Enterprise Management Team Structure Ideas PDF
This is a enterprise management team structure ideas pdf template with various stages. Focus and dispense information on four stages using this creative set, that comes with editable features. It contains large content boxes to add your information on topics like team structure. You can also showcase facts, figures, and other relevant content using this PPT layout. Grab it now.

Business Framework Template Comparison Matrix PowerPoint Presentation
This business diagram displays framework for comparison chart. It contains matrix chart for comparison of four products. This diagram enables the users to create their own display of the required processes in an easy way.

Ppt Linear Process Flow PowerPoint Template 4 Phase Diagram Templates
PPT linear process flow powerpoint template 4 phase diagram Templates-This Chart is a simple template that provides a graphical, time-phased overview of a continuing sequence of stages in a flow-PPT linear process flow powerpoint template 4 phase diagram Templates-Abstract, Arrow, Arrow Chart, Business, Design, Development, Diagram, Direction, Element, Flow, Flow Chart, Flow Diagram, Flowchart, Graph, Linear, Management, Model, Motion, Organization, Plan, Process, Process Arrows, Process Chart, Process Diagram, Process Flow, Program, Section, Segment, Set, Sign, Solution, Strategy, Symbol, Technology

Business Framework The Balanced Scorecard PowerPoint Presentation
This business diagram displays framework for comparison chart. It contains matrix chart for comparison of four products. This diagram enables the users to create their own display of the required processes in an easy way.

Ppt Linear Flow 4 Stages PowerPoint Templates
PPT linear flow 4 stages PowerPoint Templates-Use this Process circle arrow chart as a flow chart or a flow diagram, process model, or process map.-PPT linear flow 4 stages PowerPoint Templates-3d, Abstract, Arrow, Business, Cell, Color, Concept, Contrast, Corporation, Creativity, Design, Development, Element, Fantastic, Futuristic, Group, Icon, Illustration, Isolated, Large, Reflection, Render, Shape, Spheres

Demand Forecasting Advertising Promotion Ppt Example
This is a demand forecasting advertising promotion ppt example. This is a four stage process. The stages in this process circle chart marketing, business, success.
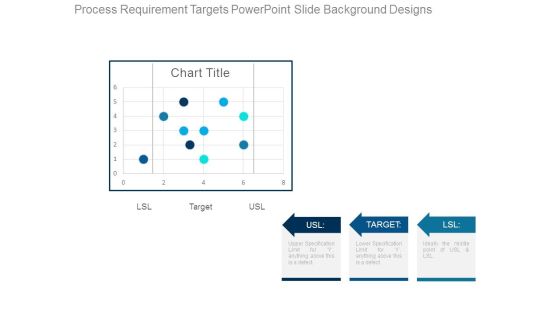
Process Requirement Targets Powerpoint Slide Background Designs
This is a process requirement targets powerpoint slide background designs. This is a four stage process. The stages in this process are lsl, usl, chart title, target.
Four Steps Circle With Social Media Icons Powerpoint Slides
This business slide illustrates four steps circle with social media icons. You may download this PowerPoint template to display social network and technology concepts. Chart the course you intend to take with this PPT slide.

 Home
Home