Purchasing Budget
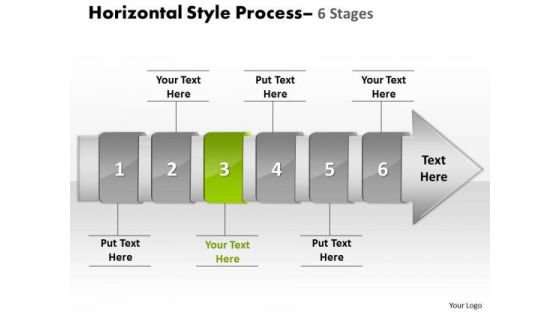
Ppt Theme Horizontal Flow Of 6 Stage Spider Diagram PowerPoint Template 4 Design
We present our PPT Theme horizontal flow of 6 stage spider diagram power point template 4 designs. Use our Arrows PowerPoint Templates because, our ready backdrops leave a lasting impression. Use our Shapes PowerPoint Templates because, it is in your DNA to analyses possible causes to the minutest detail. Use our Finance PowerPoint Templates because, Leadership Template: - Show them the way, be Captain of the ship and lead them to new shores. Use our Business PowerPoint Templates because, Marketing Strategy Business Template:- Maximizing sales of your product is the intended destination. Use our Process and Flows PowerPoint Templates because, Now use this slide to bullet point your views. Use these PowerPoint slides for presentations relating to accent, advertisement, arrow, badge, banner, business, button, collection, color, decoration, design, direction, element, financial, flow, graph, horizontal, instruction, isolated, label, manual, message, process, sale, set, shape, steps, symbol, template. The prominent colors used in the PowerPoint template are Green, Gray, and Black
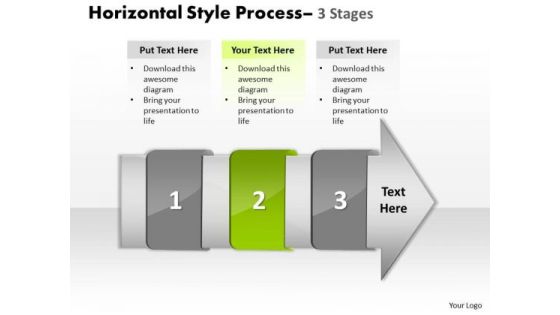
Ppt Theme Horizontal To Vertical Text Steps Working With Slide Numbers Demonstration 3 Graphic
We present our PPT Theme horizontal to vertical text steps working with slide numbers demonstration 3 Graphic. Use our Arrows PowerPoint Templates because, they help to lay the base of your trend of thought. Use our Shapes PowerPoint Templates because, Core Diagram: - Explore the various hues and layers existing in you are in your plans and processes. Use our Finance PowerPoint Templates because, Many a core idea has various enveloping layers. Use our Business PowerPoint Templates because, Marketing Strategy Business Template: - Maximizing sales of your product is the intended destination. Use our Process and Flows PowerPoint Templates because, are the stepping stones of our journey till date. Use these PowerPoint slides for presentations relating to accent, advertisement, arrow, badge, banner, business, button, collection, color, decoration, design, direction, element, financial, flow, graph, horizontal, instruction, isolated, label, manual, message, process, sale, set, shape, steps, symbol, template. The prominent colors used in the PowerPoint template are Green, Gray, and Black
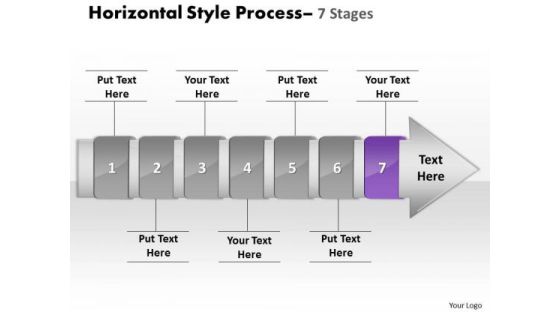
Ppt Background Non-linear PowerPoint Demonstration Of 7 Stages Activity 8 Image
We present our PPT Background non-linear PowerPoint demonstration of 7 stages activity 8 Image. Use our Arrows PowerPoint Templates because, Activities which in themselves have many inherent business opportunities. Use our Shapes PowerPoint Templates because, Like your thoughts arrows are inherently precise and true. Use our Finance PowerPoint Templates because, Business 3D Circular Puzzle:- Your business and plans for its growth consist of processes that are highly co-related. Use our Business PowerPoint Templates because, Marketing Strategy Business Template:- Maximizing sales of your product is the intended destination. Use our Process and Flows PowerPoint Templates because, they highlight the depth of your thought process. Use these PowerPoint slides for presentations relating to accent, advertisement, arrow, badge, banner, blank, business, button, collection, color, decoration, design, direction, element, financial, flow, graph, horizontal, instruction, label, menu, message, process, promotion, sale, set, shape, steps, symbol, template. The prominent colors used in the PowerPoint template are Purple, Gray, and Black

Last 90 Days Results Ppt PowerPoint Presentation Introduction
This is a last 90 days results ppt powerpoint presentation introduction. This is a six stage process. The stages in this process are revenue, new customers, gross profit, sales comparison.

Development In Past 10 Years Template 1 Ppt PowerPoint Presentation Infographics
This is a development in past 10 years template 1 ppt powerpoint presentation infographics. This is a ten stage process. The stages in this process are net sales, other income, ebita margins, profit before tax, taxes.

Financial Highlights Template 2 Ppt PowerPoint Presentation Inspiration
This is a financial highlights template 2 ppt powerpoint presentation inspiration. This is a six stage process. The stages in this process are sales revenue, ebitdax, net profit after tax, production, operating cash flow, underlying net profit, after tax.
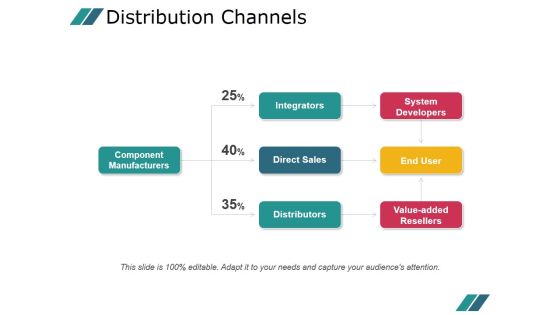
Distribution Channels Ppt PowerPoint Presentation Ideas
This is a distribution channels ppt powerpoint presentation ideas. This is a three stage process. The stages in this process are component manufacturers, integrators, direct sales, distributors, system developers, end user, value added resellers.
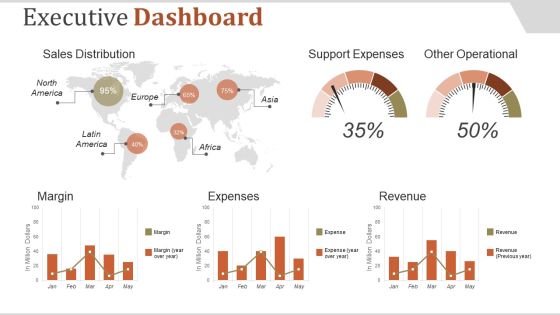
Executive Dashboard Ppt PowerPoint Presentation Introduction
This is a executive dashboard ppt powerpoint presentation introduction. This is a five stage process. The stages in this process are sales distribution, support expenses, other operational, margin, expenses.

Market Trends Ppt PowerPoint Presentation Model Background Images
This is a market trends ppt powerpoint presentation model background images. This is a two stage process. The stages in this process are our analysis, montana, texas, sales in texas.

Content Marketing Performance Template 1 Ppt PowerPoint Presentation Infographics Graphics Example
This is a content marketing performance template 1 ppt powerpoint presentation infographics graphics example. This is a eight stage process. The stages in this process are brand awareness, engagement, sales, lead generation, customer retention lead nurturing, upsell.

Profitability Ratios Template 1 Ppt PowerPoint Presentation Outline Information
This is a profitability ratios template 1 ppt powerpoint presentation outline information. This is a two stage process. The stages in this process are net profit ratio, gross profit ratio, net profit after tax, net sales.

Company Objectives Template 1 Ppt PowerPoint Presentation Styles Infographics
This is a company objectives template 1 ppt powerpoint presentation styles infographics. This is a one stage process. The stages in this process are current customer base, number of sales by, market share, operational expenses.

Clustered Column Ppt PowerPoint Presentation Icon Design Inspiration
This is a clustered column ppt powerpoint presentation icon design inspiration. This is a two stage process. The stages in this process are product, financial year, sales in percentage, clustered column.

Bar Graph Ppt PowerPoint Presentation Visual Aids Model
This is a bar graph ppt powerpoint presentation visual aids model. This is a three stage process. The stages in this process are business, strategy, analysis, planning, sales in percentage.
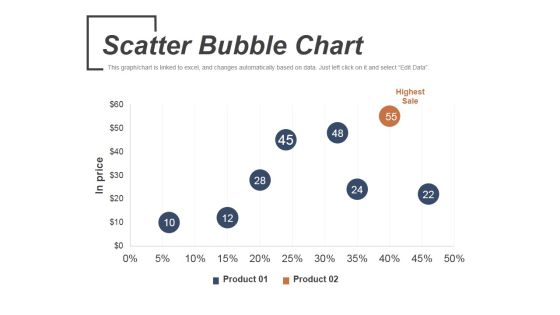
Scatter Bubble Chart Ppt PowerPoint Presentation Infographic Template Graphics
This is a scatter bubble chart ppt powerpoint presentation infographic template graphics. This is a two stage process. The stages in this process are highest sale, product, in price.

Activity Ratios Template 2 Ppt PowerPoint Presentation Layouts Clipart Images
This is a activity ratios template 2 ppt powerpoint presentation layouts clipart images. This is a two stage process. The stages in this process are inventory turnover, receivables turnover, avg inventory, net credit sales, average accounts receivable.

Area Chart Ppt PowerPoint Presentation Infographics Graphics Tutorials
This is a area chart ppt powerpoint presentation infographics graphics tutorials. This is a two stage process. The stages in this process are product, area chart, sales in percentage.

Bar Chart Ppt PowerPoint Presentation Slides Design Ideas
This is a bar chart ppt powerpoint presentation slides design ideas. This is a six stage process. The stages in this process are product, bar chart, sales in percentage.

Clustered Column Line Ppt PowerPoint Presentation File Examples
This is a clustered column line ppt powerpoint presentation file examples. This is a three stage process. The stages in this process are sales in percentage, product, business, marketing, success.
Plan And Pricing Ppt PowerPoint Presentation Icon Templates
This is a plan and pricing ppt powerpoint presentation icon templates. This is a three stage process. The stages in this process are package, pricing, business, sales, success, strategy.

Area Chart Ppt PowerPoint Presentation Slides Deck
This is a area chart ppt powerpoint presentation slides deck. This is a two stage process. The stages in this process are financial, sales in percentage, business, marketing, management.

Bar Graph Ppt PowerPoint Presentation Infographic Template Template
This is a bar graph ppt powerpoint presentation infographic template template. This is a three stage process. The stages in this process are bar graph, sales in percentage, product, planning, business.

Clustered Column Line Chart Ppt PowerPoint Presentation File Pictures
This is a clustered column line chart ppt powerpoint presentation file pictures. This is a four stage process. The stages in this process are clustered bar, product, planning, business, sales in percentage.
Market Segmentation Evaluation Ppt PowerPoint Presentation Icon Pictures
This is a market segmentation evaluation ppt powerpoint presentation icon pictures. This is a two stage process. The stages in this process are net profit, in usd millions, market sales, business, marketing.

Bar Chart Ppt PowerPoint Presentation Professional Files
This is a bar chart ppt powerpoint presentation professional files. This is a seven stage process. The stages in this process are bar chart, product, sales in percentage, financial years.
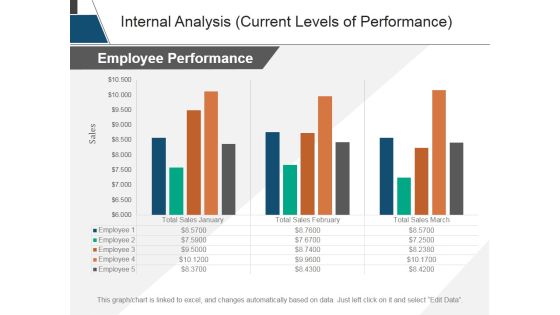
Internal Analysis Current Levels Of Performance Ppt PowerPoint Presentation Tips
This is a internal analysis current levels of performance ppt powerpoint presentation tips. This is a three stage process. The stages in this process are sales, employee performance, years, business, marketing.
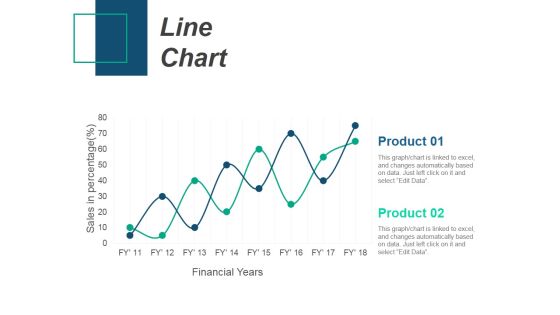
Line Chart Ppt PowerPoint Presentation Infographic Template Introduction
This is a line chart ppt powerpoint presentation infographic template introduction. This is a two stage process. The stages in this process are product, sales in percentage, financial years, line chart.

Clustered Column Line Ppt PowerPoint Presentation Model Images
This is a clustered column line ppt powerpoint presentation model images. This is a four stage process. The stages in this process are sales in percentage, product, business, marketing, bar graph.
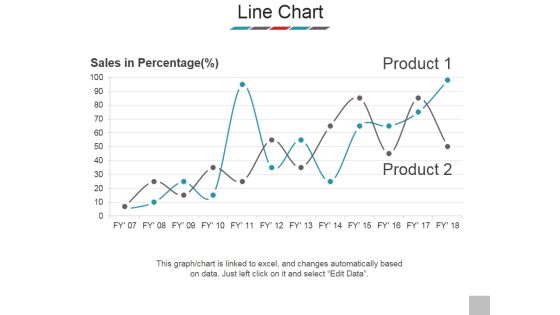
Line Chart Ppt PowerPoint Presentation Outline Samples
This is a line chart ppt powerpoint presentation outline samples. This is a two stage process. The stages in this process are sales in percentage, product, business, marketing, success.

Bar Graph Ppt PowerPoint Presentation Model Clipart
This is a bar graph ppt powerpoint presentation model clipart. This is a six stage process. The stages in this process are sales in percentage, product, bar graph, business, marketing.

Area Chart Ppt PowerPoint Presentation Inspiration Rules
This is a area chart ppt powerpoint presentation inspiration rules. This is a two stage process. The stages in this process are area chart, business, marketing, sales in percentage, product.
Line Chart Ppt PowerPoint Presentation Infographic Template Icons
This is a line chart ppt powerpoint presentation infographic template icons. This is a two stage process. The stages in this process are sales in percentage, financial years, product, line chart.

Pipeline Quality Template 2 Ppt PowerPoint Presentation Inspiration Show
This is a pipeline quality template 2 ppt powerpoint presentation inspiration show. This is a one stage process. The stages in this process are sales stage, opportunity age, pipeline, quality, line chart.

Bar Graph Ppt PowerPoint Presentation Slides Visual Aids
This is a bar graph ppt powerpoint presentation slides visual aids. This is a three stage process. The stages in this process are sales in percentage, bar graph, business, marketing, success.
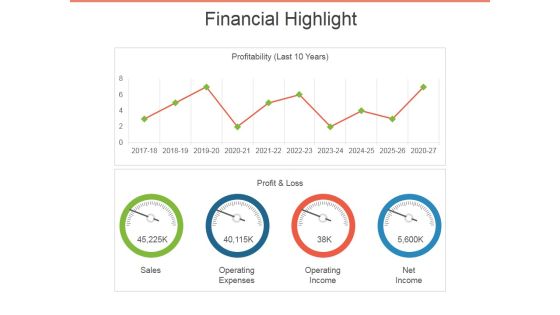
Financial Highlight Template 2 Ppt PowerPoint Presentation Outline Visuals
This is a financial highlight template 2 ppt powerpoint presentation outline visuals. This is a two stage process. The stages in this process are sales, profit and loss, operating expenses, operating income, net income.
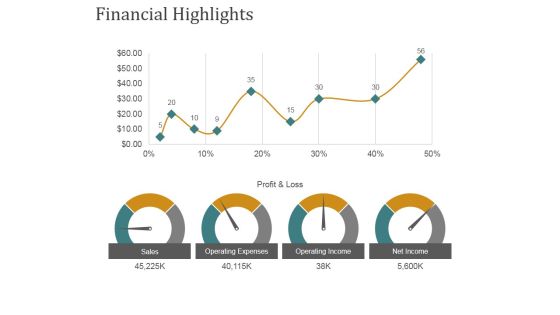
Financial Highlights Template 1 Ppt PowerPoint Presentation Gallery Templates
This is a financial highlights template 1 ppt powerpoint presentation gallery templates. This is a four stage process. The stages in this process are sales, operating expenses, operating income, net income.

Bar Graph Ppt PowerPoint Presentation Outline Layout
This is a bar graph ppt powerpoint presentation outline layout. This is a four stage process. The stages in this process are sales in percentage, product, bar graph, business, marketing.

Clustered Column Line Ppt PowerPoint Presentation Outline Infographic Template
This is a clustered column line ppt powerpoint presentation outline infographic template. This is a three stage process. The stages in this process are product, sales in percentage, business, marketing, success.
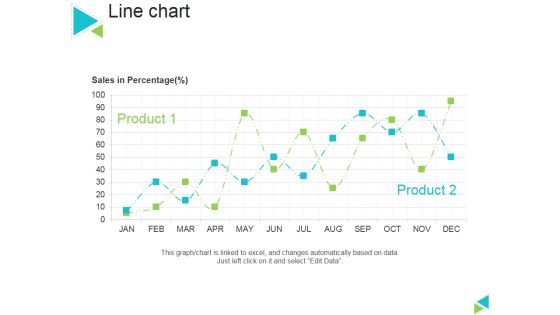
Line Chart Ppt PowerPoint Presentation Gallery Master Slide
This is a line chart ppt powerpoint presentation gallery master slide. This is a two stage process. The stages in this process are sales in percentage, product, line chart.

Line Bubble Chart Ppt PowerPoint Presentation Portfolio Slide Portrait
This is a line bubble chart ppt powerpoint presentation portfolio slide portrait. This is a six stage process. The stages in this process are highest profit, financial year, profit in sales, growth, business.

Clustered Column Line Ppt PowerPoint Presentation Model Rules
This is a clustered column line ppt powerpoint presentation model rules. This is a four stage process. The stages in this process are financial year, sales in percentage, business, marketing, growth, graph.

Activity Ratios Template 4 Ppt PowerPoint Presentation Styles Slideshow
This is a activity ratios template 4 ppt powerpoint presentation styles slideshow. This is a two stage process. The stages in this process are total asset turnover, fixed assets turnover, net sales, year, net profit ratio, gross profit ratio.

Bliss Investor Capital Raising Elevator Pitch Deck Subscription Based Pricing Model Of Bliss Infographics PDF
This slide covers the subscription based pricing model for startups, team and enterprise on the basis of number of projects dealing by companies.Deliver an awe inspiring pitch with this creative Bliss Investor Capital Raising Elevator Pitch Deck Subscription Based Pricing Model Of Bliss Infographics PDF bundle. Topics like Enterprise, Multiple Projects, Business Focusing can be discussed with this completely editable template. It is available for immediate download depending on the needs and requirements of the user.

Potentials Of A Good Application Programming Interface In Business Brochure PDF
This slide covers the potentials related to API Application Program Interface in business which includes increase revenue, extend reach of customers, help sales generate etc. This is a potentials of a good application programming interface in business brochure pdf template with various stages. Focus and dispense information on six stages using this creative set, that comes with editable features. It contains large content boxes to add your information on topics like increase revenue, ease of integration of data and applications on backend, stimulate economic and technological creativity. You can also showcase facts, figures, and other relevant content using this PPT layout. Grab it now.

Responsible Technology Playbook Materiality Matrix Assessment Overview About Duration Diagrams PDF
This slide provides information regarding materiality matrix as a responsible tech approach that helps in detecting social, economic concerns affecting stakeholders. The approach is utilized during early stage of product lifecycle and by stakeholders, etc. Make sure to capture your audiences attention in your business displays with our gratis customizable Responsible Technology Playbook Materiality Matrix Assessment Overview About Duration Diagrams PDF. These are great for business strategies, office conferences, capital raising or task suggestions. If you desire to acquire more customers for your tech business and ensure they stay satisfied, create your own sales presentation with these plain slides.

Steps To Conduct Competitor Analysis Pestle Analysis To Determine External Factors Formats PDF
This slide showcases PESTLE analysis to recognize external factors affecting rival business for marketing planning and strategy development. The analysis consists of factors such as political, economic, social, technical, environmental and legal. Make sure to capture your audiences attention in your business displays with our gratis customizable Steps To Conduct Competitor Analysis Pestle Analysis To Determine External Factors Formats PDF. These are great for business strategies, office conferences, capital raising or task suggestions. If you desire to acquire more customers for your tech business and ensure they stay satisfied, create your own sales presentation with these plain slides.
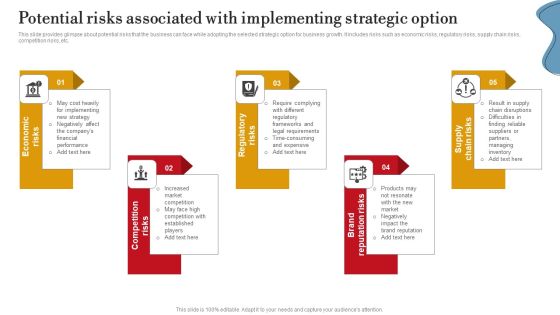
Potential Risks Associated With Implementing Strategic Option Ppt PowerPoint Presentation File Ideas PDF
This slide provides glimpse about potential risks that the business can face while adopting the selected strategic option for business growth. It includes risks such as economic risks, regulatory risks, supply chain risks, competition risks, etc. Make sure to capture your audiences attention in your business displays with our gratis customizable Potential Risks Associated With Implementing Strategic Option Ppt PowerPoint Presentation File Ideas PDF. These are great for business strategies, office conferences, capital raising or task suggestions. If you desire to acquire more customers for your tech business and ensure they stay satisfied, create your own sales presentation with these plain slides.

Pest Analysis Business Model Cycle Process Chart PowerPoint Templates
We present our pest analysis business model Cycle Process Chart PowerPoint templates.Download and present our Marketing PowerPoint Templates because customer satisfaction is a mantra of the marketplace. Building a loyal client base is an essential element of your business. Download our Business PowerPoint Templates because this slide represents the tools of the trade. Download and present our Leadership PowerPoint Templates because the mind is always whirring with new ideas. Present our Circle Charts PowerPoint Templates because you can Place them where they need to be. Download and present our Shapes PowerPoint Templates because you can Focus on each one and investigate which one would be the best fit for your needs.Use these PowerPoint slides for presentations relating to Analysis, Analyze, Blackboard, Board, Business, Chalk, Chalkboard, Chart, Component, Concept, Diagram, Direction, Economic, Education, Environmental, Factors, Framework, Graph, Graphics, Illustration, Law, Leadership, Management, Market, Market, Research, Model, Operations, Pest, Political, Position, Potential. The prominent colors used in the PowerPoint template are Red, Yellow, Green. We assure you our pest analysis business model Cycle Process Chart PowerPoint templates are Lush. Customers tell us our Board PowerPoint templates and PPT Slides are incredible easy to use. The feedback we get is that our pest analysis business model Cycle Process Chart PowerPoint templates are Fantastic. We assure you our Blackboard PowerPoint templates and PPT Slides are Perfect. People tell us our pest analysis business model Cycle Process Chart PowerPoint templates are the best it can get when it comes to presenting. We assure you our Chalk PowerPoint templates and PPT Slides look good visually.

Cross Channel Marketing Benefits XYZ Marketing Company Business Overview Details Diagrams PDF
This slide shows the business details of XYZ Marketing Company such as employees, current digital channel strategy multichannel of the company, annual revenue, estimated rise in Sales after using omnichannel strategy, estimated rise in mobile traffic frequency, business offerings, CEO, Headquarters etc. Presenting cross channel marketing benefits XYZ marketing company business overview details diagrams pdf to provide visual cues and insights. Share and navigate important information on ten stages that need your due attention. This template can be used to pitch topics like annual revenue 2019, digital channel strategy that must be used in 2020, customer retention rate in 2019, expected rise in mobile traffic frequency in 2020. In addtion, this PPT design contains high-resolution images, graphics, etc, that are easily editable and available for immediate download.
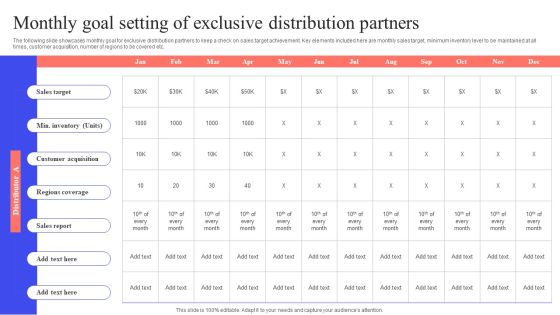
Implementing Effective Distribution Monthly Goal Setting Of Exclusive Distribution Partners Sample PDF
The following slide showcases monthly goal for exclusive distribution partners to keep a check on sales target achievement. Key elements included here are monthly sales target, minimum inventory level to be maintained at all times, customer acquisition, number of regions to be covered etc. Boost your pitch with our creative Implementing Effective Distribution Monthly Goal Setting Of Exclusive Distribution Partners Sample PDF. Deliver an awe-inspiring pitch that will mesmerize everyone. Using these presentation templates you will surely catch everyones attention. You can browse the ppts collection on our website. We have researchers who are experts at creating the right content for the templates. So you dont have to invest time in any additional work. Just grab the template now and use them.

Addressing The Objectives For Opening New Retail Store Opening Retail Store In Untapped Professional PDF
The following slide showcases various objectives for the grand opening of new retail store. The major objectives are increasing the sales per square foot, average transaction value, sales per employee, store footfall and customer retention rate.Boost your pitch with our creative Addressing The Objectives For Opening New Retail Store Opening Retail Store In Untapped Professional PDF. Deliver an awe-inspiring pitch that will mesmerize everyone. Using these presentation templates you will surely catch everyones attention. You can browse the ppts collection on our website. We have researchers who are experts at creating the right content for the templates. So you do not have to invest time in any additional work. Just grab the template now and use them.

Community Engagement Platform Fundraising Pitch Deck Exit Strategy Diagrams PDF
This slide represents most feasible ways for investors to exit from the investment in the company. It includes strategies such as mergers and acquisitions, IPO, and private sales. Slidegeeks is here to make your presentations a breeze with Community Engagement Platform Fundraising Pitch Deck Exit Strategy Diagrams PDF With our easy to use and customizable templates, you can focus on delivering your ideas rather than worrying about formatting. With a variety of designs to choose from, you are sure to find one that suits your needs. And with animations and unique photos, illustrations, and fonts, you can make your presentation pop. So whether you are giving a sales pitch or presenting to the board, make sure to check out Slidegeeks first.

Determine Different Responsibilities Of People Associated To Bidding Developing Fixed Bid Projects Using Agile IT Structure PDF
This slide provides information regarding various responsibilities of people associated to bidding and proposal building through agile scrum such as sales organization as product owner, bid manager as scrum master and development team comprise of writers, solution architects and reviewers. This is a determine different responsibilities of people associated to bidding developing fixed bid projects using agile it structure pdf template with various stages. Focus and dispense information on three stages using this creative set, that comes with editable features. It contains large content boxes to add your information on topics like effective, communication, development, training, implemented. You can also showcase facts, figures, and other relevant content using this PPT layout. Grab it now.

Critical Drivers Of Organizational Success Example Ppt Slide Template
This is a critical drivers of organizational success example ppt slide template. This is a seven stage process. The stages in this process are sale, productivity, expense control, cash flow, regulatory compliance, customer service, developmental projects.
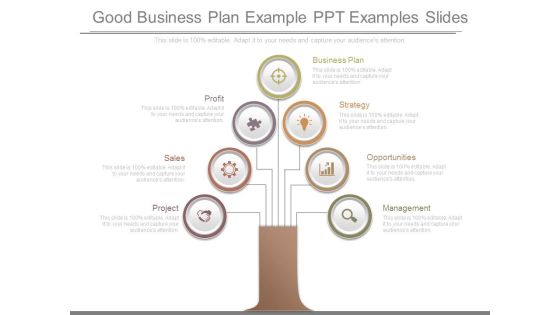
Good Business Plan Example Ppt Examples Slides
This is a good business plan example ppt examples slides. This is a seven stage process. The stages in this process are profit, sales, project, management, opportunities, strategy, business plan.
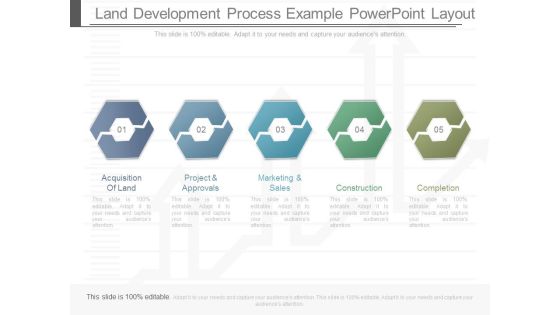
Land Development Process Example Powerpoint Layout
This is a land development process example powerpoint layout. This is a five stage process. The stages in this process are acquisition of land, project and approvals, marketing and sales, construction, completion.
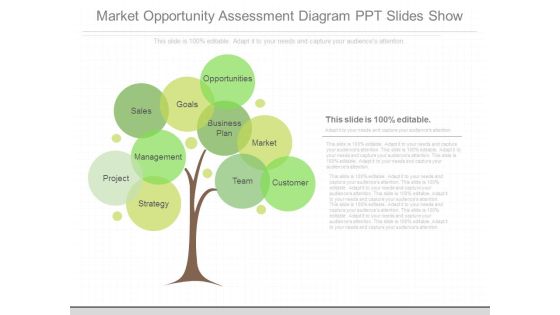
Market Opportunity Assessment Diagram Ppt Slides Show
This is a market opportunity assessment diagram ppt slides show. This is a ten stage process. The stages in this process are management, sales, project, strategy, team, customer, business plan, goals, opportunities, market.

Operations Plan Ppt PowerPoint Presentation Pictures Example
This is a operations plan ppt powerpoint presentation pictures example. This is a three stage process. The stages in this process are key initiatives, prioritization, project lead, sales, marketing.

Operations Plan Ppt PowerPoint Presentation Infographic Template Example 2015
This is a operations plan ppt powerpoint presentation infographic template example 2015. This is a six stage process. The stages in this process are key initiatives, prioritization, project lead, sales, marketing.

Content Ppt PowerPoint Presentation Infographics
This is a content ppt powerpoint presentation infographics. This is a five stage process. The stages in this process are business overview, sales performance, project updates, competitive analysis, future perspective.
 Home
Home