Promotion Plan

Monthly Profit And Loss Reports Of A Retail Store Download PDF
This slide shows a monthly profit and loss transactions account. It constitutes figures of utmost significance, viz, operating income, non-operating income, etc.Showcasing this set of slides titled Monthly Profit And Loss Reports Of A Retail Store Download PDF. The topics addressed in these templates are Operating Expenses, Advertisement Expenses, Depreciation Expense. All the content presented in this PPT design is completely editable. Download it and make adjustments in color, background, font etc. as per your unique business setting.

Unconstrained Investment Selection Process Chart Diagram
This is a unconstrained investment selection process chart diagram. This is a six stage process. The stages in this process are portfolio decision making, fundamental financial principles, client centric, economic guidance, optimal investment selection, strategic and tactical, allocation, market trends and cycles.

Four Circles Spaghetti Chart Powerpoint Slides Design
This is a four circles spaghetti chart powerpoint slides design. This is a three stage process. The stages in this process are spaghetti diagram also used to described movement of people in a factory or office motion is waste, arrow, business, marketing, circles.
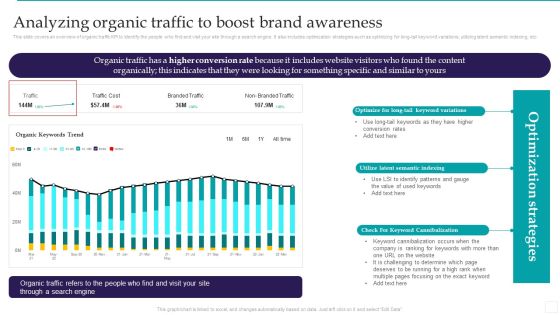
Optimizing Marketing Analytics To Enhance Organizational Growth Analyzing Organic Traffic To Boost Brand Ideas PDF
This slide covers an overview of organic traffic KPI to identify the people who find and visit your site through a search engine. It also includes optimization strategies such as optimizing for long tail keyword variations, utilizing latent semantic indexing, etc. Take your projects to the next level with our ultimate collection of Optimizing Marketing Analytics To Enhance Organizational Growth Analyzing Organic Traffic To Boost Brand Ideas PDF. Slidegeeks has designed a range of layouts that are perfect for representing task or activity duration, keeping track of all your deadlines at a glance. Tailor these designs to your exact needs and give them a truly corporate look with your own brand colors they will make your projects stand out from the rest.
Optimizing Marketing Analytics To Enhance Organizational Growth Tracking Social Media Engagement Rate Sample PDF
This slide covers an overview of the social media engagement rate to identify if the content is reaching the target audience. It also includes improvement strategies such as having a consistent, authentic voice, knowing your algorithms, and creating shareable content. Slidegeeks is here to make your presentations a breeze with Optimizing Marketing Analytics To Enhance Organizational Growth Tracking Social Media Engagement Rate Sample PDF With our easy to use and customizable templates, you can focus on delivering your ideas rather than worrying about formatting. With a variety of designs to choose from, you are sure to find one that suits your needs. And with animations and unique photos, illustrations, and fonts, you can make your presentation pop. So whether you are giving a sales pitch or presenting to the board, make sure to check out Slidegeeks first.

Complete Strategic Manual For Direct Mail Marketing Cost Breakdown For Conducting Direct Mail Campaign Rules PDF
This slide covers cost breakdown for conducting effective mail campaign. It involves strategies such as postcards mailing, lead letters, catalogue and self mailing and key reasons such as instant gratification and better description of products. This Complete Strategic Manual For Direct Mail Marketing Cost Breakdown For Conducting Direct Mail Campaign Rules PDF from Slidegeeks makes it easy to present information on your topic with precision. It provides customization options, so you can make changes to the colors, design, graphics, or any other component to create a unique layout. It is also available for immediate download, so you can begin using it right away. Slidegeeks has done good research to ensure that you have everything you need to make your presentation stand out. Make a name out there for a brilliant performance.
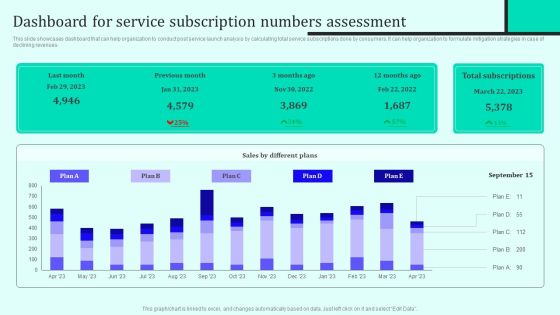
Implementing New Sales And Marketing Process For Services Dashboard For Service Subscription Diagrams PDF
This slide showcases dashboard that can help organization to conduct post service launch analysis by calculating total service subscriptions done by consumers. It can help organization to formulate mitigation strategies in case of declining revenues. Boost your pitch with our creative Implementing New Sales And Marketing Process For Services Dashboard For Service Subscription Diagrams PDF. Deliver an awe inspiring pitch that will mesmerize everyone. Using these presentation templates you will surely catch everyones attention. You can browse the ppts collection on our website. We have researchers who are experts at creating the right content for the templates. So you do not have to invest time in any additional work. Just grab the template now and use them.

Marketing Success Metrics Analyzing Landing Page Views To Drive More Web Traffic Slides PDF
This slide covers an overview of page view kpi to identify which pages drive the most traffic and which are underperforming. it also includes improvement strategies such as push notifications, yes or yes campaigns, and popups for related articles. The Marketing Success Metrics Analyzing Landing Page Views To Drive More Web Traffic Slides PDF is a compilation of the most recent design trends as a series of slides. It is suitable for any subject or industry presentation, containing attractive visuals and photo spots for businesses to clearly express their messages. This template contains a variety of slides for the user to input data, such as structures to contrast two elements, bullet points, and slides for written information. Slidegeeks is prepared to create an impression.

Workforce Development Checklist For Digital Marketing Employees Background PDF
Following slide depicts the employee training checklist for digital marketing to aware target audience regarding the brand. It includes various training subjects like perform different SEO, content marketing, email marketing, etc. Showcasing this set of slides titled Workforce Development Checklist For Digital Marketing Employees Background PDF. The topics addressed in these templates are Content Marketing, Email Marketing, Select Online Marketing Channel. All the content presented in this PPT design is completely editable. Download it and make adjustments in color, background, font etc. as per your unique business setting.

Benefits Of Effective Lean Techniques And Management Ppt PowerPoint Presentation Styles Design Inspiration
This is a benefits of effective lean techniques and management ppt powerpoint presentation styles design inspiration. This is a seven stage process. The stages in this process are finance, marketing, management, investment, analysis.
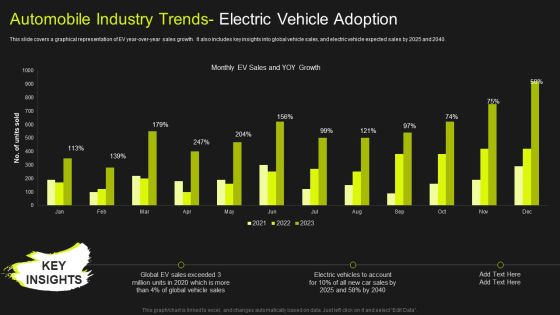
Global Automobile Market Analysis Automobile Industry Trends Electric Vehicle Adoption Mockup PDF
This slide covers a graphical representation of EV year-over-year sales growth. It also includes key insights into global vehicle sales, and electric vehicle expected sales by 2025 and 2040. If you are looking for a format to display your unique thoughts, then the professionally designed Global Automobile Market Analysis Automobile Industry Trends Electric Vehicle Adoption Mockup PDF is the one for you. You can use it as a Google Slides template or a PowerPoint template. Incorporate impressive visuals, symbols, images, and other charts. Modify or reorganize the text boxes as you desire. Experiment with shade schemes and font pairings. Alter, share or cooperate with other people on your work. Download Global Automobile Market Analysis Automobile Industry Trends Electric Vehicle Adoption Mockup PDF and find out how to give a successful presentation. Present a perfect display to your team and make your presentation unforgettable.
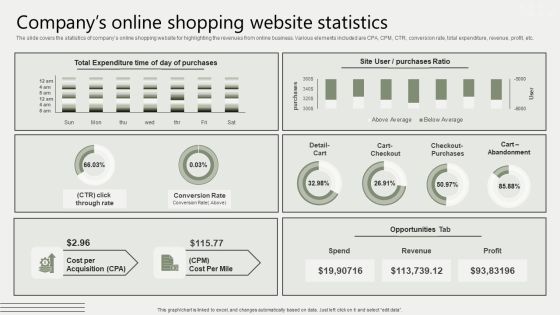
Global Business Market Development Guide Companys Online Shopping Website Statistics Background PDF
The slide covers the statistics of companys online shopping website for highlighting the revenues from online business. Various elements included are CPA, CPM, CTR, conversion rate, total expenditure, revenue, profit, etc. If you are looking for a format to display your unique thoughts, then the professionally designed Global Business Market Development Guide Companys Online Shopping Website Statistics Background PDF is the one for you. You can use it as a Google Slides template or a PowerPoint template. Incorporate impressive visuals, symbols, images, and other charts. Modify or reorganize the text boxes as you desire. Experiment with shade schemes and font pairings. Alter, share or cooperate with other people on your work. Download Global Business Market Development Guide Companys Online Shopping Website Statistics Background PDF and find out how to give a successful presentation. Present a perfect display to your team and make your presentation unforgettable.
Bar Chart Business PowerPoint Template 0810
3D illustration of a colorful multi-segment bar chart over top of a light blue textured background with plenty of open space for your text
Organization Chart For Small Business Ppt Example
This is a organization chart for small business ppt example. This is a four stage process. The stages in this process are development, sales, management, production.

Sales Performance Measures Chart Ppt Sample
This is a sales performance measures chart ppt sample. This is a three stage process. The stages in this process are product, relationship, service, sales.

Brand Drivers Flow Chart Powerpoint Layout
This is a brand drivers flow chart powerpoint layout. This is a four stage process. The stages in this process are difference, value, awareness, emotion, the brand drivers.
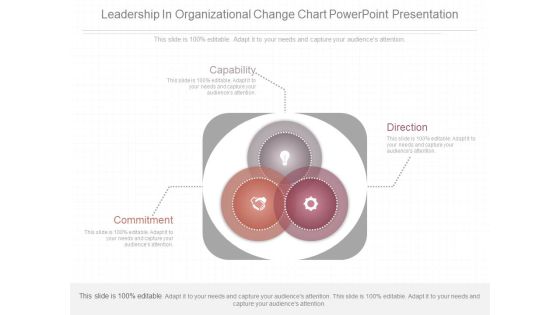
Leadership In Organizational Change Chart Powerpoint Presentation
This is a leadership in organizational change chart powerpoint presentation. This is a three stage process. The stages in this process are capability, direction, commitment.

Human Capital Management Chart Powerpoint Topics
This is a human capital management chart powerpoint topics. This is a four stage process. The stages in this process are talent, success, career, opportunity.

Customer Centered Capabilities Chart Ppt Slides
This is a customer centered capabilities chart ppt slides. This is a five stage process. The stages in this process are community, operations, people, finance, customer.

Business Training Components Chart Sample Presentation Ppt
This is a business training components chart sample presentation ppt. This is a three stage process. The stages in this process are training, knowledge, skills, competencies.

Big Data Solution Chart Diagram Ppt Slides
This is a big data solution chart diagram ppt slides. This is a four stage process. The stages in this process are design, decide, deposit, discover.

Data Analysis Workflow Chart Powerpoint Slides
This is a data analysis workflow chart powerpoint slides. This is a three stage process. The stages in this process are connect, visualize, share.
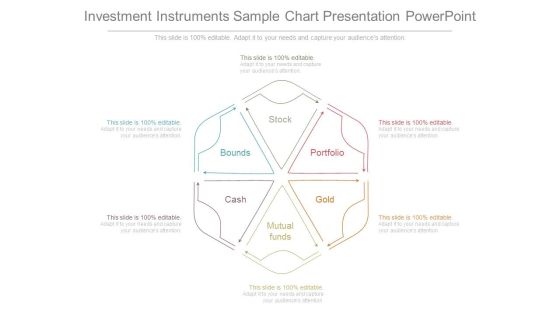
Investment Instruments Sample Chart Presentation Powerpoint
This is a investment instruments sample chart presentation powerpoint. This is a six stage process. The stages in this process are stock, portfolio, gold, mutual funds, cash, bounds.

Cost Structure Analysis Chart Ppt Slides Download
This is a cost structure analysis chart ppt slides download. This is a three stage process. The stages in this process are cost analysis, benefit, cost tracking.
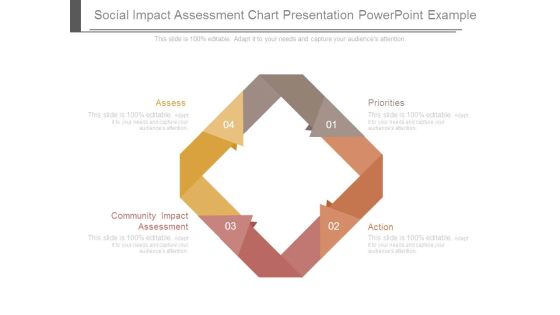
Social Impact Assessment Chart Presentation Powerpoint Example
This is a social impact assessment chart presentation powerpoint example. This is a four stage process. The stages in this process are assess, community impact assessment, priorities, action.
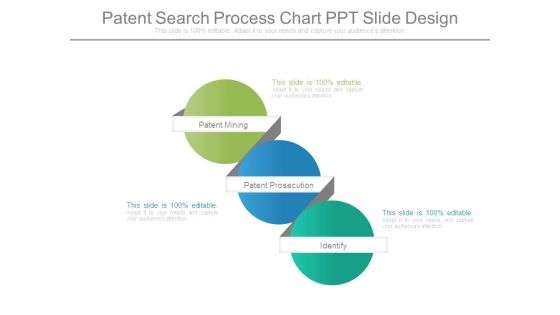
Patent Search Process Chart Ppt Slide Design
This is a patent search process chart ppt slide design. This is a three stage process. The stages in this process are patent mining, patent prosecution, identify.

Productivity Systems Sample Chart Ppt Design
This is a productivity systems sample chart ppt design. This is a seven stage process. The stages in this process are time, energy, attention, assesse, transition, manage, productivity.

Economic Order Quantity Chart Ppt Example File
This is a economic order quantity chart ppt example file. This is a four stage process. The stages in this process are inventory cost, ordering, carrying, eoq model.
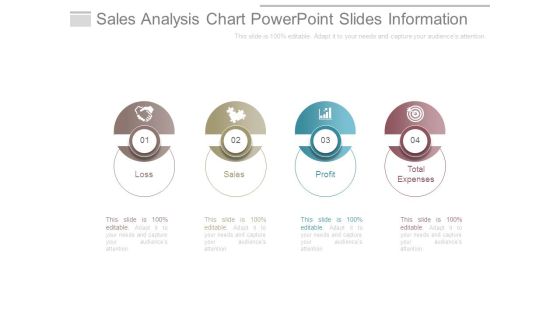
Sales Analysis Chart Powerpoint Slides Information
This is a sales analysis chart powerpoint slides information. This is a four stage process. The stages in this process are loss, sales, profit, total expenses.

Company Growth Chart Template Powerpoint Slide Rules
This is a company growth chart template powerpoint slide rules. This is a five stage process. The stages in this process are vision, objectives, research, forming, performing.
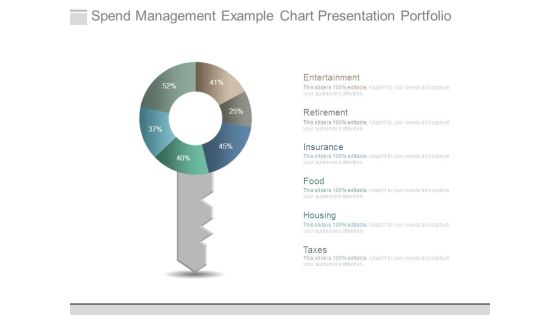
Spend Management Example Chart Presentation Portfolio
This is a spend management example chart presentation portfolio. This is a six stage process. The stages in this process are entertainment, retirement, insurance, food, housing, taxes.
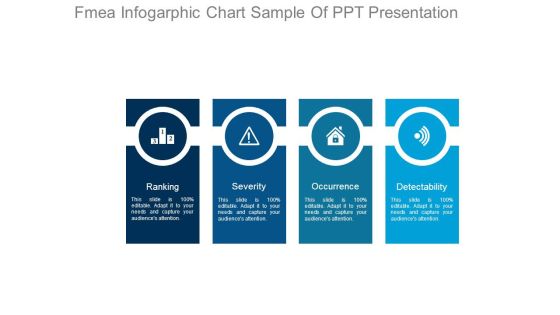
Fmea Infogarphic Chart Sample Of Ppt Presentation
This is a fmea infogarphic chart sample of ppt presentation. This is a four stage process. The stages in this process are ranking, severity, occurrence, detectability.

Process Development Steps Chart Presentation Powerpoint Example
This is a process development steps chart presentation powerpoint example. This is a three stage process. The stages in this process are too much variation, specification, good, great.

Key Skills Circle Chart Ppt Infographics
This is a key skills circle chart ppt infographics. This is a five stage process. The stages in this process are questioning, researching, analyzing, evaluating, communicating, key skills.

Business Model Process Chart Ppt Examples Slides
This is a business model process chart ppt examples slides. This is a four stage process. The stages in this process are free.

Business Model Chart Powerpoint Slide Show
This is a business model chart powerpoint slide show. This is a four stage process. The stages in this process are free.

Change Management Flow Chart Ppt Presentation
This is a change management flow chart ppt presentation. This is a four stage process. The stages in this process are defined goals, implementation, diagnosis, learning.

Demographic Segmentation Timeline Chart Ppt Background
This is a demographic segmentation timeline chart ppt background. This is a five stage process. The stages in this process are industry, company size, location.

Personal Characteristics Chart Ppt Slides Download
This is a personal characteristics chart ppt slides download. This is a two stage process. The stages in this process are loyalty, attitude, personal characteristics.
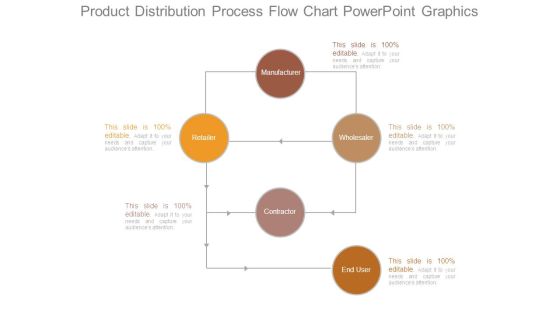
Product Distribution Process Flow Chart Powerpoint Graphics
This is a product distribution process flow chart powerpoint graphics. This is a five stage process. The stages in this process are manufacturer, retailer, wholesaler, contractor, end user.

Distribution Flow Chart For Product Ppt Summary
This is a distribution flow chart for product ppt summary. This is a five stage process. The stages in this process are retailer, manufacturer, contractor, end user, wholesaler.

Pie Chart Ppt PowerPoint Presentation Professional Introduction
This is a pie chart ppt powerpoint presentation professional introduction. This is a five stage process. The stages in this process are product, finance, pie, process, business.
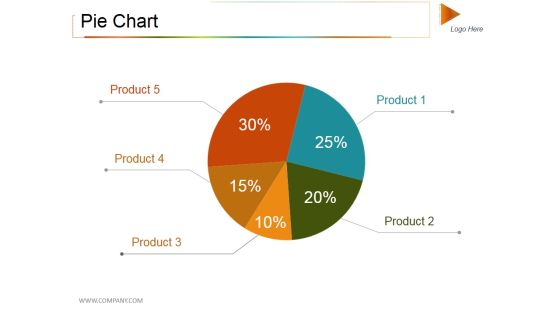
Pie Chart Ppt PowerPoint Presentation Styles Objects
This is a pie chart ppt powerpoint presentation styles objects. This is a five stage process. The stages in this process are pie, process, percentage, finance, business.

Column Chart Ppt PowerPoint Presentation Show Visuals
This is a column chart ppt powerpoint presentation show visuals. This is a two stage process. The stages in this process are product, year, success, step, business.

Donut Chart Ppt PowerPoint Presentation Gallery Guide
This is a donut chart ppt powerpoint presentation gallery guide. This is a six stage process. The stages in this process are percentage, finance, donut, business, process.

Area Chart Ppt PowerPoint Presentation Inspiration Demonstration
This is a area chart ppt powerpoint presentation inspiration demonstration. This is a two stage process. The stages in this process are sales in percentage, chart, percentage, business, marketing.

Area Chart Ppt PowerPoint Presentation Portfolio Templates
This is a area chart ppt powerpoint presentation portfolio templates. This is a two stage process. The stages in this process are sales in percentage, chart, business, marketing, finance.

Bar Chart Ppt PowerPoint Presentation Icon Layout
This is a bar chart ppt powerpoint presentation icon layout. This is a one stage process. The stages in this process are sales in percentage, financial years, bar chart, finance, marketing.

Bar Chart Ppt PowerPoint Presentation Slide Download
This is a bar chart ppt powerpoint presentation slide download. This is a three stage process. The stages in this process are chart, in years, unit count, business, marketing.

Area Chart Ppt PowerPoint Presentation Model Introduction
This is a area chart ppt powerpoint presentation model introduction. This is a two stage process. The stages in this process are sales in percentage, area chart, percentage, business, marketing.

Area Chart Ppt PowerPoint Presentation Inspiration Professional
This is a area chart ppt powerpoint presentation inspiration professional. This is a two stage process. The stages in this process are financial year, in percentage, area chart, finance, business, marketing.

Area Chart Ppt PowerPoint Presentation Styles Show
This is a area chart ppt powerpoint presentation styles show. This is a two stage process. The stages in this process are business, marketing, area chart, sales in percentage, percentage.

Area Chart Ppt PowerPoint Presentation Model Slides
This is a area chart ppt powerpoint presentation model slides. This is a two stage process. The stages in this process are business, marketing, sales in percentage, chart, percentage, finance.

Area Chart Ppt PowerPoint Presentation Ideas Professional
This is a area chart ppt powerpoint presentation ideas professional. This is a two stage process. The stages in this process are business, sales in percentage, area chart, marketing, finance.

Area Chart Ppt PowerPoint Presentation Model Inspiration
This is a area chart ppt powerpoint presentation model inspiration. This is a two stage process. The stages in this process are financial year, in percentage, area chart, business, marketing.

Combo Chart Ppt PowerPoint Presentation Model Vector
This is a combo chart ppt powerpoint presentation model vector. This is a two stage process. The stages in this process are financial year, in percentage, business, marketing, combo chart.

Combo Chart Ppt PowerPoint Presentation Pictures Objects
This is a combo chart ppt powerpoint presentation pictures objects. This is a three stage process. The stages in this process are product, combo chart, in years, market size.
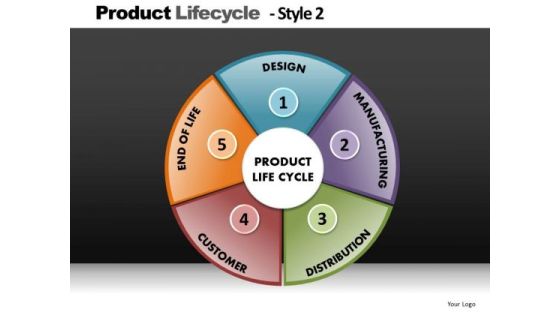
Product Lifecycle Pie Chart PowerPoint Slides Editable Ppt Slides
Product LifeCycle Pie Chart PowerPoint Slides Editable PPT Slides-These high quality powerpoint pre-designed slides and powerpoint templates have been carefully created by our professional team to help you impress your audience. All slides have been created and are 100% editable in powerpoint. Each and every property of any graphic - color, size, orientation, shading, outline etc. can be modified to help you build an effective powerpoint presentation. Any text can be entered at any point in the powerpoint template or slide. Simply DOWNLOAD, TYPE and PRESENT! These PowerPoint presentation slides can be used to represent themes relating to --Activities, business, clipart, commerce, concept, conceptual, customer, design, diagram, direction, distribution, guidelines, icon, illustration, integration, lifecycle, manage, management, manufacturing, marketing, mba, model, optimize, organization, performance, process, product, resentation, resource, sales, selling, steps, system, theoretical, theory, tool-Product LifeCycle Pie Chart PowerPoint Slides Editable PPT Slides
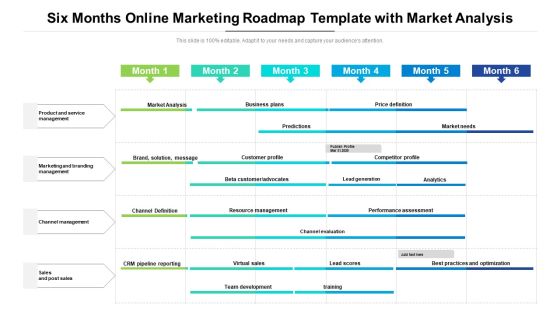
Six Months Online Marketing Roadmap Template With Market Analysis Professional
Introducing our six months online marketing roadmap template with market analysis professional. This PPT presentation is Google Slides compatible, therefore, you can share it easily with the collaborators for measuring the progress. Also, the presentation is available in both standard screen and widescreen aspect ratios. So edit the template design by modifying the font size, font type, color, and shapes as per your requirements. As this PPT design is fully editable it can be presented in PDF, JPG and PNG formats.
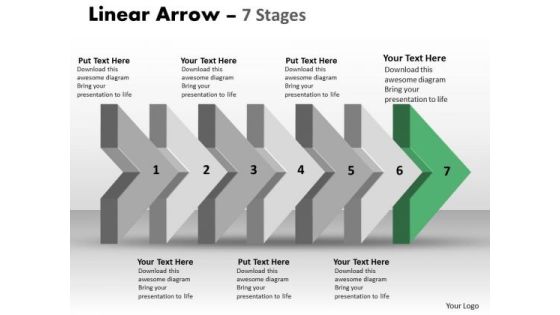
Ppt 3d Arrow Representing Logical Steps Working With Slide Numbers 8 Design
We present our PPT 3d arrow representing Logical Steps working with slide numbers 8 design. Use our Arrows PowerPoint Templates because, you are the star of your enlightened team. Use our Marketing PowerPoint Templates because, this template with an image of helps you chart the course of your presentation. Use our Process and Flows PowerPoint Templates because; discuss each path to the smallest detail. Use our Metaphor PowerPoint Templates because, are the symbols of human growth. Use our Business PowerPoint Templates because, anticipate the doubts and questions in the minds of your colleagues and enlighten them with your inspired strategy to garner desired success. Use these PowerPoint slides for presentations relating to Abstract, Age, Ancient, Antique, Arrows, Art, Artistic, Background, Colors, Decoration, Design, Dynamic, Elegant, Element, Future, Illustration, Index, Linear, Lines, Modern, Old, Paper, Pattern, Scratch, Text, Texture, Up, Vintage. The prominent colors used in the PowerPoint template are Green, Gray, and White


 Continue with Email
 Sign up for an account
 Home
Home