Project

Types Of Marketing Research Layout Powerpoint Slide Background Image
This is a types of marketing research layout powerpoint slide background image. This is a four stage process. The stages in this process are descriptive research, causal research, predictive research, exploratory research, marketing research.

Analytics Maturity Ppt Powerpoint Slide Background Designs
This is a analytics maturity ppt powerpoint slide background designs. This is a four stage process. The stages in this process are competitive advantage, analytics maturity, sense and respond, predict and analysis.

Improved Capacity Management Sample Diagram Ppt Slide
This is a improved capacity management sample diagram ppt slide. This is a eight stage process. The stages in this process are design, asset management, communication and corporation, it management, planning, maintenance, predictive analysis, real time monitoring, capacity management.
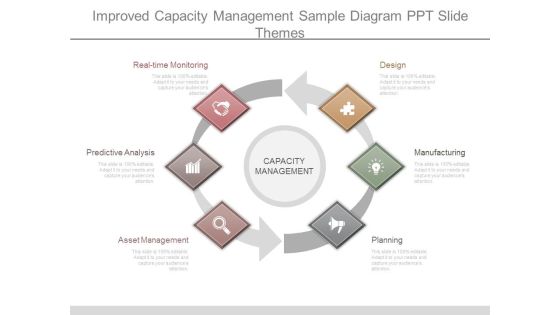
Improved Capacity Management Sample Diagram Ppt Slide Themes
This is a improved capacity management sample diagram ppt slide themes. This is a six stage process. The stages in this process are real time monitoring, predictive analysis, asset management, planning, manufacturing, design, capacity management.

Bi With Big Data Technology Ppt Presentation Graphics
This is a bi with big data technology ppt presentation graphics. This is a six stage process. The stages in this process are listen, learn, correct, look, correct, predict.
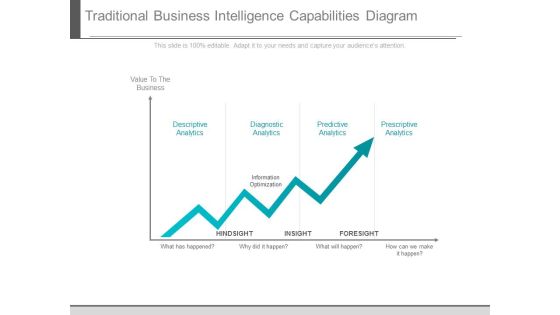
Traditional Business Intelligence Capabilities Diagram
This is a traditional business intelligence capabilities diagram. This is a one stage process. The stages in this process are descriptive analytics, diagnostic analytics, predictive analytics, prescriptive analytics, information optimization, value to the business, hindsight, insight, foresight.

Customer Interaction Management Sample Diagram Ppt Summary
This is a customer interaction management sample diagram ppt summary. This is a ten stage process. The stages in this process are aware, customer segmentation, customer profiles, identification, predict behavior, repeat, definition strategies, consider, integration, collect.

Closed Loop Marketing Solutions Diagram Good Ppt Example
This is a closed loop marketing solutions diagram good ppt example. This is a six stage process. The stages in this process are marketing automation, business intelligence, omnichannel, predictive analytics, feedback and results, marketing strategy.

Big Data And Web Intelligence Process Ppt Example Of Ppt
This is a big data and web intelligence process ppt example of ppt. This is a six stage process. The stages in this process are how, predict, correct, look, listen, learn, connect.

Analytical Interpretations Template Ppt Samples Slides
This is a analytical interpretations template ppt samples slides. This is a seven stage process. The stages in this process are profile, development, retention, acquisition, predict, associate, other solution.

Practical Application Ppt Layout Presentation Outline
This is a practical application ppt layout presentation outline. This is a five stage process. The stages in this process are descriptive analytics, diagnostic analytics, predictive analytics, prescriptive analytics, machine learning.

Activity And Market Management Layout Powerpoint Slide Influencers
This is a activity and market management layout powerpoint slide influencers. This is a four stage process. The stages in this process are product development, market development, predictive, operational.
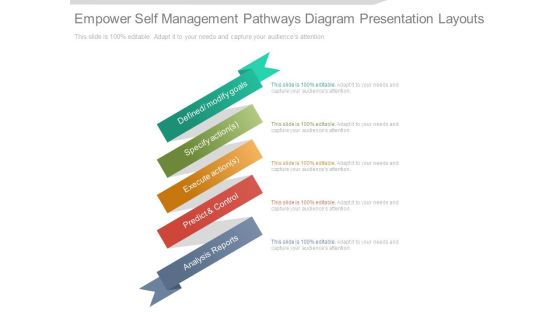
Empower Self Management Pathways Diagram Presentation Layouts
This is a Empower Self Management Pathways Diagram Presentation Layouts. This is a five stage process. The stages in this process are defined modify goals, specify action, execute action, predict and control, analysis reports.

Proactive Monitoring Example Of Ppt Presentation
This is a proactive monitoring example of ppt presentation. This is a six stage process. The stages in this process are partner and predict, analyze and identify, detailed analysis, proactive maintenance, active monitoring, monitor and measure.
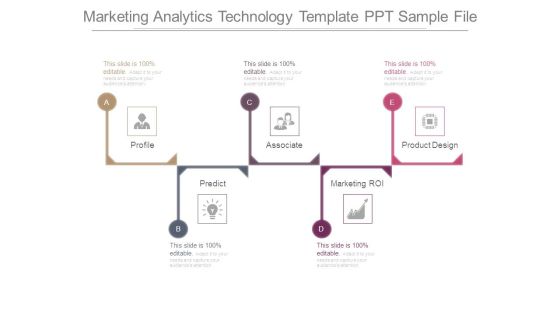
Marketing Analytics Technology Template Ppt Sample File
This is a marketing analytics technology template ppt sample file. This is a five stage process. The stages in this process are profile, associate, product design, marketing roi, predict.

Building Growth Capacity Example Ppt Examples Slides
This is a building growth capacity example ppt examples slides. This is a four stage process. The stages in this process are improve predictability, process management, people management, simplified operations.

Data Driven Insights Diagram Ppt Slide Examples
This is a data driven insights diagram ppt slide examples. This is a seven stage process. The stages in this process are descriptive analytics, diagnostic analytics, predictive analytics, prescriptive analytics, machine learning, data management, execution media.
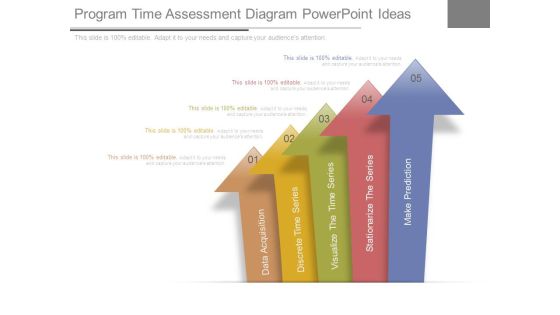
Program Time Assessment Diagram Powerpoint Ideas
This is a program time assessment diagram powerpoint ideas. This is a five stage process. The stages in this process are data acquisition, discrete time series, visualize the time series, stationarize the series, make prediction.

Banks Technology Ppt Template Ppt Examples
This is a banks technology ppt template ppt examples. This is a six stage process. The stages in this process are consumer goods, transportation, communication, liquid workforce, intelligent automation, predictable disruption.

Case Study For Supply Chain Analysis Presentation Portfolio
This is a case study for supply chain analysis presentation portfolio. This is a five stage process. The stages in this process are visibility, predictability, sustainability, supply chain maturity, competitive advantage.

Sample For Strategic Plan Review Ppt Slides
This is a sample for strategic plan review ppt slides. This is a five stage process. The stages in this process are predictions, experiments, data collection, pattern recognition, effective execution.

Big Data Life Cycle Impacts Circular Diagram Ppt PowerPoint Presentation Introduction
This is a big data life cycle impacts circular diagram ppt powerpoint presentation introduction. This is a six stage process. The stages in this process are sports predictions, easier commutes, smartphones, personalized advertising, presidential campaigns, advanced healthcare.
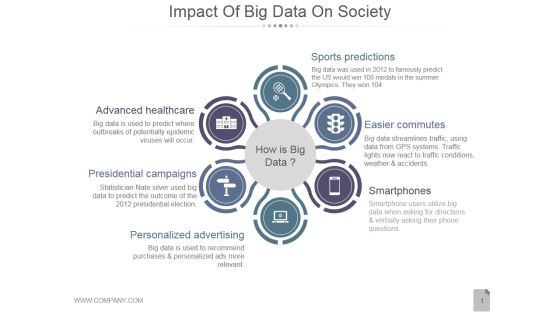
Impact Of Big Data On Society Ppt PowerPoint Presentation Diagrams
This is a impact of big data on society ppt powerpoint presentation diagrams. This is a six stage process. The stages in this process are sports predictions, easier commutes, smartphones, personalized advertising, presidential campaigns.

Impact Of Big Data On Business Intelligence Ppt PowerPoint Presentation Sample
This is a impact of big data on business intelligence ppt powerpoint presentation sample. This is a six stage process. The stages in this process are sports predictions, easier commutes, smartphones, personalized advertising, presidential campaigns, advanced healthcare.

Business Impact And Large Data Ppt PowerPoint Presentation Example 2015
This is a business impact and large data ppt powerpoint presentation example 2015. This is a six stage process. The stages in this process are sports predictions, easier commutes, smartphones, personalized advertising, presidential campaigns, how is big data.
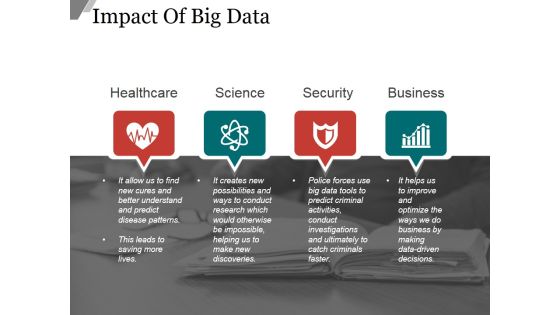
Impact Of Big Data Template Ppt PowerPoint Presentation Tips
This is a impact of big data template ppt powerpoint presentation tips. This is a six stage process. The stages in this process are sports predictions, easier commutes, smartphones, personalized advertising, presidential campaigns, advanced healthcare.
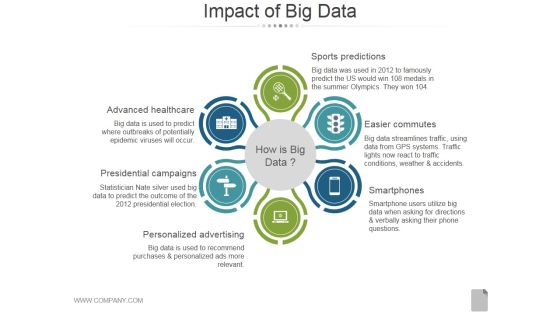
Impact Of Big Data Template 2 Ppt PowerPoint Presentation Styles
This is a impact of big data template 2 ppt powerpoint presentation styles. This is a six stage process. The stages in this process are sports predictions, easier commutes, smartphones, personalized advertising, presidential campaigns, advanced healthcare.
Impact Of Big Data Template 1 Ppt PowerPoint Presentation Outline Templates
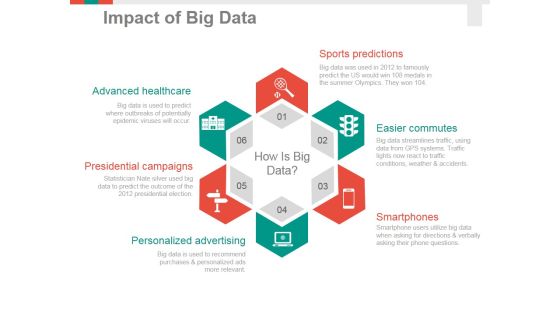
This is a impact of big data template 1 ppt powerpoint presentation outline templates. This is a six stage process. The stages in this process are sports predictions, easier commutes, smartphones, personalized advertising, presidential campaigns, advanced healthcare.

Capability Maturity Model Ppt PowerPoint Presentation Portfolio Tips
This is a capability maturity model ppt powerpoint presentation portfolio tips. This is a three stage process. The stages in this process are optimizing, predictable, maturity level, focus, process areas.

Capability Maturity Model Ppt PowerPoint Presentation Styles Files
This is a capability maturity model ppt powerpoint presentation styles files. This is a three stage process. The stages in this process are optimizing, predictable, managed, focus, process areas.

Ppt Four Segments Around Globe In Circle PowerPoint Presentation Templates
PPT four segments around globe in circle powerpoint presentation Templates-Use this graphical approach to represent global business issues such as financial data, stock market Exchange, increase in sales, corporate presentations and more. It Signifies common, comprehensive, extensive, global, international, multinational, omnipresent, planetary, ubiquitous, universal etc.-Can be used for presentations on abstract, achievement, aim, arrow, background, business, chart, communication, company, competition, concept, design, development, diagram, direction, finance, financial, forecast, forward, goal, graph, graphic, growth, icon, illustration, increase, investment, leader, leadership, marketing, motion, moving, path, price, process, profit, progress, progress bar, shape, sign, success, symbol, target, team, teamwork, turquoise blue, up, upward-PPT four segments around globe in circle powerpoint presentation Templates
Ppt Four Segments Around Globe PowerPoint Presentation Circle Blue Templates
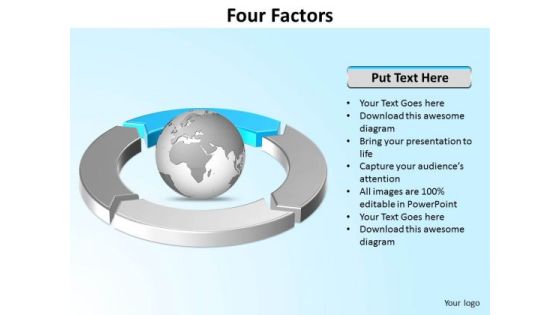
PPT four segments around globe powerpoint presentation circle blue Templates-This PowerPoint Diagram can be used to represent worldwide business issues such as financial data, stock market Exchange, increase in sales, corporate presentations and more. It illustrates the blue component of this worldwide PowerPoint Diagram.-Can be used for presentations on abstract, achievement, aim, arrow, background, business, chart, communication, company, competition, concept, design, development, diagram, direction, finance, financial, forecast, forward, goal, graph, graphic, growth, icon, illustration, increase, investment, leader, leadership, marketing, motion, moving, path, price, process, profit, progress, progress bar, shape, sign, success, symbol, target, team, teamwork, turquoise blue, up, upward-PPT four segments around globe powerpoint presentation circle blue Templates
Ppt Four Segments Around Microsoft PowerPoint Backgrounds Circle Purple Templates
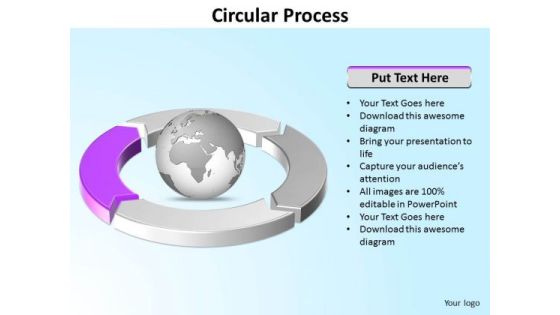
PPT four segments around microsoft powerpoint backgrounds circle purple Templates-This PowerPoint Diagram can be used to represent worldwide business issues such as financial data, stock market Exchange, increase in sales, corporate presentations and more. It illustrates the purple component. This Diagram will fit for Business Presentations.-Can be used for presentations on abstract, achievement, aim, arrow, background, business, chart, communication, company, competition, concept, design, development, diagram, direction, finance, financial, forecast, forward, goal, graph, graphic, growth, icon, illustration, increase, investment, leader, leadership, marketing, motion, moving, path, price, process, profit, progress, progress bar, shape, sign, success, symbol, target, team, teamwork, turquoise blue, up, upward-PPT four segments around microsoft powerpoint backgrounds circle purple Templates

Ppt Four Segments Around Spinning Globe PowerPoint Template Circle Green Templates
PPT four segments around spinning globe powerpoint template circle green Templates-This PowerPoint Diagram can be used to represent worldwide issues such as Global warming, Acid Rain, Poverty, Racism,Obesity, overpopulation. It is illustrated by Green component. This Diagram will fit for Business Presentations.-Can be used for presentations on abstract, achievement, aim, arrow, background, business, chart, communication, company, competition, concept, design, development, diagram, direction, finance, financial, forecast, forward, goal, graph, graphic, growth, icon, illustration, increase, investment, leader, leadership, marketing, motion, moving, path, price, process, profit, progress, progress bar, shape, sign, success, symbol, target, team, teamwork, turquoise blue, up, upward-PPT four segments around spinning globe powerpoint template circle green Templates

Ppt Four Segments Around Spinning Globe PowerPoint Template Circle Red Templates
PPT four segments around spinning globe powerpoint template circle red Templates-This PowerPoint Diagram can be used to represent worldwide issues such as Global warming, Acid Rain, Poverty, Racism,Obesity, overpopulation etc. It is illustrated by Red component. This Diagram will fit for Business Presentations.-Can be used for presentations on abstract, achievement, aim, arrow, background, business, chart, communication, company, competition, concept, design, development, diagram, direction, finance, financial, forecast, forward, goal, graph, graphic, growth, icon, illustration, increase, investment, leader, leadership, marketing, motion, moving, path, price, process, profit, progress, progress bar, shape, sign, success, symbol, target, team, teamwork, turquoise blue, up, upward-PPT four segments around spinning globe powerpoint template circle red Templates

Ppt Highlighted First Green Step Of Nursing Process PowerPoint Presentation Templates
PPT highlighted first green step of nursing process powerpoint presentation Templates-This PowerPoint Diagram consists of four interconnected colorful puzzles. It explains the part of process covered by green puzzle. It portrays the concept of befuddle, bemuse, bewilder, buffalo, complicate etc.-Can be used for presentations on 3d, abstract, aspiration, attached, business, career, change, choice, concept, connection, diagram, forecasting, four, group, growth, improvement, isolated, jigsaw, ladder, link, metal, pedestal, planning, positivity, progress, prosperity, puzzle, rise, solution, stair, staircase, steps, success, team, top, upsurge, way, white, winning-PPT highlighted first green step of nursing process powerpoint presentation Templates

Ppt Highlighted Fourth Purple Step Of Process PowerPoint Templates
PPT highlighted fourth purple step of process PowerPoint Templates-This PowerPoint Diagram consists of four interconnected colorful puzzles. It explains the part of process covered by Purple puzzle. It portrays the concept of confound, discombobulate, disconcert, distract, disturb, flabbergast, floor, frustrate, get to, mystify, nonplus, obscure etc.-Can be used for presentations on 3d, abstract, aspiration, attached, business, career, change, choice, concept, connection, diagram, forecasting, four, group, growth, improvement, isolated, jigsaw, ladder, link, metal, pedestal, planning, positivity, progress, prosperity, puzzle, rise, solution, stair, staircase, steps, success, team, top, upsurge, way, white, winning-PPT highlighted fourth purple step of process PowerPoint Templates
Ppt Highlighted Second Blue Step Of Writing Process PowerPoint Presentation Templates
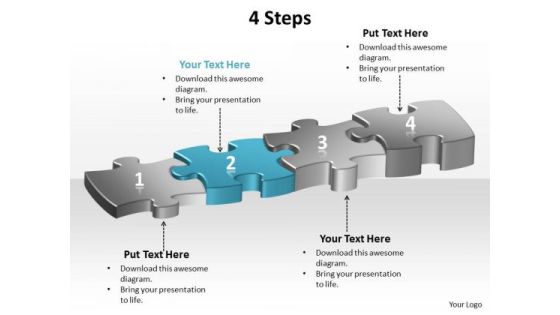
PPT highlighted second blue step of writing process powerpoint presentation Templates-Use This PowerPoint Diagram describing blue step out of four interconnected colorful puzzles. It portrays the concept of flabbergast, floor, bemuse, bewilder, obscure etc. It elaborates the concept of blue step which is at second position.-Can be used for presentations on 3d, abstract, aspiration, attached, business, career, change, choice, concept, connection, diagram, forecasting, four, group, growth, improvement, isolated, jigsaw, ladder, link, metal, pedestal, planning, positivity, progress, prosperity, puzzle, rise, solution, stair, staircase, steps, success, team, top, upsurge, way, white, winning-PPT highlighted second blue step of writing process powerpoint presentation Templates
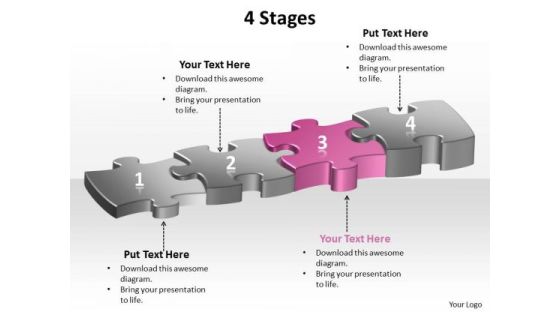
Ppt Highlighted Third Pink PowerPoint Presentation Step Of Process Templates
PPT highlighted third pink powerpoint presentation step of process Templates- Use This PowerPoint Diagram describing the third step in pink color out of four interconnected colorful puzzles. It imitates appreciation, apprehension, clue, cogitating, cognition, communing, comprehension, conceit, concentrating etc.-Can be used for presentations on 3d, abstract, aspiration, attached, business, career, change, choice, concept, connection, diagram, forecasting, four, group, growth, improvement, isolated, jigsaw, ladder, link, metal, pedestal, planning, positivity, progress, prosperity, puzzle, rise, solution, stair, staircase, steps, success, team, top, upsurge, way, white, winning-PPT highlighted third pink powerpoint presentation step of process Templates
Ppt Horizontal Demonstration Of Finance Process Using 6 Stages PowerPoint Templates
PPT horizontal demonstration of finance process using 6 stages PowerPoint Templates-Use This Horizontally Demonstrated PowerPoint Diagram having six circular boxes on the arrow pointing towards east direction signifying his completion of the process and leading towards success.-PPT horizontal demonstration of finance process using 6 stages PowerPoint Templates-Abstract, Achievement, Aim, Arrow, Background, Business, Chart, Communication, Company, Competition, Concept, Design, Development, Diagram, Direction, Finance, Financial, Forecast, Forward, Goal, Graph, Graphic, Growth, Icon, Illustration, Increase, Investment, Leader, Leadership, Marketing, Motion, Moving, Orange, Path, Price, Process, Profit, Progress, Shape, Sign, Success, Symbol, Target, Team, Teamwork, Up, Upwards
Ppt Consistent Demonstration Of Financial Process Using Stage 5 PowerPoint Templates
PPT consistent demonstration of financial process using stage 5 PowerPoint Templates-Highlight the key components of your entire financial process. Illustrate how each element flows seamlessly onto the next stage.-PPT consistent demonstration of financial process using stage 5 PowerPoint Templates-Abstract, Achievement, Aim, Arrow, Background, Business, Chart, Communication, Company, Competition, Concept, Design, Development, Diagram, Direction, Finance, Financial, Forecast, Forward, Goal, Graph, Graphic, Growth, Icon, Illustration, Increase, Investment, Leader, Leadership, Marketing, Motion, Moving, Orange, Path, Price, Process, Profit, Progress, Shape, Sign, Success, Symbol, Target, Team, Teamwork, Up, Upwards

Ppt Homogeneous Demonstration Of Financial Process Using Stage 3 PowerPoint Templates
PPT homogeneous demonstration of financial process using stage 3 PowerPoint Templates-With this pre-designed process arrows diagram you can visualize almost any type of concept, chronological process or steps of your strategies.-PPT homogeneous demonstration of financial process using stage 3 PowerPoint Templates-Abstract, Achievement, Aim, Arrow, Background, Business, Chart, Communication, Company, Competition, Concept, Design, Development, Diagram, Direction, Finance, Financial, Forecast, Forward, Goal, Graph, Graphic, Growth, Icon, Illustration, Increase, Investment, Leader, Leadership, Marketing, Motion, Moving, Orange, Path, Price, Process, Profit, Progress, Shape, Sign, Success, Symbol, Target, Team, Teamwork, Up, Upwards

Ppt Horizontal Abstraction Of Financial Process Using Stage 4 PowerPoint Templates
PPT horizontal abstraction of financial process using stage 4 PowerPoint Templates-This diagram can be used in analyzing, designing, documenting or managing a process or program in various fields.-PPT horizontal abstraction of financial process using stage 4 PowerPoint Templates-Abstract, Achievement, Aim, Arrow, Background, Business, Chart, Communication, Company, Competition, Concept, Design, Development, Diagram, Direction, Finance, Financial, Forecast, Forward, Goal, Graph, Graphic, Growth, Icon, Illustration, Increase, Investment, Leader, Leadership, Marketing, Motion, Moving, Orange, Path, Price, Process, Profit, Progress, Shape, Sign, Success, Symbol, Target, Team, Teamwork, Up, Upwards
Ppt Horizontal Illustration Of Financial Process Using 6 State Diagram PowerPoint Templates
PPT horizontal illustration of financial process using 6 state diagram PowerPoint Templates-This diagram can be used in analyzing, designing, documenting or managing a process or program in various fields.-PPT horizontal illustration of financial process using 6 state diagram PowerPoint Templates-Abstract, Achievement, Aim, Arrow, Background, Business, Chart, Communication, Company, Competition, Concept, Design, Development, Diagram, Direction, Finance, Financial, Forecast, Forward, Goal, Graph, Graphic, Growth, Icon, Illustration, Increase, Investment, Leader, Leadership, Marketing, Motion, Moving, Orange, Path, Price, Process, Profit, Progress, Shape, Sign, Success, Symbol, Target, Team, Teamwork, Up, Upwards
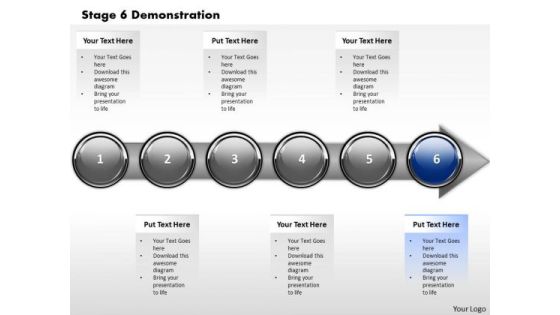
Ppt Linear Abstraction Of Financial Layouts Process Using Stage 6 PowerPoint Templates
PPT linear abstraction of financial layouts process using stage 6 PowerPoint Templates-The theme of this PowerPoint template is linear arrow. Use this slide to detail and highlight your thought process, your views and your positive expectations.-PPT linear abstraction of financial layouts process using stage 6 PowerPoint Templates-Abstract, Achievement, Aim, Arrow, Background, Business, Chart, Communication, Company, Competition, Concept, Design, Development, Diagram, Direction, Finance, Financial, Forecast, Forward, Goal, Graph, Graphic, Growth, Icon, Illustration, Increase, Investment, Leader, Leadership, Marketing, Motion, Moving, Orange, Path, Price, Process, Profit, Progress, Shape, Sign, Success, Symbol, Target, Team, Teamwork, Up, Upwards

Ppt Sequential Demonstration Of Arrow Process Step 1 PowerPoint Templates
PPT sequential demonstration of arrow process step 1 PowerPoint Templates-With this pre-designed process arrows diagram you can visualize almost any type of concept, chronological process or steps of your strategies-PPT sequential demonstration of arrow process step 1 PowerPoint Templates-Abstract, Achievement, Aim, Arrow, Background, Business, Chart, Communication, Company, Competition, Concept, Design, Development, Diagram, Direction, Finance, Financial, Forecast, Forward, Goal, Graph, Graphic, Growth, Icon, Illustration, Increase, Investment, Leader, Leadership, Marketing, Motion, Moving, Orange, Path, Price, Process, Profit, Progress, Shape, Sign, Success, Symbol, Target, Team, Teamwork, Up, Upwards
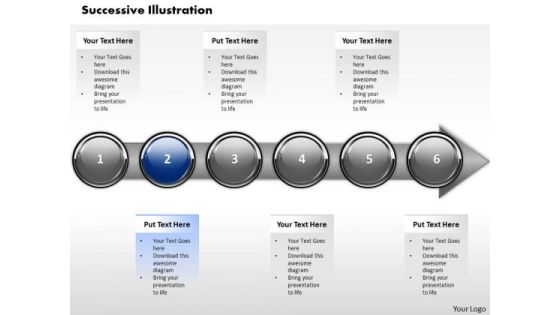
Ppt Sequential Illustration Of Financial PowerPoint Presentation Process Step 2 Templates
PPT sequential illustration of financial powerpoint presentation process step 2 Templates-This diagram helps to determine your targets and you can sequence them as per your priorities. Educate your listeners on the relevance and importance of each one as per your plan.-PPT sequential illustration of financial powerpoint presentation process step 2 Templates-Abstract, Achievement, Aim, Arrow, Background, Business, Chart, Communication, Company, Competition, Concept, Design, Development, Diagram, Direction, Finance, Financial, Forecast, Forward, Goal, Graph, Graphic, Growth, Icon, Illustration, Increase, Investment, Leader, Leadership, Marketing, Motion, Moving, Orange, Path, Price, Process, Profit, Progress, Shape, Sign, Success, Symbol, Target, Team, Teamwork, Up, Upwards
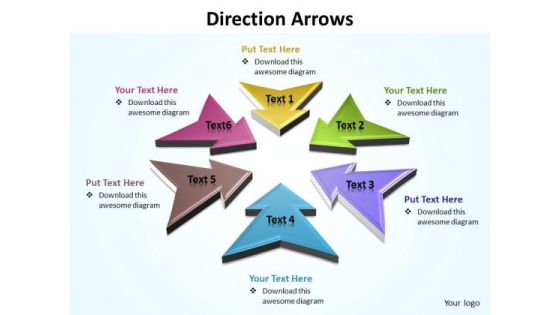
Ppt Direction Arrows Diagram PowerPoint Free Editable Templates
PPT direction arrows diagram powerpoint free editable templates-Create stunning Microsoft office PPT Presentations with our professional templates containing a graphic of multicolored arrows. This image has been professionally designed to emphasize the concept of interrelated business issues. This awesome image makes your presentations simpler and professional. This PPT image is an effective tool to make your clients understand the concept.-PPT direction arrows diagram powerpoint free editable templates-Abstract, Achievement, Aim, Arrow, Background, Business, Chart, Communication, Competition, Concept, Design, Direction, Development, Diagram, Direction, Finance, Financial, Forecast, Forward, Goal, Graph, Graphic, Growth, Icon, Illustration, Increase, Investment, Leader, Leadership, Design, Marketing, Price, Process, Profit, Progress, Progress, Shape, Sign, Success, Symbol, Target, Team, Teamwork

Ppt Direction Arrows Of Layout Editable PowerPoint World Map Templates
PPT direction arrows of layout editable powerpoint world map Templates-The above template contains a graphic of arrows pointing towards the center. Clarity of thought has been the key to your growth. Use our templates to illustrate your ability.-PPT direction arrows of layout editable powerpoint world map Templates-Abstract, Achievement, Aim, Arrow, Background, Business, Chart, Communication, Competition, Concept, Design, Direction, Development, Diagram, Direction, Finance, Financial, Forecast, Forward, Goal, Graph, Graphic, Growth, Icon, Illustration, Increase, Investment, Leader, Leadership, Design, Marketing, Price, Process, Profit, Progress, Progress, Shape, Sign, Success, Symbol, Target, Team, Teamwork

Creating And Developing High Performing Teams Ppt PowerPoint Presentation Slides Gridlines PDF
Presenting this set of slides with name creating and developing high performing teams ppt powerpoint presentation slides gridlines pdf. This is a eight stage process. The stages in this process are generation new ideas, new fashion and taste and preference of the customer, planning future forecasting, distribution resources, distribution of work between team, make strategy and implement, investment idea and requirement funds, launch product . This is a completely editable PowerPoint presentation and is available for immediate download. Download now and impress your audience.
Information Flow Mapping With Production Control Ppt PowerPoint Presentation Slides Icon
Persuade your audience using this information flow mapping with production control ppt powerpoint presentation slides icon. This PPT design covers one stages, thus making it a great tool to use. It also caters to a variety of topics including annual production plan, production control, production supervisor, weekly schedule, weekly forecast, supplier daily schedule, weekly orders, weekly schedule, inventory, weekly, daily orders, information flow, customer. Download this PPT design now to present a convincing pitch that not only emphasizes the topic but also showcases your presentation skills.
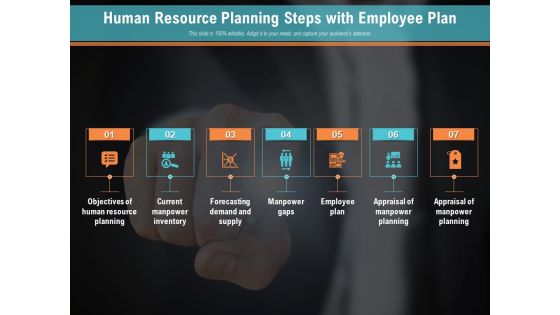
Human Resource Planning Steps With Employee Plan Ppt PowerPoint Presentation Slides Graphics Pictures PDF
Persuade your audience using this human resource planning steps with employee plan ppt powerpoint presentation slides graphics pictures pdf. This PPT design covers seven stages, thus making it a great tool to use. It also caters to a variety of topics including objectives of human, current manpower inventory, forecasting demand and supply, manpower, appraisal of manpower planning, training and development, employee plan. Download this PPT design now to present a convincing pitch that not only emphasizes the topic but also showcases your presentation skills.

Dashboard For Tracking And Measuring Business Sales And Revenue Ppt PowerPoint Presentation Slides Introduction PDF
Showcasing this set of slides titled dashboard for tracking and measuring business sales and revenue ppt powerpoint presentation slides introduction pdf. The topics addressed in these templates are revenue by pipeline jun 2020, new deals by month this year 2020, forecast june 2020, revenue goal attainment by owner jun 2020, revenue goal attainment jun 2020, pipeline coverage jul 2020. All the content presented in this PPT design is completely editable. Download it and make adjustments in color, background, font etc. as per your unique business setting.

Convenience Food Business Plan Global Burger Market Presence Ppt Infographic Template Slide Download PDF
The purpose of this slide is to provide glimpse about the global burger market by geographical region wise. Presenting convenience food business plan global burger market presence ppt infographic template slide download pdf to provide visual cues and insights. Share and navigate important information on three stages that need your due attention. This template can be used to pitch topics like global burger market, opportunities and forecasts, global fast food market. In addition, this PPT design contains high-resolution images, graphics, etc, that are easily editable and available for immediate download.

COVID 19 Risk Analysis Mitigation Policies Ocean Liner Sector Cruise Tourism Market Overview Formats PDF
This slide provides an overview of cruise tourism market. It shows market size from 2017 to 2019 along with the forecasted values for 2026 and the key growth drivers for the industry. Deliver an awe inspiring pitch with this creative covid 19 risk analysis mitigation policies ocean liner sector cruise tourism market overview formats pdf bundle. Topics like Cruise Tourism Market Overview can be discussed with this completely editable template. It is available for immediate download depending on the needs and requirements of the user.
Stages Of Demand Planning With Icons Ppt PowerPoint Presentation Pictures Professional PDF
Persuade your audience using this stages of demand planning with icons ppt powerpoint presentation pictures professional pdf. This PPT design covers four stages, thus making it a great tool to use. It also caters to a variety of topics including measuring data currency and accuracy, managing spikes to analyse data errors, preparing data for analysis, understanding impact of order fulfilment on forecasting. Download this PPT design now to present a convincing pitch that not only emphasizes the topic but also showcases your presentation skills.

Online Settlement Revolution Global Digital Payment Market Overview Ideas PDF
We are covering global digital payment market growth during the forecast period of 2019-2024 with the leading player and country in market. This is a online settlement revolution global digital payment market overview ideas pdf template with various stages. Focus and dispense information on two stages using this creative set, that comes with editable features. It contains large content boxes to add your information on topics like growth segment, digital payment market. You can also showcase facts, figures, and other relevant content using this PPT layout. Grab it now.

ALM Optimizing The Profit Generated By Your Assets End Goal To Be Achieved Through Asset Lifecycle Management Graphics PDF
The following slide highlights Multiple Changes that the organization wants to achieve in the forecasted year through effective asset lifecycle management. Presenting alm optimizing the profit generated by your assets end goal to be achieved through asset lifecycle management graphics pdf to provide visual cues and insights. Share and navigate important information on five stages that need your due attention. This template can be used to pitch topics like low maintenance cost of asset, quick response time, lowering procurement cost, reduction in lead time, proper disposal plan. In addtion, this PPT design contains high resolution images, graphics, etc, that are easily editable and available for immediate download.

Market Potential And Opportunity Size For The Company Virtual Currency Financing Pitch Deck Background PDF
The slide provides the comparison graph of market size of online money transfer remittances mobile payment market. It covers the historical 2015 2020 as well as forecasted 2021 2026 data. Deliver an awe inspiring pitch with this creative market potential and opportunity size for the company virtual currency financing pitch deck background pdf bundle. Topics like market potential and opportunity size for the company can be discussed with this completely editable template. It is available for immediate download depending on the needs and requirements of the user.
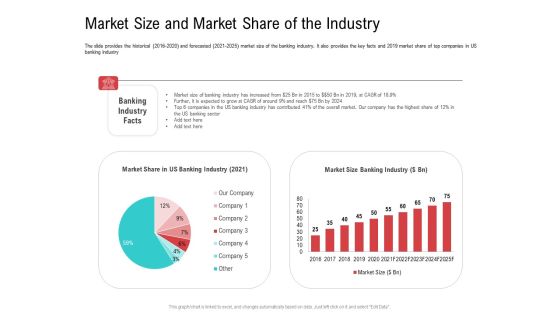
Investor Pitch Deck Collect Funding Spot Market Market Size And Market Share Of The Industry Elements PDF
The slide provides the historical 2016 to 2020 and forecasted 2021 to 2025 market size of the banking industry. It also provides the key facts and 2019 market share of top companies in US banking industry. Deliver and pitch your topic in the best possible manner with this investor pitch deck collect funding spot market market size and market share of the industry elements pdf. Use them to share invaluable insights on market share in us banking industry, market size banking industry, banking industry facts and impress your audience. This template can be altered and modified as per your expectations. So, grab it now.
 Home
Home