Project Stages

Improvement Tips For Email Marketing Sample Diagram Ppt Slide
This is a improvement tips for email marketing sample diagram ppt slide. This is a five stage process. The stages in this process are activity based, operational, outcome based, leading indicators, predictive.
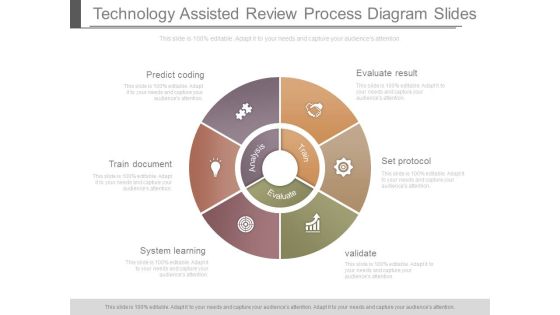
Technology Assisted Review Process Diagram Slides
This is a technology assisted review process diagram slides. This is a six stage process. The stages in this process are predict coding, train document, system learning validate, set protocol, evaluate result, analysis, evaluate, train.

Cost Analysis Powerpoint Slide Background Picture
This is a cost analysis powerpoint slide background picture. This is a four stage process. The stages in this process are cost analysis, cost prediction, workflow processes, monitoring and escalation.

Business Analysis Life Cycle Ppt Powerpoint Ideas
This is a business analysis life cycle ppt powerpoint ideas. This is a eight stage process. The stages in this process are bi assessment, design data model, data warehouse, data mining, enterprise reporting, performance management, predict analysis, maintenance and support.

Big Data Business Analytics With Bi Concept Ppt Slides
This is a big data business analytics with bi concept ppt slides. This is a three stage process. The stages in this process are data integration, visual analytics, predictive analytics, open web based apis, pluggable architecture, java.

B2b Email Marketing Tips Diagram Ppt Sample
This is a b2b email marketing tips diagram ppt sample. This is a five stage process. The stages in this process are predictive, leading indicators, outcome based, operational, activity based.
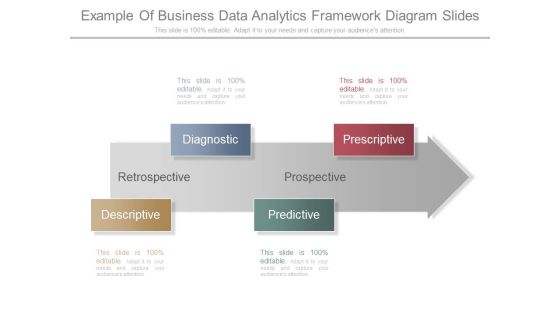
Example Of Business Data Analytics Framework Diagram Slides
This is a example of business data analytics framework diagram slides. This is a four stage process. The stages in this process are diagnostic, descriptive, predictive, prescriptive, retrospective, prospective.
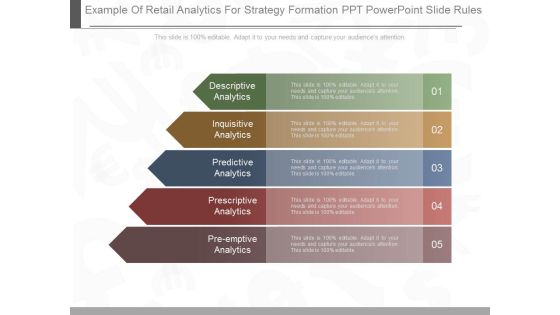
Example Of Retail Analytics For Strategy Formation Ppt Powerpoint Slide Rules
This is a example of retail analytics for strategy formation ppt powerpoint slide rules. This is a five stage process. The stages in this process are descriptive analytics, inquisitive analytics, predictive analytics, prescriptive analytics, pre emptive analytics.

Customer Centric Pricing Template Powerpoint Slide Background
This is a customer centric pricing template powerpoint slide background. This is a three stage process. The stages in this process are technical price, client info, predictive analytics, simulation, history, adjust, market, company strategy, commercial price.

Types Of Marketing Research Layout Powerpoint Slide Background Image
This is a types of marketing research layout powerpoint slide background image. This is a four stage process. The stages in this process are descriptive research, causal research, predictive research, exploratory research, marketing research.

Analytics Maturity Ppt Powerpoint Slide Background Designs
This is a analytics maturity ppt powerpoint slide background designs. This is a four stage process. The stages in this process are competitive advantage, analytics maturity, sense and respond, predict and analysis.

Improved Capacity Management Sample Diagram Ppt Slide
This is a improved capacity management sample diagram ppt slide. This is a eight stage process. The stages in this process are design, asset management, communication and corporation, it management, planning, maintenance, predictive analysis, real time monitoring, capacity management.
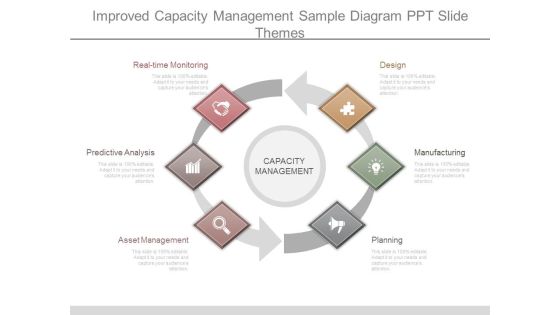
Improved Capacity Management Sample Diagram Ppt Slide Themes
This is a improved capacity management sample diagram ppt slide themes. This is a six stage process. The stages in this process are real time monitoring, predictive analysis, asset management, planning, manufacturing, design, capacity management.

Bi With Big Data Technology Ppt Presentation Graphics
This is a bi with big data technology ppt presentation graphics. This is a six stage process. The stages in this process are listen, learn, correct, look, correct, predict.
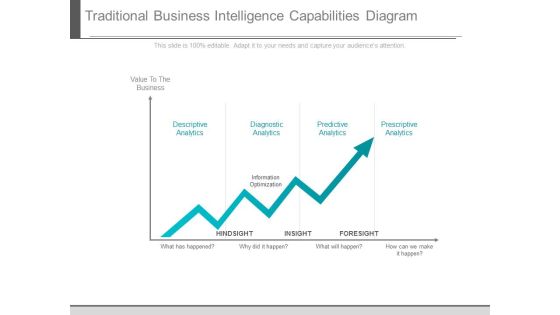
Traditional Business Intelligence Capabilities Diagram
This is a traditional business intelligence capabilities diagram. This is a one stage process. The stages in this process are descriptive analytics, diagnostic analytics, predictive analytics, prescriptive analytics, information optimization, value to the business, hindsight, insight, foresight.

Customer Interaction Management Sample Diagram Ppt Summary
This is a customer interaction management sample diagram ppt summary. This is a ten stage process. The stages in this process are aware, customer segmentation, customer profiles, identification, predict behavior, repeat, definition strategies, consider, integration, collect.

Closed Loop Marketing Solutions Diagram Good Ppt Example
This is a closed loop marketing solutions diagram good ppt example. This is a six stage process. The stages in this process are marketing automation, business intelligence, omnichannel, predictive analytics, feedback and results, marketing strategy.

Big Data And Web Intelligence Process Ppt Example Of Ppt
This is a big data and web intelligence process ppt example of ppt. This is a six stage process. The stages in this process are how, predict, correct, look, listen, learn, connect.

Analytical Interpretations Template Ppt Samples Slides
This is a analytical interpretations template ppt samples slides. This is a seven stage process. The stages in this process are profile, development, retention, acquisition, predict, associate, other solution.

Practical Application Ppt Layout Presentation Outline
This is a practical application ppt layout presentation outline. This is a five stage process. The stages in this process are descriptive analytics, diagnostic analytics, predictive analytics, prescriptive analytics, machine learning.

Activity And Market Management Layout Powerpoint Slide Influencers
This is a activity and market management layout powerpoint slide influencers. This is a four stage process. The stages in this process are product development, market development, predictive, operational.
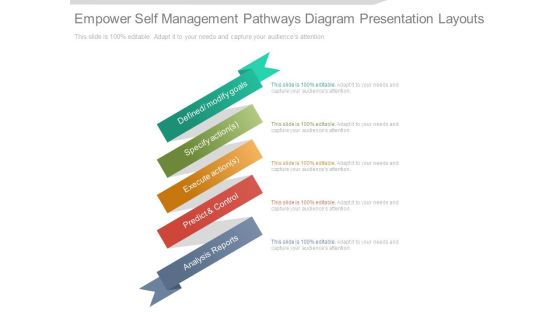
Empower Self Management Pathways Diagram Presentation Layouts
This is a Empower Self Management Pathways Diagram Presentation Layouts. This is a five stage process. The stages in this process are defined modify goals, specify action, execute action, predict and control, analysis reports.

Proactive Monitoring Example Of Ppt Presentation
This is a proactive monitoring example of ppt presentation. This is a six stage process. The stages in this process are partner and predict, analyze and identify, detailed analysis, proactive maintenance, active monitoring, monitor and measure.
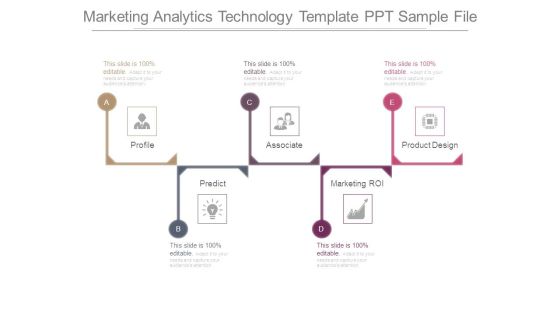
Marketing Analytics Technology Template Ppt Sample File
This is a marketing analytics technology template ppt sample file. This is a five stage process. The stages in this process are profile, associate, product design, marketing roi, predict.

Building Growth Capacity Example Ppt Examples Slides
This is a building growth capacity example ppt examples slides. This is a four stage process. The stages in this process are improve predictability, process management, people management, simplified operations.

Data Driven Insights Diagram Ppt Slide Examples
This is a data driven insights diagram ppt slide examples. This is a seven stage process. The stages in this process are descriptive analytics, diagnostic analytics, predictive analytics, prescriptive analytics, machine learning, data management, execution media.
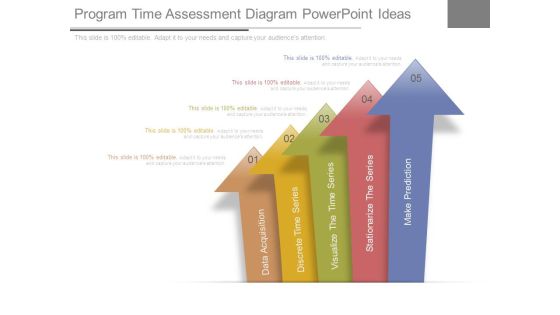
Program Time Assessment Diagram Powerpoint Ideas
This is a program time assessment diagram powerpoint ideas. This is a five stage process. The stages in this process are data acquisition, discrete time series, visualize the time series, stationarize the series, make prediction.

Banks Technology Ppt Template Ppt Examples
This is a banks technology ppt template ppt examples. This is a six stage process. The stages in this process are consumer goods, transportation, communication, liquid workforce, intelligent automation, predictable disruption.

Case Study For Supply Chain Analysis Presentation Portfolio
This is a case study for supply chain analysis presentation portfolio. This is a five stage process. The stages in this process are visibility, predictability, sustainability, supply chain maturity, competitive advantage.

Sample For Strategic Plan Review Ppt Slides
This is a sample for strategic plan review ppt slides. This is a five stage process. The stages in this process are predictions, experiments, data collection, pattern recognition, effective execution.

Big Data Life Cycle Impacts Circular Diagram Ppt PowerPoint Presentation Introduction
This is a big data life cycle impacts circular diagram ppt powerpoint presentation introduction. This is a six stage process. The stages in this process are sports predictions, easier commutes, smartphones, personalized advertising, presidential campaigns, advanced healthcare.
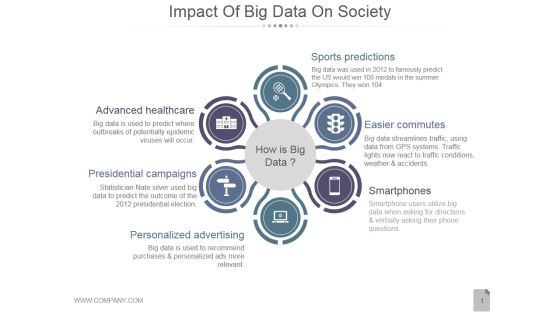
Impact Of Big Data On Society Ppt PowerPoint Presentation Diagrams
This is a impact of big data on society ppt powerpoint presentation diagrams. This is a six stage process. The stages in this process are sports predictions, easier commutes, smartphones, personalized advertising, presidential campaigns.

Impact Of Big Data On Business Intelligence Ppt PowerPoint Presentation Sample
This is a impact of big data on business intelligence ppt powerpoint presentation sample. This is a six stage process. The stages in this process are sports predictions, easier commutes, smartphones, personalized advertising, presidential campaigns, advanced healthcare.

Business Impact And Large Data Ppt PowerPoint Presentation Example 2015
This is a business impact and large data ppt powerpoint presentation example 2015. This is a six stage process. The stages in this process are sports predictions, easier commutes, smartphones, personalized advertising, presidential campaigns, how is big data.
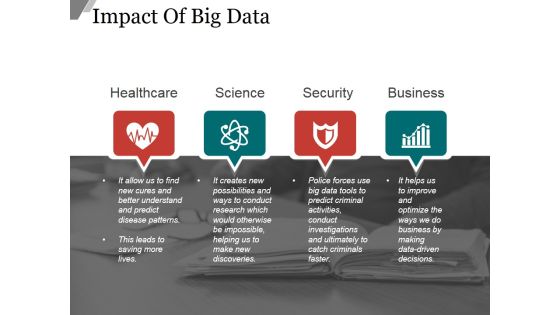
Impact Of Big Data Template Ppt PowerPoint Presentation Tips
This is a impact of big data template ppt powerpoint presentation tips. This is a six stage process. The stages in this process are sports predictions, easier commutes, smartphones, personalized advertising, presidential campaigns, advanced healthcare.
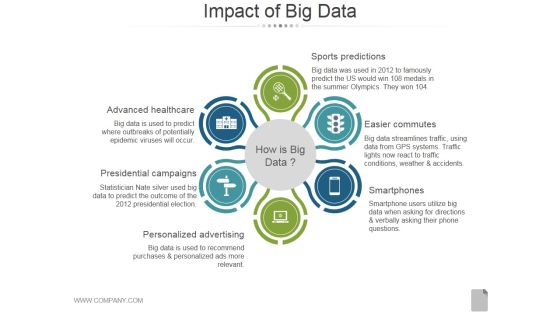
Impact Of Big Data Template 2 Ppt PowerPoint Presentation Styles
This is a impact of big data template 2 ppt powerpoint presentation styles. This is a six stage process. The stages in this process are sports predictions, easier commutes, smartphones, personalized advertising, presidential campaigns, advanced healthcare.
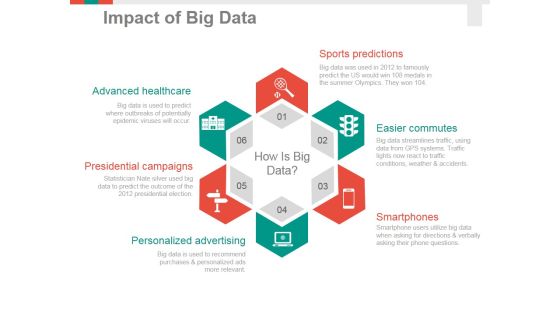
Impact Of Big Data Template 1 Ppt PowerPoint Presentation Outline Templates
This is a impact of big data template 1 ppt powerpoint presentation outline templates. This is a six stage process. The stages in this process are sports predictions, easier commutes, smartphones, personalized advertising, presidential campaigns, advanced healthcare.

Capability Maturity Model Ppt PowerPoint Presentation Portfolio Tips
This is a capability maturity model ppt powerpoint presentation portfolio tips. This is a three stage process. The stages in this process are optimizing, predictable, maturity level, focus, process areas.

Capability Maturity Model Ppt PowerPoint Presentation Styles Files
This is a capability maturity model ppt powerpoint presentation styles files. This is a three stage process. The stages in this process are optimizing, predictable, managed, focus, process areas.
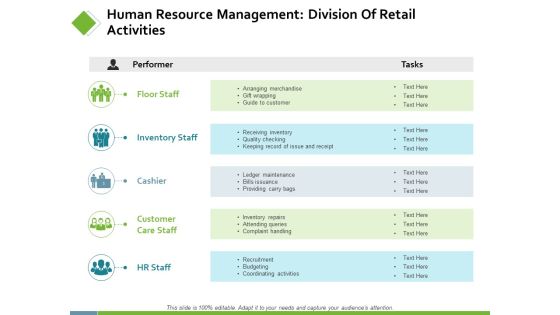
Human Resource Management Division Of Retail Activities Ppt PowerPoint Presentation Pictures Templates
This is a human resource management division of retail activities ppt powerpoint presentation pictures templates. This is a five stage process. The stages in this process are floor staff, cashier, inventory staff, recruitment, budgeting.
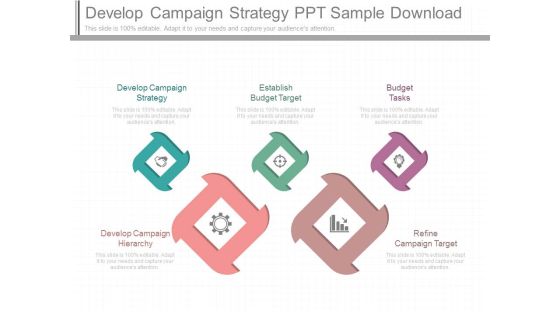
Develop Campaign Strategy Ppt Sample Download
This is a develop campaign strategy ppt sample download. This is a five stage process. The stages in this process are develop campaign strategy, establish budget target, budget tasks, refine campaign target, develop campaign hierarchy.
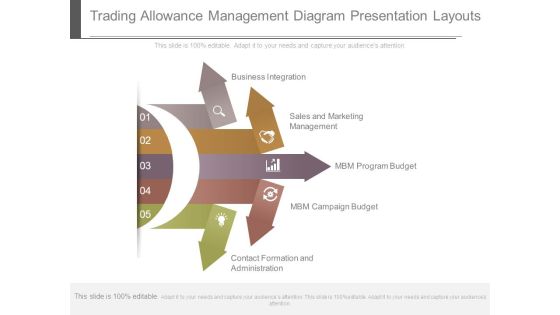
Trading Allowance Management Diagram Presentation Layouts
This is a trading allowance management diagram presentation layouts. This is a five stage process. The stages in this process are business integration, sales and marketing management, mbm program budget, mbm campaign budget, contact formation and administration.

Top Marketing Campaigns Ppt PowerPoint Presentation Gallery Display
This is a top marketing campaigns ppt powerpoint presentation gallery display. This is a six stage process. The stages in this process are campaign, max of budget, daily budget, marketing campaigns.

Top Marketing Campaigns Ppt PowerPoint Presentation Inspiration Structure
This is a top marketing campaigns ppt powerpoint presentation inspiration structure. This is a four stage process. The stages in this process are campaign, daily budget, margin, max percentage of budget.

Campaigns Done Ppt PowerPoint Presentation Visual Aids Icon
This is a campaigns done ppt powerpoint presentation visual aids icon. This is a four stage process. The stages in this process are daily budget, max pub cost, max of budget, margin .

Campaigns Done Ppt PowerPoint Presentation Outline Clipart
This is a campaigns done ppt powerpoint presentation outline clipart. This is a five stage process. The stages in this process are campaign, daily budget, number of days at or above budget.

Actual Vs Target Variance Ppt PowerPoint Presentation Gallery Background
This is a actual vs target variance ppt powerpoint presentation gallery background. This is a eight stage process. The stages in this process are Cost, Budget, Variation, Revenue, Budget.

Pricing For New Products Ppt Example
This is a pricing for new products ppt example. This is a six stage process. The stages in this process are pricing objectives, determine demand, estimate costs, competitor analysis, price method, final price.

Accounting Cost Information Layout Powerpoint Templates
This is a accounting cost information layout powerpoint templates. This is a six stage process. The stages in this process are true costs, coat accounting, estimating, hourly cost rates, plant data collection, management system, production standards.
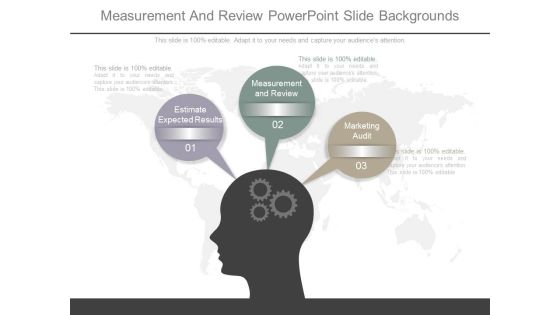
Measurement And Review Powerpoint Slide Backgrounds
This is a measurement and review powerpoint slide backgrounds. This is a three stage process. The stages in this process are estimate expected results, measurement and review, marketing audit.

Valuation Modeling Ppt Presentation Background Image
This is a valuation modeling ppt presentation background image. This is a three stage process. The stages in this process are assess portfolio risk, analyze economic benefit, estimate and risk adjust value range.
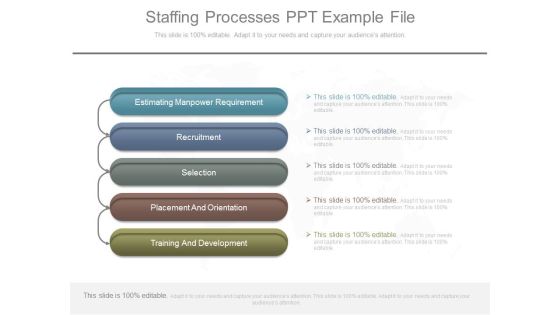
Staffing Processes Ppt Example File
This is a staffing processes ppt example file. This is a five stage process. The stages in this process are estimating manpower requirement, recruitment, selection, placement and orientation, training and development.

Cost Accounting Practice Example Ppt Presentation
This is a cost accounting practice example ppt presentation. This is a six stage process. The stages in this process are management system, plant data collection, production standards, hourly cost rates, estimating, cost accounting.
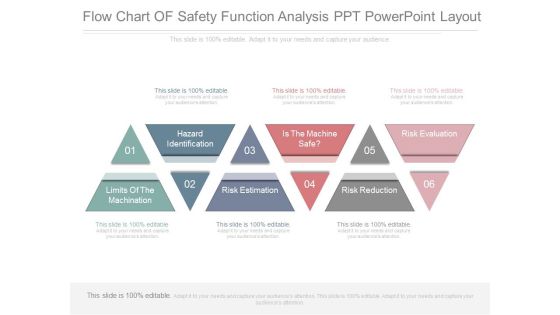
Flow Chart Of Safety Function Analysis Ppt Powerpoint Layout
This is a flow chart of safety function analysis ppt powerpoint layout. This is a six stage process. The stages in this process are hazard identification, limits of the machination, risk estimation, is the machine safe, risk reduction, risk evaluation.

Market Analysis Website Diagram Example Of Ppt Presentation
This is a market analysis website diagram example of ppt presentation. This is a seven stage process. The stages in this process are market segments, competitors, estimate market share, market size, competition influence, customer mix, market analysis, spending group.

Costing Of New Commodity Diagram Powerpoint Graphics
This is a costing of new commodity diagram powerpoint graphics. This is a four stage process. The stages in this process are price method, estimate costs, pricing police, positioning.

Data Service Analytics Diagram Ppt Inspiration
This is a data service analytics diagram ppt inspiration. This is a eight stage process. The stages in this process are traffic demand estimation, policy control analytics, data processing, device analytics, service quality analytics, charging verification, productivity, statistical research.
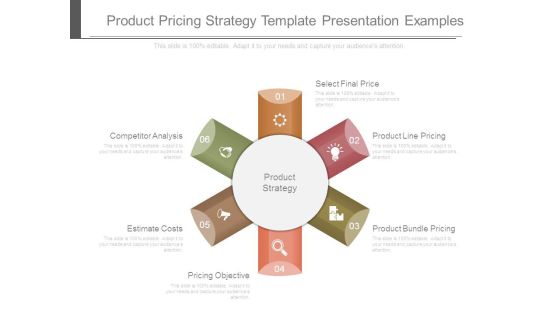
Product Pricing Strategy Template Presentation Examples
This is a product pricing strategy template presentation examples. This is a six stage process. The stages in this process are competitor analysis, estimate costs, pricing objective, product strategy, select final price, product line pricing, product bundle pricing.

Financial Modeling Ppt Layout Presentation Portfolio
This is a financial modeling ppt layout presentation portfolio. This is a six stage process. The stages in this process are restructure, established, operational set up, assess portfolio risk, analyze economic benefit, estimate and risk adjust value range.
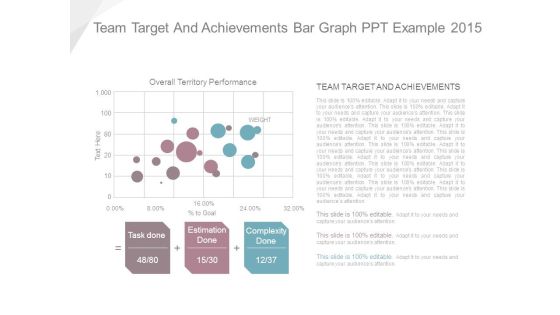
Team Target And Achievements Bar Graph Ppt Example 2015
This is a team target and achievements bar graph ppt example 2015. This is a three stage process. The stages in this process are task done, estimation done, complexity done, overall territory performance, team target and achievements.

 Home
Home