Project Snapshot

Thank You Financial Forecast Ppt PowerPoint Presentation Pictures Show
This is a thank you financial forecast ppt powerpoint presentation pictures show. This is a one stage process. The stages in this process are thank you, risk matrix business, management, planning, strategy.

Forecasting Hr Requirements Business Ppt PowerPoint Presentation Pictures Microsoft
This is a forecasting hr requirements business ppt powerpoint presentation pictures microsoft. This is a three stage process. The stages in this process are compare, marketing, business, management, planning.
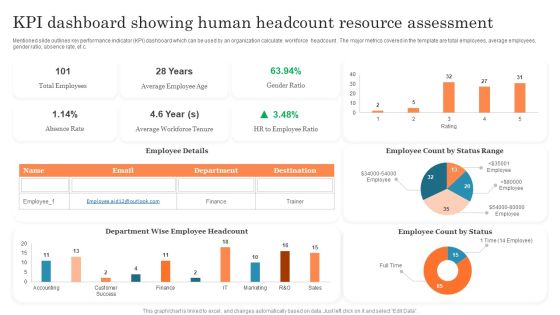
KPI Dashboard Showing Human Headcount Resource Assessment Ppt PowerPoint Presentation Outline PDF
Mentioned slide outlines key performance indicator KPI dashboard which can be used by an organization calculate workforce headcount . The major metrics covered in the template are total employees, average employees, gender ratio, absence rate, etc. Pitch your topic with ease and precision using this KPI Dashboard Showing Human Headcount Resource Assessment Ppt PowerPoint Presentation Outline PDF. This layout presents information on Total Employees, Average Employee, Employee Count. It is also available for immediate download and adjustment. So, changes can be made in the color, design, graphics or any other component to create a unique layout.

Cash Flow Forecasting Ppt PowerPoint Presentation Pictures Cpb
Presenting this set of slides with name cash flow forecasting ppt powerpoint presentation pictures cpb. This is an editable Powerpoint four stages graphic that deals with topics like cash flow forecasting to help convey your message better graphically. This product is a premium product available for immediate download and is 100 percent editable in Powerpoint. Download this now and use it in your presentations to impress your audience.

Business Planning Financial Forecasting Ppt PowerPoint Presentation File Picture Cpb
Presenting this set of slides with name business planning financial forecasting ppt powerpoint presentation file picture cpb. This is an editable Powerpoint six stages graphic that deals with topics like business planning financial forecasting to help convey your message better graphically. This product is a premium product available for immediate download and is 100 percent editable in Powerpoint. Download this now and use it in your presentations to impress your audience.
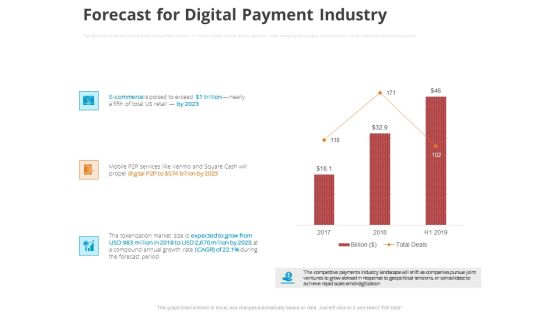
Online Settlement Revolution Forecast For Digital Payment Industry Pictures PDF
Highlights five trends that should shape the payments industry in the year ahead, looking at how regulatory shifts, emerging technologies, and competition could impact the payments ecosystem. Deliver and pitch your topic in the best possible manner with this online settlement revolution forecast for digital payment industry pictures pdf. Use them to share invaluable insights on forecast for digital payment industry and impress your audience. This template can be altered and modified as per your expectations. So, grab it now.

Vehicle Sale Forecast After Strategy Implementation Grow Pictures PDF
The slide shows the forecasted number of vehicle sale by company A in next six years 2020 to 2025. It also provides key insights such as CAGR growth, major implemented strategies etc.Deliver an awe-inspiring pitch with this creative vehicle sale forecast after strategy implementation grow pictures pdf bundle. Topics like vehicle sale, price analysing strategy, business diversification strategy can be discussed with this completely editable template. It is available for immediate download depending on the needs and requirements of the user.

Smartphone Sale Forecast After Strategy Implementation Ppt Pictures Show PDF
The slide shows the forecasted number of smartphone sale by the company ABC in next six years 2020 2025. It also provides key insights such as CAGR growth, major implemented strategies etc. Deliver an awe-inspiring pitch with this creative smartphone sale forecast after strategy implementation ppt pictures show pdf. bundle. Topics like implementing, strategies, investment strategy, technological, sales can be discussed with this completely editable template. It is available for immediate download depending on the needs and requirements of the user.

Agenda Checklist Image For Forecasting Payroll Costs Pictures PDF
Persuade your audience using this agenda checklist image for forecasting payroll costs pictures pdf. This PPT design covers four stages, thus making it a great tool to use. It also caters to a variety of topics including agenda checklist image for forecasting payroll costs. Download this PPT design now to present a convincing pitch that not only emphasizes the topic but also showcases your presentation skills.

Company Income Statement Historic Vs Forecasted Pictures PDF
This slide shows companys Income statement for the historic as well as Forecast period along with Revenue and total expenses Deliver an awe inspiring pitch with this creative company income statement historic vs forecasted pictures pdf bundle. Topics like research and development, marketing and sales, operating expenses can be discussed with this completely editable template. It is available for immediate download depending on the needs and requirements of the user.

Forecasting Program Impact On Organization Performance Tips Pictures PDF
displays detailed forecasting statistics for anticipating the impact of team building program on organization performance. This covers attrition rate, hiring cost engagement rate etc.Deliver an awe inspiring pitch with this creative forecasting program impact on organization performance tips pictures pdf bundle. Topics like attrition rate, average hiring cos, engagement rate can be discussed with this completely editable template. It is available for immediate download depending on the needs and requirements of the user.

Determine Critical Meetings Pipeline Vs Forecast Review Pictures PDF
This slide provides information regarding the comparison of critical meetings for pipeline management and forecast review in terms of duration, people involved, meeting purpose, etc. Deliver and pitch your topic in the best possible manner with this Determine Critical Meetings Pipeline Vs Forecast Review Pictures PDF. Use them to share invaluable insights on Sales Manager, Sales Development Representative, Goals and impress your audience. This template can be altered and modified as per your expectations. So, grab it now.

Actual And Forecasted Online Sales Comparison Pictures PDF
This slide shows the comparison between quarterly actual and forecasted sales of b2b online products. Showcasing this set of slides titled Actual And Forecasted Online Sales Comparison Pictures PDF. The topics addressed in these templates are Revenue, Marketing Of Products. All the content presented in this PPT design is completely editable. Download it and make adjustments in color, background, font etc. as per your unique business setting.

Predictive Data Model Predictive Analytics In Finding Better Customer Leads Sample PDF
This slide represents how predictive analytics can help the marketing industry find better customer leads and can be used in ad targeting, suggestive copywriting, lead prospecting, and targeted sales conversations. Slidegeeks has constructed Predictive Data Model Predictive Analytics In Finding Better Customer Leads Sample PDF after conducting extensive research and examination. These presentation templates are constantly being generated and modified based on user preferences and critiques from editors. Here, you will find the most attractive templates for a range of purposes while taking into account ratings and remarks from users regarding the content. This is an excellent jumping-off point to explore our content and will give new users an insight into our top-notch PowerPoint Templates.

Compensation And Salary Dashboard With Estimated Income Ideas PDF
The following slide showcases dashboard highlighting employee compensation and performance analysis. The dashboard also includes credit, attainment and estimated earnings. Showcasing this set of slides titled Compensation And Salary Dashboard With Estimated Income Ideas PDF. The topics addressed in these templates are Performance Analysis, Compensation Analysis, Historical Performance Analysis. All the content presented in this PPT design is completely editable. Download it and make adjustments in color, background, font etc. as per your unique business setting.
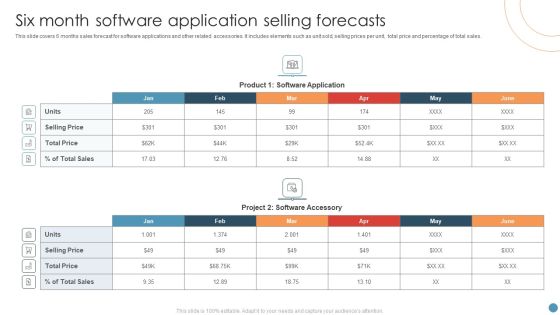
Six Month Software Application Selling Forecasts Pictures PDF
This slide covers 6 months sales forecast for software applications and other related accessories. It includes elements such as unit sold, selling prices per unit, total price and percentage of total sales. Pitch your topic with ease and precision using this Six Month Software Application Selling Forecasts Pictures PDF. This layout presents information on Software Application, Product, Price. It is also available for immediate download and adjustment. So, changes can be made in the color, design, graphics or any other component to create a unique layout.
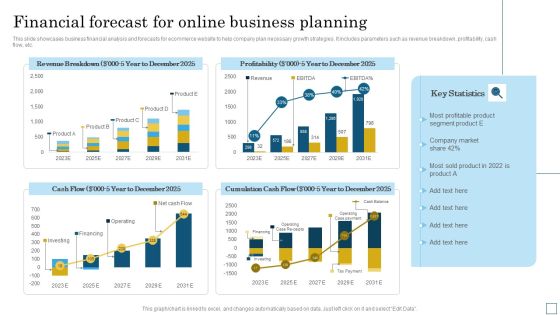
Financial Forecast For Online Business Planning Pictures PDF
This slide showcases business financial analysis and forecasts for ecommerce website to help company plan necessary growth strategies. It includes parameters such as revenue breakdown, profitability, cash flow, etc. Pitch your topic with ease and precision using this Financial Forecast For Online Business Planning Pictures PDF. This layout presents information on Cumulation Cash Flow, Profitability, Revenue Breakdown. It is also available for immediate download and adjustment. So, changes can be made in the color, design, graphics or any other component to create a unique layout.
Revenue Forecast Vector Icon Ppt PowerPoint Presentation Infographics Graphics Pictures
Presenting this set of slides with name revenue forecast vector icon ppt powerpoint presentation infographics graphics pictures. The topics discussed in these slides are financial analysis, balance sheet, income statement. This is a completely editable PowerPoint presentation and is available for immediate download. Download now and impress your audience.

Financial Forecast Related To The Company Pictures PDF
Deliver and pitch your topic in the best possible manner with this financial forecast related to the company pictures pdf. Use them to share invaluable insights on total customers, gross revenue, paying customers after churn and impress your audience. This template can be altered and modified as per your expectations. So, grab it now.
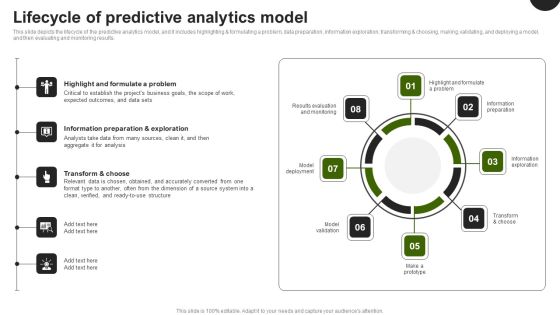
Predictive Analytics In The Age Of Big Data Lifecycle Of Predictive Analytics Model Pictures PDF
This slide depicts the lifecycle of the predictive analytics model, and it includes highlighting and formulating a problem, data preparation, information exploration, transforming and choosing, making, validating, and deploying a model, and then evaluating and monitoring results. Present like a pro with Predictive Analytics In The Age Of Big Data Lifecycle Of Predictive Analytics Model Pictures PDF Create beautiful presentations together with your team, using our easy to use presentation slides. Share your ideas in real time and make changes on the fly by downloading our templates. So whether you are in the office, on the go, or in a remote location, you can stay in sync with your team and present your ideas with confidence. With Slidegeeks presentation got a whole lot easier. Grab these presentations today.
Operational Outlook Of Security Awareness Training Software Icons PDF
The purpose of this slide is to showcase the general outlook of cyber security awareness training software. The slide covers information about opened simulations, links clicked, reported, attachments opened, data entered etc. Deliver an awe inspiring pitch with this creative Operational Outlook Of Security Awareness Training Software Icons PDF bundle. Topics like Educate Employees, Dynamic Training, Customized Content can be discussed with this completely editable template. It is available for immediate download depending on the needs and requirements of the user.

Business Intelligence Dashboard Design Ppt Powerpoint Topics
This is a business intelligence dashboard design ppt powerpoint topics. This is a four stage process. The stages in this process are sales analysis, sales forecasting, global distribution, sales by region, latin america, north america, eastern europe, western europe.
Estimating The Price Price Optimization Dashboard Portrait PDF
This slide covers the details of price optimization which focuses on price changes, leader, distribution, and benchmark. Deliver an awe inspiring pitch with this creative Estimating The Price Price Optimization Dashboard Portrait PDF bundle. Topics like Price Optimization Dashboard can be discussed with this completely editable template. It is available for immediate download depending on the needs and requirements of the user.

Financial Forecasting Models For Strategic Planning Pictures PDF
The following slide outlines different type of financial forecasting models which will assist the organization in developing long term business strategies. The models are bottom-up, tow-down, statistical and Delphi forecasting. Crafting an eye catching presentation has never been more straightforward. Let your presentation shine with this tasteful yet straightforward Comparing Our Income Statement With Other Successful Competitors Topics PDF template. It offers a minimalistic and classy look that is great for making a statement. The colors have been employed intelligently to add a bit of playfulness while still remaining professional. Construct the ideal Comparing Our Income Statement With Other Successful Competitors Topics PDF that effortlessly grabs the attention of your audience Begin now and be certain to wow your customers.

Predicting Customer Churn Probability Through Predictive Analytics Inspiration PDF
After deploying predictive analytics tool, the firm will become capable in predicting churn probability of various customers on basis of various attributes such as NPS, transaction usage, etc. that are retrieved from customer data. Coming up with a presentation necessitates that the majority of the effort goes into the content and the message you intend to convey. The visuals of a PowerPoint presentation can only be effective if it supplements and supports the story that is being told. Keeping this in mind our experts created Predicting Customer Churn Probability Through Predictive Analytics Inspiration PDF to reduce the time that goes into designing the presentation. This way, you can concentrate on the message while our designers take care of providing you with the right template for the situation.

Forecast Analysis Technique IT Meet Our Team Pictures PDF
Present like a pro with Forecast Analysis Technique IT Meet Our Team Pictures PDF Create beautiful presentations together with your team, using our easy to use presentation slides. Share your ideas in real time and make changes on the fly by downloading our templates. So whether you are in the office, on the go, or in a remote location, you can stay in sync with your team and present your ideas with confidence. With Slidegeeks presentation got a whole lot easier. Grab these presentations today.

Business Sales Comparison With Actual And Predictive Data Ppt Model Slide PDF
The following slide highlights the annual sales forecast report for business illustrating key headings which includes product, last year, forecast, actual, number of customers, average sales per customer and net sales. Showcasing this set of slides titled business sales comparison with actual and predictive data ppt model slide pdf. The topics addressed in these templates are antivirus protection, cloud solutions, system controls. All the content presented in this PPT design is completely editable. Download it and make adjustments in color, background, font etc. as per your unique business setting.

Predictive Analytics Methods Predictive Analytics In Banking And Finance Industry Pictures PDF
This slide represents the application of predictive analytics in the finance and banking sector as they deal with vast amounts of data. It helps these industries identify fraudulent transactions, generate credit score, monitor credit risks, and optimize cross-sell or up-sell possibilities. Coming up with a presentation necessitates that the majority of the effort goes into the content and the message you intend to convey. The visuals of a PowerPoint presentation can only be effective if it supplements and supports the story that is being told. Keeping this in mind our experts created Predictive Analytics Methods Predictive Analytics In Banking And Finance Industry Pictures PDF to reduce the time that goes into designing the presentation. This way, you can concentrate on the message while our designers take care of providing you with the right template for the situation.
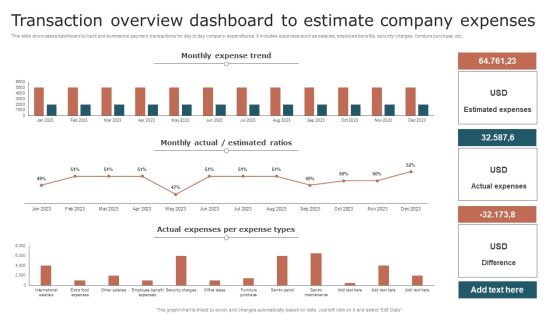
Transaction Overview Dashboard To Estimate Company Expenses Mockup PDF
This slide showcases dashboard to track and summarize payment transactions for day to day company expenditures. It includes expenses such as salaries, employee benefits, security charges, furniture purchase, etc. Showcasing this set of slides titled Transaction Overview Dashboard To Estimate Company Expenses Mockup PDF. The topics addressed in these templates are Monthly Expense Trend, Estimated Ratios, Actual Expenses. All the content presented in this PPT design is completely editable. Download it and make adjustments in color, background, font etc. as per your unique business setting.

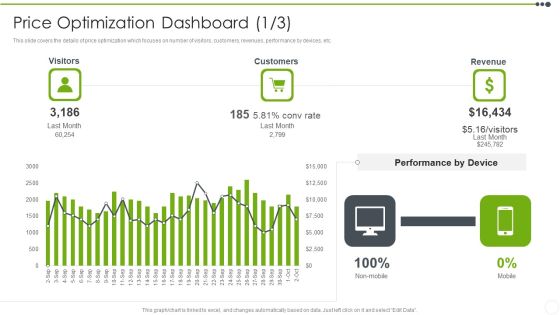
Estimating The Price Price Optimization Dashboard Range Guidelines PDF
This slide covers the details of price optimization which focuses on number of visitors, customers, revenues, performance by devices, etc. Deliver and pitch your topic in the best possible manner with this Estimating The Price Price Optimization Dashboard Range Guidelines PDF. Use them to share invaluable insights on Price Optimization Dashboard and impress your audience. This template can be altered and modified as per your expectations. So, grab it now.
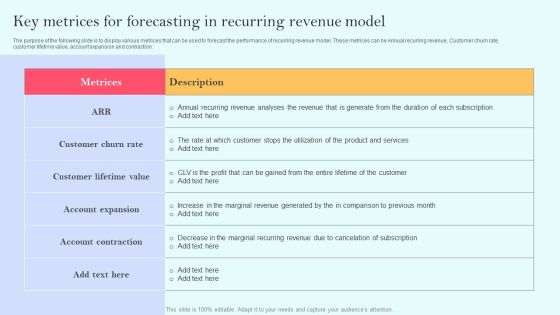
Recurring Income Generation Model Key Metrices For Forecasting In Recurring Revenue Model Summary PDF
The purpose of the following slide is to display various metrices that can be used to forecast the performance of recurring revenue model. These metrices can be Annual recurring revenue, Customer churn rate, customer lifetime value, account expansion and contraction. This modern and well arranged Recurring Income Generation Model Key Metrices For Forecasting In Recurring Revenue Model Summary PDF provides lots of creative possibilities. It is very simple to customize and edit with the Powerpoint Software. Just drag and drop your pictures into the shapes. All facets of this template can be edited with Powerpoint no extra software is necessary. Add your own material, put your images in the places assigned for them, adjust the colors, and then you can show your slides to the world, with an animated slide included.
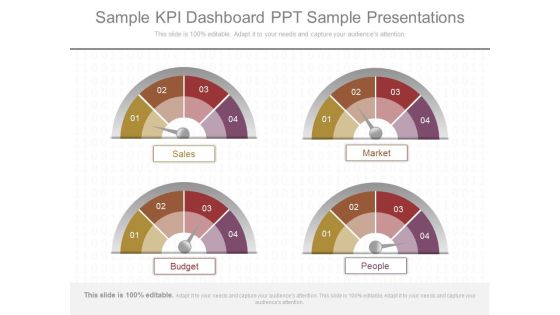
Sample Kpi Dashboard Ppt Sample Presentations
This is a sample kpi dashboard ppt sample presentations. This is a four stage process. The stages in this process are sales, market, budget, people.

Security In 5G Technology Architecture 5G Network Structure Pictures PDF
This slide depicts the security in 5G architecture, including the standards detailed by 3GPP 3rd Generation Partnership Project, such as SUPI, unified authentication, extensible authentication standards, and flexible security policies.Retrieve professionally designed Security In 5G Technology Architecture 5G Network Structure Pictures PDF to effectively convey your message and captivate your listeners. Save time by selecting pre-made slideshows that are appropriate for various topics, from business to educational purposes. These themes come in many different styles, from creative to corporate, and all of them are easily adjustable and can be edited quickly. Access them as PowerPoint templates or as Google Slides themes. You Do not have to go on a hunt for the perfect presentation because Slidegeeks got you covered from everywhere.
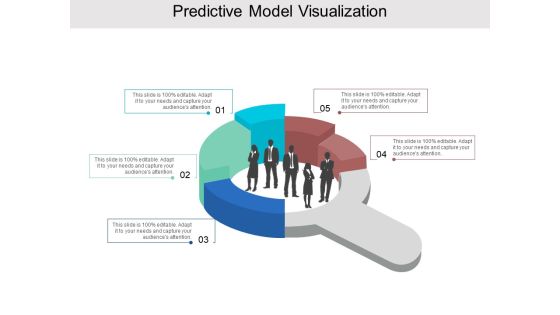
Predictive Model Visualization Ppt PowerPoint Presentation Pictures Graphics Example
This is a predictive model visualization ppt powerpoint presentation pictures graphics example. This is a five stage process. The stages in this process are predictive model, predictive framework, predictive structure.

Deploying And Managing Recurring Key Metrices For Forecasting In Recurring Revenue Professional PDF
The purpose of the following slide is to display various metrices that can be used to forecast the performance of recurring revenue model. These metrices can be Annual recurring revenue, Customer churn rate, customer lifetime value, account expansion and contraction. Whether you have daily or monthly meetings, a brilliant presentation is necessary. Deploying And Managing Recurring Key Metrices For Forecasting In Recurring Revenue Professional PDF can be your best option for delivering a presentation. Represent everything in detail using Deploying And Managing Recurring Key Metrices For Forecasting In Recurring Revenue Professional PDF and make yourself stand out in meetings. The template is versatile and follows a structure that will cater to your requirements. All the templates prepared by Slidegeeks are easy to download and edit. Our research experts have taken care of the corporate themes as well. So, give it a try and see the results.

Cost Comparison Analysis Powerpoint Slide Deck
This is a cost comparison analysis powerpoint slide deck. This is a two stage process. The stages in this process are cost comparison, business, strategy, marketing.

KPI Dashboard To Monitor Financial Budget Allocation And Distribution Portrait PDF
This slide signifies the key performance indicator dashboard on organisation financial budget allocation within various department. It includes budget allocation, monthly performance, top suppliers etc.Deliver an awe inspiring pitch with this creative KPI Dashboard To Monitor Financial Budget Allocation And Distribution Portrait PDF bundle. Topics like Budget Allocated, Budget Distributed, Payable Account can be discussed with this completely editable template. It is available for immediate download depending on the needs and requirements of the user.

Key Company Financials Business Intelligence Dashboard Graphics PDF
This slide showcases business intelligence dashboard to analyze key financial metrics for the organization. It includes information such as current working capital, vendor payment error rate, quick stats, budget variance, etc. Showcasing this set of slides titled Key Company Financials Business Intelligence Dashboard Graphics PDF. The topics addressed in these templates are Key Company Financials, Business Intelligence Dashboard. All the content presented in this PPT design is completely editable. Download it and make adjustments in color, background, font etc. as per your unique business setting.

Periodic Revenue Model Key Metrices For Forecasting In Recurring Revenue Model Portrait PDF
The purpose of the following slide is to display various metrices that can be used to forecast the performance of recurring revenue model. These metrices can be Annual recurring revenue, Customer churn rate, customer lifetime value, account expansion and contraction. Find a pre designed and impeccable Periodic Revenue Model Key Metrices For Forecasting In Recurring Revenue Model Portrait PDF. The templates can ace your presentation without additional effort. You can download these easy to edit presentation templates to make your presentation stand out from others. So, what are you waiting for Download the template from Slidegeeks today and give a unique touch to your presentation.

Membership Based Revenue Plan Key Metrices For Forecasting In Recurring Revenue Model Mockup PDF
The purpose of the following slide is to display various metrices that can be used to forecast the performance of recurring revenue model. These metrices can be Annual recurring revenue, Customer churn rate, customer lifetime value, account expansion and contraction. Find highly impressive Membership Based Revenue Plan Key Metrices For Forecasting In Recurring Revenue Model Mockup PDF on Slidegeeks to deliver a meaningful presentation. You can save an ample amount of time using these presentation templates. No need to worry to prepare everything from scratch because Slidegeeks experts have already done a huge research and work for you. You need to download Membership Based Revenue Plan Key Metrices For Forecasting In Recurring Revenue Model Mockup PDF for your upcoming presentation. All the presentation templates are 100 percent editable and you can change the color and personalize the content accordingly. Download now

Saas Continuous Income Generation Model For Software Startup Key Metrices For Forecasting In Recurring Slides PDF
The purpose of the following slide is to display various metrices that can be used to forecast the performance of recurring revenue model. These metrices can be Annual recurring revenue, Customer churn rate, customer lifetime value, account expansion and contraction. Do you have to make sure that everyone on your team knows about any specific topic I yes, then you should give Saas Continuous Income Generation Model For Software Startup Key Metrices For Forecasting In Recurring Slides PDF a try. Our experts have put a lot of knowledge and effort into creating this impeccable Saas Continuous Income Generation Model For Software Startup Key Metrices For Forecasting In Recurring Slides PDF. You can use this template for your upcoming presentations, as the slides are perfect to represent even the tiniest detail. You can download these templates from the Slidegeeks website and these are easy to edit. So grab these today.
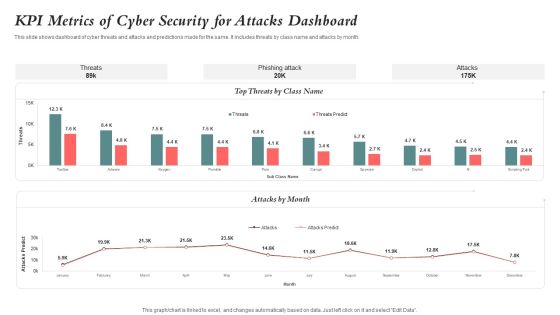
KPI Metrics Of Cyber Security For Attacks Dashboard Guidelines PDF
This slide shows dashboard of cyber threats and attacks and predictions made for the same. It includes threats by class name and attacks by month. Showcasing this set of slides titled KPI Metrics Of Cyber Security For Attacks Dashboard Guidelines PDF. The topics addressed in these templates are Kpi Metrics, Cyber Security, Attacks Dashboard. All the content presented in this PPT design is completely editable. Download it and make adjustments in color, background, font etc. as per your unique business setting.

Consumption Based Pricing Model Key Metrices For Forecasting In Recurring Revenue Model Clipart PDF
The purpose of the following slide is to display various metrices that can be used to forecast the performance of recurring revenue model. These metrices can be annual recurring revenue, customer churn rate, customer lifetime value, account expansion and contraction. Coming up with a presentation necessitates that the majority of the effort goes into the content and the message you intend to convey. The visuals of a PowerPoint presentation can only be effective if it supplements and supports the story that is being told. Keeping this in mind our experts created Consumption Based Pricing Model Key Metrices For Forecasting In Recurring Revenue Model Clipart PDF to reduce the time that goes into designing the presentation. This way, you can concentrate on the message while our designers take care of providing you with the right template for the situation.

World Economic Outlook Ppt PowerPoint Presentation Pictures Graphics Example
This is a world economic outlook ppt powerpoint presentation pictures graphics example. This is a four stage process. The stages in this process are canada, brazil, australia, russia.

Customer Lifetime Value Profit Calculations Ppt Presentation
This is a customer lifetime value profit calculations ppt presentation. This is a five stage process. The stages in this process are complete clv year, average acquisition cost, average customer revenue, average customer costs, average customer profit, customer retention rate, cumulative retention rate, likely customer profit, discount rate.

Predictive Analytics In The Age Of Big Data Predictive Analytics In Align Sales And Marketing Better Topics PDF
This slide describes how predictive analytics can help align sales and marketing better. Predictive analytics can help get insights from sales and marketing teams that can help to improve several factors, including handing off leads, communication of promotions, and so on. This modern and well arranged Predictive Analytics In The Age Of Big Data Predictive Analytics In Align Sales And Marketing Better Topics PDF provides lots of creative possibilities. It is very simple to customize and edit with the Powerpoint Software. Just drag and drop your pictures into the shapes. All facets of this template can be edited with Powerpoint no extra software is necessary. Add your own material, put your images in the places assigned for them, adjust the colors, and then you can show your slides to the world, with an animated slide included.

Budgeting Template Ppt PowerPoint Presentation Icon Examples
This is a budgeting template ppt powerpoint presentation icon examples. This is a four stage process. The stages in this process are public relations, web marketing, advertising, press release development, microsoft as program.
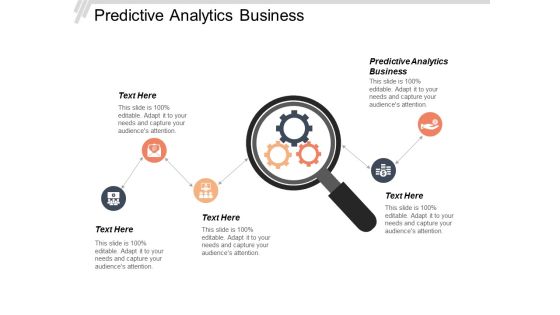
Predictive Analytics Business Ppt Powerpoint Presentation Gallery Shapes Cpb
This is a predictive analytics business ppt powerpoint presentation gallery shapes cpb. This is a five stage process. The stages in this process are predictive analytics business.
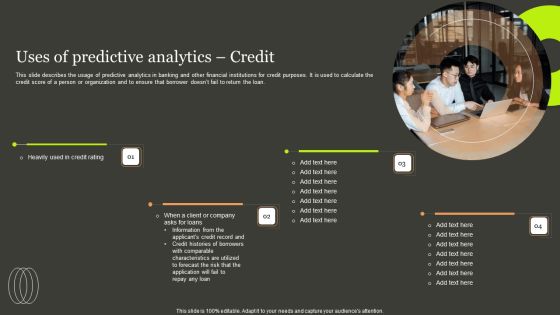
Predictive Analytics Methods Uses Of Predictive Analytics Credit Diagrams PDF
This slide describes the usage of predictive analytics in banking and other financial institutions for credit purposes. It is used to calculate the credit score of a person or organization and to ensure that borrower doesnt fail to return the loan. Slidegeeks is here to make your presentations a breeze with Predictive Analytics Methods Uses Of Predictive Analytics Credit Diagrams PDF With our easy to use and customizable templates, you can focus on delivering your ideas rather than worrying about formatting. With a variety of designs to choose from, you are sure to find one that suits your needs. And with animations and unique photos, illustrations, and fonts, you can make your presentation pop. So whether you are giving a sales pitch or presenting to the board, make sure to check out Slidegeeks first.

Calculate Cash Conversion Inventory And Sales Outstanding Ppt PowerPoint Presentation Portfolio Styles
Presenting this set of slides with name calculate cash conversion inventory and sales outstanding ppt powerpoint presentation portfolio styles. The topics discussed in these slides are cash flow, fund flow, trading cycle. This is a completely editable PowerPoint presentation and is available for immediate download. Download now and impress your audience.

Vendor Data Profile For Data Analytics Software Business Analysis Modification Toolkit Topics PDF
This is a Vendor Data Profile For Data Analytics Software Business Analysis Modification Toolkit Topics PDF template with various stages. Focus and dispense information on four stages using this creative set, that comes with editable features. It contains large content boxes to add your information on topics like Predictive Applications, Reporting Features, Security Features. You can also showcase facts, figures, and other relevant content using this PPT layout. Grab it now.

Prevention Of Information Operational Outlook Of Security Awareness Structure PDF
The purpose of this slide is to showcase the general outlook of cyber security awareness training software. The slide covers information about opened simulations, links clicked, reported, attachments opened, data entered. Slidegeeks has constructed Prevention Of Information Operational Outlook Of Security Awareness Structure PDF after conducting extensive research and examination. These presentation templates are constantly being generated and modified based on user preferences and critiques from editors. Here, you will find the most attractive templates for a range of purposes while taking into account ratings and remarks from users regarding the content. This is an excellent jumping-off point to explore our content and will give new users an insight into our top-notch PowerPoint Templates.
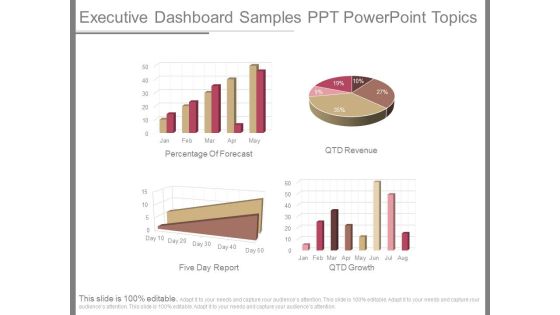
Executive Dashboard Samples Ppt Powerpoint Topics
This is a executive dashboard samples ppt powerpoint topics. This is a four stage process. The stages in this process are percentage of forecast, qtd revenue, five day report, qtd growth

Pitch Deck Ppt Raise Funding Corporate Investors Historical And Forecasted Income Statement Pictures PDF
This slide shows the historical and predicted income statement of the company which contains total revenue, costs, gross profit, operating expenses etc. Deliver an awe inspiring pitch with this creative pitch deck ppt raise funding corporate investors historical and forecasted income statement pictures pdf bundle. Topics like revenue, operating expenses, gross profit can be discussed with this completely editable template. It is available for immediate download depending on the needs and requirements of the user.
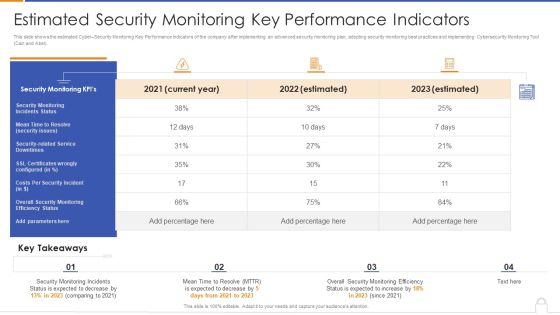
Estimated Security Monitoring Key Performance Indicators Diagrams PDF
Deliver and pitch your topic in the best possible manner with this estimated security monitoring key performance indicators diagrams pdf. Use them to share invaluable insights on security monitoring, security related service downtimes, overall security monitoring and impress your audience. This template can be altered and modified as per your expectations. So, grab it now.
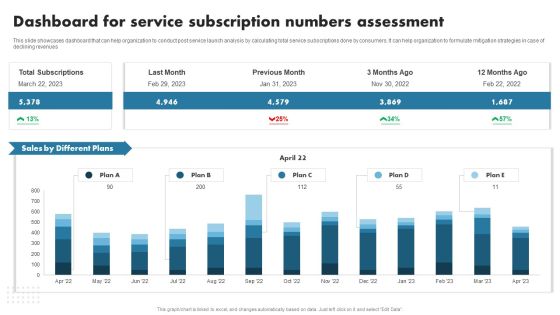
Enhancing Customer Outreach Dashboard For Service Subscription Numbers Template PDF
This slide showcases dashboard that can help organization to conduct post service launch analysis by calculating total service subscriptions done by consumers. It can help organization to formulate mitigation strategies in case of declining revenues. This Enhancing Customer Outreach Dashboard For Service Subscription Numbers Template PDF from Slidegeeks makes it easy to present information on your topic with precision. It provides customization options, so you can make changes to the colors, design, graphics, or any other component to create a unique layout. It is also available for immediate download, so you can begin using it right away. Slidegeeks has done good research to ensure that you have everything you need to make your presentation stand out. Make a name out there for a brilliant performance.
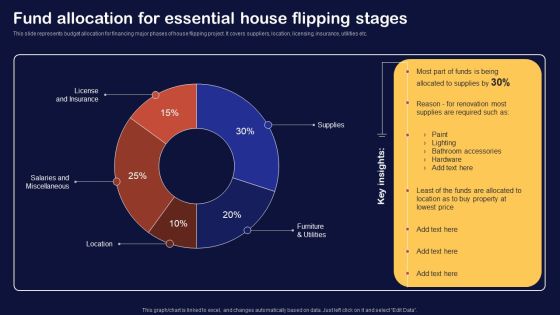
Synopsis For House Flipping Techniques Fund Allocation For Essential House Flipping Stages Introduction PDF
This slide represents budget allocation for financing major phases of house flipping project. It covers suppliers, location, licensing, insurance, utilities etc. Slidegeeks is here to make your presentations a breeze with Synopsis For House Flipping Techniques Fund Allocation For Essential House Flipping Stages Introduction PDF With our easy to use and customizable templates, you can focus on delivering your ideas rather than worrying about formatting. With a variety of designs to choose from, you are sure to find one that suits your needs. And with animations and unique photos, illustrations, and fonts, you can make your presentation pop. So whether you are giving a sales pitch or presenting to the board, make sure to check out Slidegeeks first

Cash Flow Management Order Control Ppt PowerPoint Presentation Design Ideas
This is a cash flow management order control ppt powerpoint presentation design ideas. This is a five stage process. The stages in this process are management, cash flow management, budget, financial analysis.

Predictive Analytics In The Age Of Big Data Tools Used For Predictive Analytics Clipart PDF
This slide depicts the tools used for predictive analytics to perform operations in predictive models. These tools include SPSS statistics, SAS advanced analytics, SAP predictive analytics, TIBCO Statistica, H2O, and Q research. Do you have to make sure that everyone on your team knows about any specific topic I yes, then you should give Predictive Analytics In The Age Of Big Data Tools Used For Predictive Analytics Clipart PDF a try. Our experts have put a lot of knowledge and effort into creating this impeccable Predictive Analytics In The Age Of Big Data Tools Used For Predictive Analytics Clipart PDF. You can use this template for your upcoming presentations, as the slides are perfect to represent even the tiniest detail. You can download these templates from the Slidegeeks website and these are easy to edit. So grab these today.
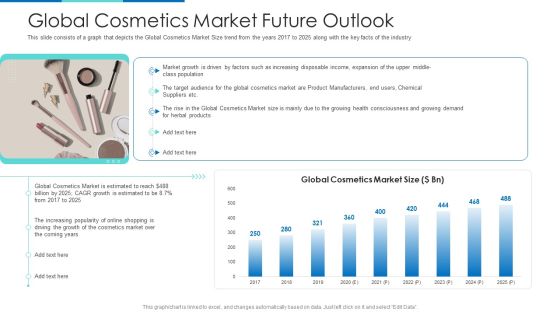
Global Cosmetics Market Future Outlook Ppt Pictures Example File PDF
This slide consists of a graph that depicts the Global Cosmetics Market Size trend from the years 2017 to 2025 along with the key facts of the industry Deliver and pitch your topic in the best possible manner with this global cosmetics market future outlook ppt pictures example file pdf. Use them to share invaluable insights on growth, cosmetics market, global cosmetics market, product manufacturers, income and impress your audience. This template can be altered and modified as per your expectations. So, grab it now.

Evaluate And Forecast Ad Quality Score Implementing PPC Marketing Strategies To Increase Conversion Ideas PDF
The following slide covers the ad quality score metrics to assess relevance of landing page. It includes key elements such as description, affecting factors, preference, impact strategies, calculation etc. Want to ace your presentation in front of a live audience Our Evaluate And Forecast Ad Quality Score Implementing PPC Marketing Strategies To Increase Conversion Ideas PDF can help you do that by engaging all the users towards you. Slidegeeks experts have put their efforts and expertise into creating these impeccable powerpoint presentations so that you can communicate your ideas clearly. Moreover, all the templates are customizable, and easy to edit and downloadable. Use these for both personal and commercial use.
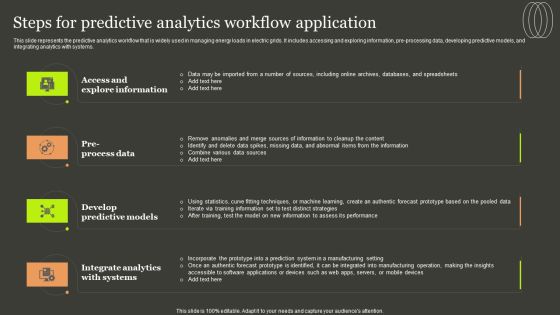
Predictive Analytics Methods Steps For Predictive Analytics Workflow Application Brochure PDF
This slide represents the predictive analytics workflow that is widely used in managing energy loads in electric grids. It includes accessing and exploring information, pre-processing data, developing predictive models, and integrating analytics with systems. Want to ace your presentation in front of a live audience Our Predictive Analytics Methods Steps For Predictive Analytics Workflow Application Brochure PDF can help you do that by engaging all the users towards you. Slidegeeks experts have put their efforts and expertise into creating these impeccable powerpoint presentations so that you can communicate your ideas clearly. Moreover, all the templates are customizable, and easy to edit and downloadable. Use these for both personal and commercial use.

Calculate Facebook Key Performance Indicator And Track Your Performance Information PDF
Showcasing this set of slides titled calculate facebook key performance indicator and track your performance information pdf. The topics addressed in these templates are calculate facebook key performance indicator and track your performance. All the content presented in this PPT design is completely editable. Download it and make adjustments in color, background, font etc. as per your unique business setting.
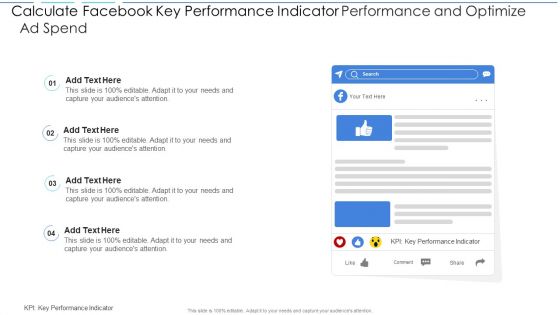
Calculate Facebook Key Performance Indicator Performance And Optimize Ad Spend Brochure PDF
Showcasing this set of slides titled calculate facebook key performance indicator performance and optimize ad spend brochure pdf. The topics addressed in these templates are calculate facebook key performance indicator performance and optimize ad spend. All the content presented in this PPT design is completely editable. Download it and make adjustments in color, background, font etc. as per your unique business setting.
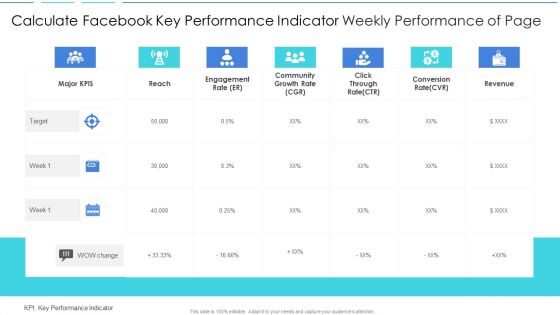
Calculate Facebook Key Performance Indicator Weekly Performance Of Page Elements PDF
Pitch your topic with ease and precision using this calculate facebook key performance indicator weekly performance of page elements pdf. This layout presents information on calculate facebook key performance indicator weekly performance of page. It is also available for immediate download and adjustment. So, changes can be made in the color, design, graphics or any other component to create a unique layout.
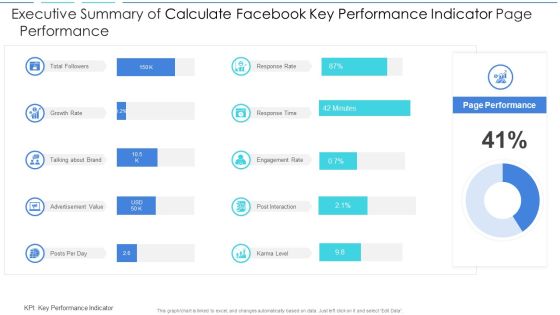
Executive Summary Of Calculate Facebook Key Performance Indicator Page Performance Download PDF
Showcasing this set of slides titled executive summary of calculate facebook key performance indicator page performance download pdf. The topics addressed in these templates are executive summary of calculate facebook key performance indicator page performance. All the content presented in this PPT design is completely editable. Download it and make adjustments in color, background, font etc. as per your unique business setting.
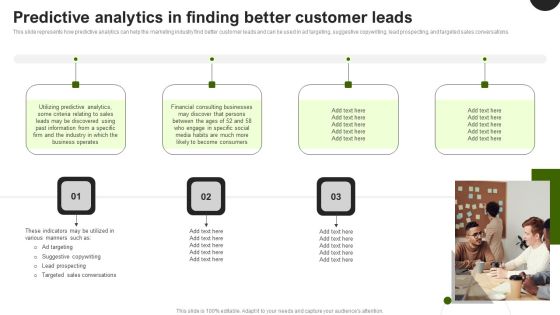
Predictive Analytics In The Age Of Big Data Predictive Analytics In Finding Better Customer Leads Diagrams PDF
This slide represents how predictive analytics can help the marketing industry find better customer leads and can be used in ad targeting, suggestive copywriting, lead prospecting, and targeted sales conversations. Welcome to our selection of the Predictive Analytics In The Age Of Big Data Predictive Analytics In Finding Better Customer Leads Diagrams PDF. These are designed to help you showcase your creativity and bring your sphere to life. Planning and Innovation are essential for any business that is just starting out. This collection contains the designs that you need for your everyday presentations. All of our PowerPoints are 100 percent editable, so you can customize them to suit your needs. This multi purpose template can be used in various situations. Grab these presentation templates today.

Predictive Analytics In The Age Of Big Data How Businesses Use Predictive Analytics Introduction PDF
This slide depicts the importance of predictive analytics that covers detecting fraud, improving operations, optimizing marketing campaigns, and reducing risks. Predictive analytics is being used by businesses to fix complex challenges and identify new possibilities. Do you have to make sure that everyone on your team knows about any specific topic I yes, then you should give Predictive Analytics In The Age Of Big Data How Businesses Use Predictive Analytics Introduction PDF a try. Our experts have put a lot of knowledge and effort into creating this impeccable Predictive Analytics In The Age Of Big Data How Businesses Use Predictive Analytics Introduction PDF. You can use this template for your upcoming presentations, as the slides are perfect to represent even the tiniest detail. You can download these templates from the Slidegeeks website and these are easy to edit. So grab these today.

Predictive Analytics In The Age Of Big Data Predictive Analytics In Government Sector Brochure PDF
This slide depicts the usage of predictive analytics technology in the government sector to improve cybersecurity as they are the main drivers of computer technology growth. The government sector is using predictive analytics for several corporate processes. Explore a selection of the finest Predictive Analytics In The Age Of Big Data Predictive Analytics In Government Sector Brochure PDF here. With a plethora of professionally designed and pre made slide templates, you can quickly and easily find the right one for your upcoming presentation. You can use our Predictive Analytics In The Age Of Big Data Predictive Analytics In Government Sector Brochure PDF to effectively convey your message to a wider audience. Slidegeeks has done a lot of research before preparing these presentation templates. The content can be personalized and the slides are highly editable. Grab templates today from Slidegeeks.

Predictive Analytics In The Age Of Big Data Introduction To Predictive Analytics Workflow Background PDF
This slide represents the predictive analytics workflow that is widely used in managing energy loads in electric grids. It includes accessing and exploring information, pre-processing data, developing predictive models, and integrating analytics with systems. From laying roadmaps to briefing everything in detail, our templates are perfect for you. You can set the stage with your presentation slides. All you have to do is download these easy to edit and customizable templates. Predictive Analytics In The Age Of Big Data Introduction To Predictive Analytics Workflow Background PDF will help you deliver an outstanding performance that everyone would remember and praise you for. Do download this presentation today.

Predictive Analytics In The Age Of Big Data Steps For Predictive Analytics Workflow Application Brochure PDF
This slide represents the steps for predictive analytics workflow application in industries, and it includes accessing and exploring information, pre-processing information, developing predictive models, and integrating analytics with systems. Boost your pitch with our creative Predictive Analytics In The Age Of Big Data Steps For Predictive Analytics Workflow Application Brochure PDF. Deliver an awe-inspiring pitch that will mesmerize everyone. Using these presentation templates you will surely catch everyones attention. You can browse the ppts collection on our website. We have researchers who are experts at creating the right content for the templates. So you do not have to invest time in any additional work. Just grab the template now and use them.

Predictive Analytics In The Age Of Big Data Why Is Predictive Analytics Important Clipart PDF
This slide depicts the importance of predictive analytics in different industries. It includes the rise of big data, using cutting-edge technologies for big data and machine learning to extract meaningful insights and increasing competition. Whether you have daily or monthly meetings, a brilliant presentation is necessary. Predictive Analytics In The Age Of Big Data Why Is Predictive Analytics Important Clipart PDF can be your best option for delivering a presentation. Represent everything in detail using Predictive Analytics In The Age Of Big Data Why Is Predictive Analytics Important Clipart PDF and make yourself stand out in meetings. The template is versatile and follows a structure that will cater to your requirements. All the templates prepared by Slidegeeks are easy to download and edit. Our research experts have taken care of the corporate themes as well. So, give it a try and see the results.

Predictive Analytics In The Age Of Big Data Outliers Model For Predictive Analytics Demonstration PDF
This slide talks about the outliers model used for predictive analytics, including its use cases, impact and algorithm used in it, such as the generalized linear model for two values. This model helps banking, finance, and cyber security organizations to detect fraud and cyber crimes. Whether you have daily or monthly meetings, a brilliant presentation is necessary. Predictive Analytics In The Age Of Big Data Outliers Model For Predictive Analytics Demonstration PDF can be your best option for delivering a presentation. Represent everything in detail using Predictive Analytics In The Age Of Big Data Outliers Model For Predictive Analytics Demonstration PDF and make yourself stand out in meetings. The template is versatile and follows a structure that will cater to your requirements. All the templates prepared by Slidegeeks are easy to download and edit. Our research experts have taken care of the corporate themes as well. So, give it a try and see the results.

Predictive Analytics In The Age Of Big Data Predictive Analytics Clustering Model Overview Formats PDF
This slide represents the overview of the clustering model of predictive analytics covering its two methods such as hard clustering and soft clustering. It also caters to algorithms used in this model, such as K-means, nearest neighbor, and biologically inspired clustering. Crafting an eye catching presentation has never been more straightforward. Let your presentation shine with this tasteful yet straightforward Predictive Analytics In The Age Of Big Data Predictive Analytics Clustering Model Overview Formats PDF template. It offers a minimalistic and classy look that is great for making a statement. The colors have been employed intelligently to add a bit of playfulness while still remaining professional. Construct the ideal Predictive Analytics In The Age Of Big Data Predictive Analytics Clustering Model Overview Formats PDF that effortlessly grabs the attention of your audience. Begin now and be certain to wow your customers.
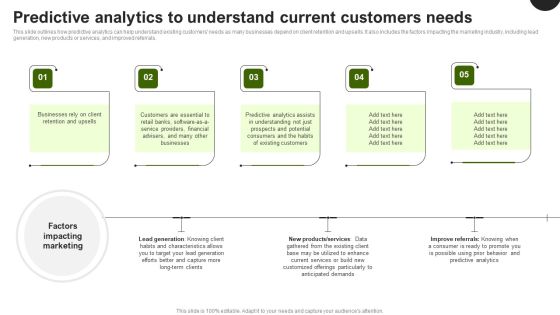
Predictive Analytics In The Age Of Big Data Predictive Analytics To Understand Current Customers Professional PDF
This slide outlines how predictive analytics can help understand existing customers needs as many businesses depend on client retention and upsells. It also includes the factors impacting the marketing industry, including lead generation, new products or services, and improved referrals. Here you can discover an assortment of the finest PowerPoint and Google Slides templates. With these templates, you can create presentations for a variety of purposes while simultaneously providing your audience with an eye catching visual experience. Download Predictive Analytics In The Age Of Big Data Predictive Analytics To Understand Current Customers Professional PDF to deliver an impeccable presentation. These templates will make your job of preparing presentations much quicker, yet still, maintain a high level of quality. Slidegeeks has experienced researchers who prepare these templates and write high quality content for you. Later on, you can personalize the content by editing the Predictive Analytics In The Age Of Big Data Predictive Analytics To Understand Current Customers Professional PDF.

Predictive Analytics In The Age Of Big Data Training Program For Predictive Analytics Model Ideas PDF
This slide represents the training program for the predictive analytics model, and it includes the name of teams, trainer names, modules to be covered in training, and the schedule and venue of the training. Get a simple yet stunning designed Predictive Analytics In The Age Of Big Data Training Program For Predictive Analytics Model Ideas PDF. It is the best one to establish the tone in your meetings. It is an excellent way to make your presentations highly effective. So, download this PPT today from Slidegeeks and see the positive impacts. Our easy to edit Predictive Analytics In The Age Of Big Data Training Program For Predictive Analytics Model Ideas PDF can be your go to option for all upcoming conferences and meetings. So, what are you waiting for Grab this template today.

Strategic Brand Playbook Company Icons Usage Guidelines Brand Strategy Playbook Mockup PDF
This template covers usage guidelines for brand identity icons, used all over the company website and projects. These icons are the essential graphic elements and are one of the most recognized elements of the brand. Slidegeeks is here to make your presentations a breeze with Strategic Brand Playbook Company Icons Usage Guidelines Brand Strategy Playbook Mockup PDF With our easy to use and customizable templates, you can focus on delivering your ideas rather than worrying about formatting. With a variety of designs to choose from, you are sure to find one that suits your needs. And with animations and unique photos, illustrations, and fonts, you can make your presentation pop. So whether you are giving a sales pitch or presenting to the board, make sure to check out Slidegeeks first.

When To Use Spiral Model Phases Of Software Development Procedure Guidelines PDF
This slide represents the situations when the spiral model can be implemented, such as in the case of financial restriction, for medium to high-risk levels projects, and so on.Slidegeeks is here to make your presentations a breeze with When To Use Spiral Model Phases Of Software Development Procedure Guidelines PDF With our easy-to-use and customizable templates, you can focus on delivering your ideas rather than worrying about formatting. With a variety of designs to choose from, you are sure to find one that suits your needs. And with animations and unique photos, illustrations, and fonts, you can make your presentation pop. So whether you Are giving a sales pitch or presenting to the board, make sure to check out Slidegeeks first.
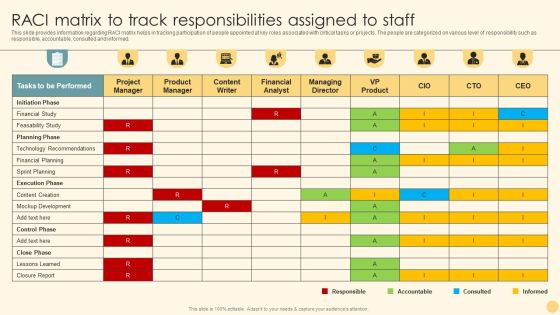
RACI Matrix To Track Responsibilities Assigned To Staff Ppt PowerPoint Presentation File Example File PDF
This slide provides information regarding RACI matrix helps in tracking participation of people appointed at key roles associated with critical tasks or projects. The people are categorized on various level of responsibility such as responsible, accountable, consulted and informed. Slidegeeks is here to make your presentations a breeze with RACI Matrix To Track Responsibilities Assigned To Staff Ppt PowerPoint Presentation File Example File PDF With our easy to use and customizable templates, you can focus on delivering your ideas rather than worrying about formatting. With a variety of designs to choose from, you are sure to find one that suits your needs. And with animations and unique photos, illustrations, and fonts, you can make your presentation pop. So whether you are giving a sales pitch or presenting to the board, make sure to check out Slidegeeks first.

Delivery On Time Principle Of Dynamic System Integration Of Dynamic System To Enhance Processes Icons PDF
This slide explains delivery on time as a principle of DSDM which is based on timely delivery of the project, to create a faith in development team.Slidegeeks is here to make your presentations a breeze with Delivery On Time Principle Of Dynamic System Integration Of Dynamic System To Enhance Processes Icons PDF With our easy to use and customizable templates, you can focus on delivering your ideas rather than worrying about formatting. With a variety of designs to choose from, you are sure to find one that suits your needs. And with animations and unique photos, illustrations, and fonts, you can make your presentation pop. So whether you are giving a sales pitch or presenting to the board, make sure to check out Slidegeeks first.

Website Designing Solutions Company Profile Company History From 2005 To 2022 Themes PDF
This slide covers the company history from 2005 to 2022 which includes achieved milestones such as company incorporation, business expansion, acquisition, partnership, received projects, etc. Slidegeeks is here to make your presentations a breeze with Website Designing Solutions Company Profile Company History From 2005 To 2022 Themes PDF With our easy-to-use and customizable templates, you can focus on delivering your ideas rather than worrying about formatting. With a variety of designs to choose from, youre sure to find one that suits your needs. And with animations and unique photos, illustrations, and fonts, you can make your presentation pop. So whether youre giving a sales pitch or presenting to the board, make sure to check out Slidegeeks first

Credit Risk Management Credit Risk Analysis Related To The Bank Professional PDF
This slide shows the credit risk analysis related to the bank which includes purpose of the credit, borrower contribution, amount raised, business plan and projections, repayment capacity of the borrower, etc. Slidegeeks is here to make your presentations a breeze with Credit Risk Management Credit Risk Analysis Related To The Bank Professional PDF With our easy-to-use and customizable templates, you can focus on delivering your ideas rather than worrying about formatting. With a variety of designs to choose from, youre sure to find one that suits your needs. And with animations and unique photos, illustrations, and fonts, you can make your presentation pop. So whether youre giving a sales pitch or presenting to the board, make sure to check out Slidegeeks first.
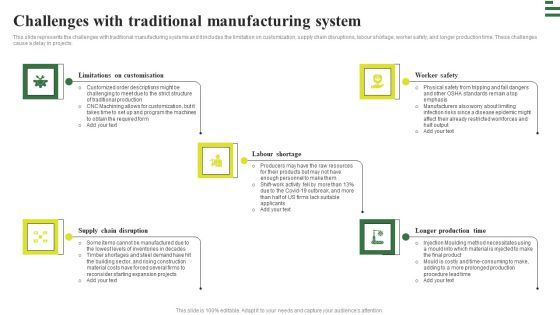
Transforming Manufacturing With Automation Challenges With Traditional Microsoft PDF
This slide represents the challenges with traditional manufacturing systems and it includes the limitation on customization, supply chain disruptions, labour shortage, worker safety, and longer production time. These challenges cause a delay in projects. Slidegeeks is here to make your presentations a breeze with Transforming Manufacturing With Automation Challenges With Traditional Microsoft PDF With our easy to use and customizable templates, you can focus on delivering your ideas rather than worrying about formatting. With a variety of designs to choose from, you are sure to find one that suits your needs. And with animations and unique photos, illustrations, and fonts, you can make your presentation pop. So whether you are giving a sales pitch or presenting to the board, make sure to check out Slidegeeks first.

Predictive Analytics In The Age Of Big Data Roadmap For Predictive Analytics Model Development Ideas PDF
This slide represents the roadmap for predictive analytics model development, including the steps to be performed in the process, such as highlighting and formulating a problem, data preparation, information exploration, transforming and choosing, making, validating, and so on. Find a pre designed and impeccable Predictive Analytics In The Age Of Big Data Roadmap For Predictive Analytics Model Development Ideas PDF. The templates can ace your presentation without additional effort. You can download these easy to edit presentation templates to make your presentation stand out from others. So, what are you waiting for Download the template from Slidegeeks today and give a unique touch to your presentation.

Improve Procurement Supply Chain Risks To Avoid Unnecessary Cost Portrait PDF
This slide provides an overview of the techniques adopted to mitigate the risks of supply chain. Major risks covered are price instability, complex projects, poor supplier performance and inaccurate supply chain forecast. This modern and well arranged Improve Procurement Supply Chain Risks To Avoid Unnecessary Cost Portrait PDF provides lots of creative possibilities. It is very simple to customize and edit with the Powerpoint Software. Just drag and drop your pictures into the shapes. All facets of this template can be edited with Powerpoint no extra software is necessary. Add your own material, put your images in the places assigned for them, adjust the colors, and then you can show your slides to the world, with an animated slide included.
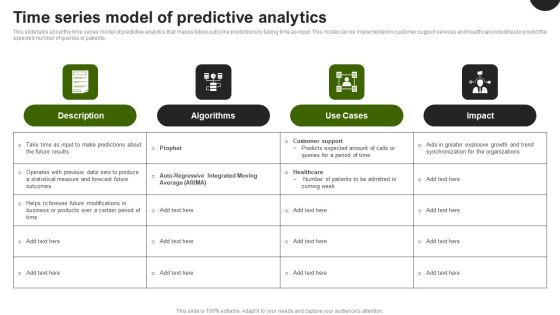
Predictive Analytics In The Age Of Big Data Time Series Model Of Predictive Analytics Topics PDF
This slide talks about the time series model of predictive analytics that makes future outcome predictions by taking time as input. This model can be implemented in customer support services and healthcare industries to predict the expected number of queries or patients. Want to ace your presentation in front of a live audience Our Predictive Analytics In The Age Of Big Data Time Series Model Of Predictive Analytics Topics PDF can help you do that by engaging all the users towards you. Slidegeeks experts have put their efforts and expertise into creating these impeccable powerpoint presentations so that you can communicate your ideas clearly. Moreover, all the templates are customizable, and easy to edit and downloadable. Use these for both personal and commercial use.
Predictive Modeling Process Flow In Logistics Icons PDF
This slide showcases Predictive modeling which enables production and distribution optimization through better throughput, quality and safety. It provides details about historical data, predictive analytics model, forecast visualization, integrated custom analytics, etc. Get a simple yet stunning designed Predictive Modeling Process Flow In Logistics Icons PDF. It is the best one to establish the tone in your meetings. It is an excellent way to make your presentations highly effective. So, download this PPT today from Slidegeeks and see the positive impacts. Our easy-to-edit Predictive Modeling Process Flow In Logistics Icons PDF can be your go-to option for all upcoming conferences and meetings. So, what are you waiting for Grab this template today.
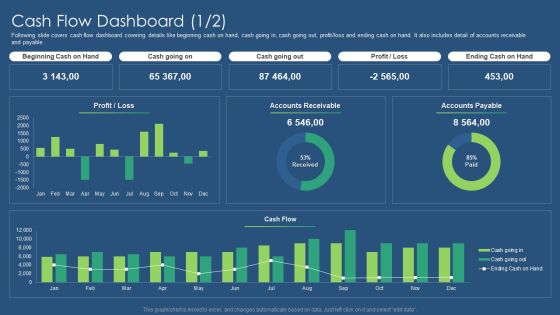
Sustainability Calculation With KPI Cash Flow Dashboard Cash Designs PDF Rules PDF
Deliver an awe inspiring pitch with this creative sustainability calculation with kpi customer satisfaction dashboard target professional pdf bundle. Topics like customer satisfaction dashboard can be discussed with this completely editable template. It is available for immediate download depending on the needs and requirements of the user.
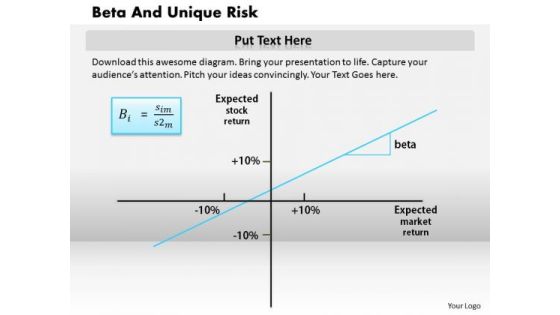
Business Framework Beta And Unique Risk PowerPoint Presentation 2
Define the concept of calculating risk of market with this power point diagram slide. This slide contains the graphic of X-Y chart with four different sections. Define the price and finance risk with beta factor, define this factor in your financial presentation and display the clear picture of risk.
Sustainability Calculation With KPI Customer Churn Rate Dashboard Mockup PDF Mockup PDF
Mentioned slide covers cash flow dashboard. It shows detailed cash flow status in a 12 months format and working capital with accounts receivable and payable details. Deliver and pitch your topic in the best possible manner with this sustainability calculation with kpi cash flow dashboard liquidity ratio inspiration pdf. Use them to share invaluable insights on cash flow dashboard and impress your audience. This template can be altered and modified as per your expectations. So, grab it now.

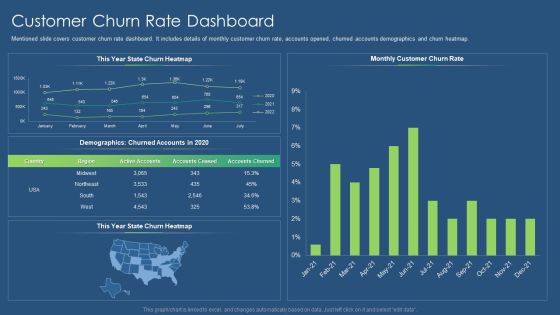
Sustainability Calculation With KPI Customer Lifetime Value Dashboard Formats PDF Professional PDF
Mentioned slide covers customer churn rate dashboard. It includes details of monthly customer churn rate, accounts opened, churned accounts demographics and churn heatmap. Deliver an awe inspiring pitch with this creative sustainability calculation with kpi customer churn rate dashboard mockup pdf bundle. Topics like customer churn rate dashboard can be discussed with this completely editable template. It is available for immediate download depending on the needs and requirements of the user.
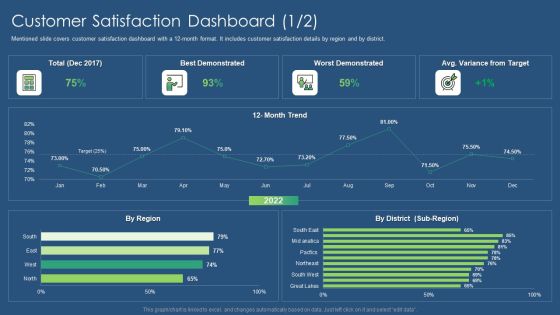
Sustainability Calculation With KPI Customer Satisfaction Dashboard Target Professional PDF Structure PDF
This slide covers customer lifetime value dashboard. It covers details of average customer lifetime and average lifetime value in a 12 months format. Deliver and pitch your topic in the best possible manner with this sustainability calculation with kpi customer lifetime value dashboard formats pdf. Use them to share invaluable insights on customer lifetime value dashboard and impress your audience. This template can be altered and modified as per your expectations. So, grab it now.
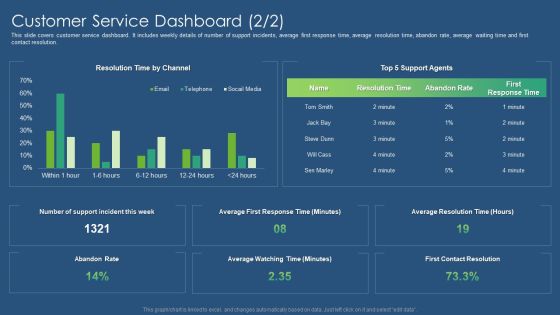
Sustainability Calculation With KPI Customer Service Dashboard Microsoft PDF Slides PDF
This slide covers customer service dashboard. It includes weekly details of number of support incidents, average first response time, average resolution time, abandon rate, average waiting time and first contact resolution. Deliver an awe inspiring pitch with this creative sustainability calculation with kpi customer service dashboard revenue ideas pdf bundle. Topics like customer service dashboard can be discussed with this completely editable template. It is available for immediate download depending on the needs and requirements of the user.
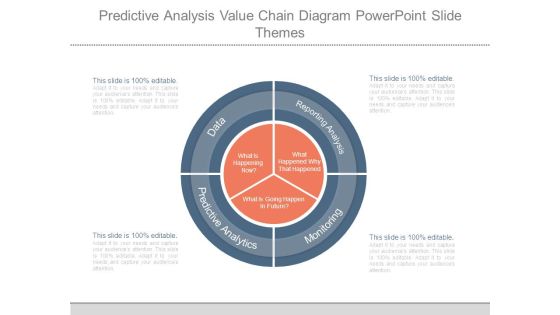
Predictive Analysis Value Chain Diagram Powerpoint Slide Themes
This is a predictive analysis value chain diagram powerpoint slide themes. This is a four stage process. The stages in this process are what is happening now, what is going happen in future, what happened why that happened, data, predictive analytics, reporting analysis, monitoring.

Financial Kpi Dashboard To Measure Brand Performance Brand Value Estimation Guide Inspiration PDF
Mentioned slide showcases KPI dashboard that can be used to check the financial performance of a brand. Metrics covered in the dashboard are return on assets, working capital ratio, return on equity etc.Are you in need of a template that can accommodate all of your creative concepts This one is crafted professionally and can be altered to fit any style. Use it with Google Slides or PowerPoint. Include striking photographs, symbols, depictions, and other visuals. Fill, move around, or remove text boxes as desired. Test out color palettes and font mixtures. Edit and save your work, or work with colleagues. Download Financial Kpi Dashboard To Measure Brand Performance Brand Value Estimation Guide Inspiration PDF and observe how to make your presentation outstanding. Give an impeccable presentation to your group and make your presentation unforgettable.

Guide To Develop And Estimate Brand Value Financial KPI Dashboard To Measure Brand Performance Formats PDF
Mentioned slide showcases KPI dashboard that can be used to check the financial performance of a brand. Metrics covered in the dashboard are return on assets, working capital ratio, return on equity etc.Coming up with a presentation necessitates that the majority of the effort goes into the content and the message you intend to convey. The visuals of a PowerPoint presentation can only be effective if it supplements and supports the story that is being told. Keeping this in mind our experts created Guide To Develop And Estimate Brand Value Financial KPI Dashboard To Measure Brand Performance Formats PDF to reduce the time that goes into designing the presentation. This way, you can concentrate on the message while our designers take care of providing you with the right template for the situation.
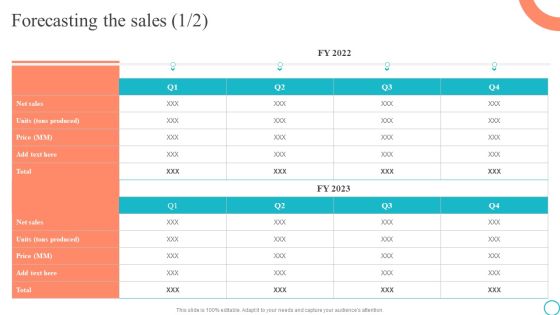
Forecasting The Sales Marketing Tactics To Enhance Business Elements PDF
This modern and well-arranged Forecasting The Sales Marketing Tactics To Enhance Business Elements PDF provides lots of creative possibilities. It is very simple to customize and edit with the Powerpoint Software. Just drag and drop your pictures into the shapes. All facets of this template can be edited with Powerpoint no extra software is necessary. Add your own material, put your images in the places assigned for them, adjust the colors, and then you can show your slides to the world, with an animated slide included.
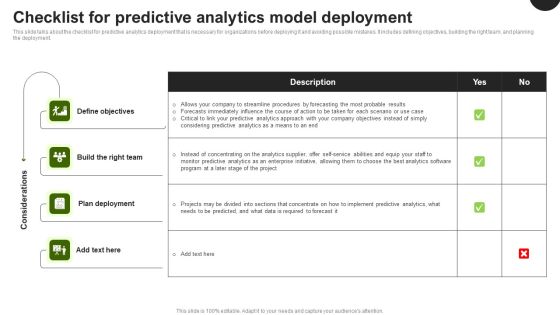
Predictive Analytics In The Age Of Big Data Checklist For Predictive Analytics Model Deployment Clipart PDF
This slide talks about the checklist for predictive analytics deployment that is necessary for organizations before deploying it and avoiding possible mistakes. It includes defining objectives, building the right team, and planning the deployment. Slidegeeks is one of the best resources for PowerPoint templates. You can download easily and regulate Predictive Analytics In The Age Of Big Data Checklist For Predictive Analytics Model Deployment Clipart PDF for your personal presentations from our wonderful collection. A few clicks is all it takes to discover and get the most relevant and appropriate templates. Use our Templates to add a unique zing and appeal to your presentation and meetings. All the slides are easy to edit and you can use them even for advertisement purposes.
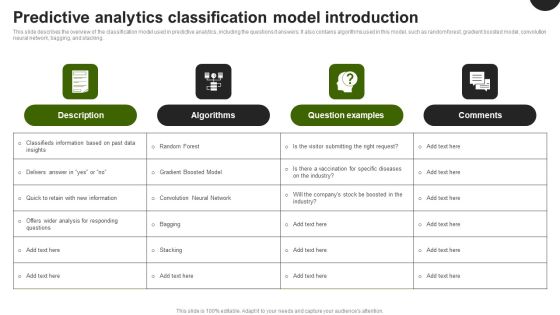
Predictive Analytics In The Age Of Big Data Predictive Analytics Classification Model Introduction Brochure PDF
This slide describes the overview of the classification model used in predictive analytics, including the questions it answers. It also contains algorithms used in this model, such as random forest, gradient boosted model, convolution neural network, bagging, and stacking. Are you in need of a template that can accommodate all of your creative concepts This one is crafted professionally and can be altered to fit any style. Use it with Google Slides or PowerPoint. Include striking photographs, symbols, depictions, and other visuals. Fill, move around, or remove text boxes as desired. Test out color palettes and font mixtures. Edit and save your work, or work with colleagues. Download Predictive Analytics In The Age Of Big Data Predictive Analytics Classification Model Introduction Brochure PDF and observe how to make your presentation outstanding. Give an impeccable presentation to your group and make your presentation unforgettable.

Predictive Analytics In The Age Of Big Data Predictive Analytics Vs Machine Learning Slides PDF
This slide represents the comparison between predictive analytics and machine learning based on technology used and built on, the functionality of the model, and requirements for the development of the models. This Predictive Analytics In The Age Of Big Data Predictive Analytics Vs Machine Learning Slides PDF from Slidegeeks makes it easy to present information on your topic with precision. It provides customization options, so you can make changes to the colors, design, graphics, or any other component to create a unique layout. It is also available for immediate download, so you can begin using it right away. Slidegeeks has done good research to ensure that you have everything you need to make your presentation stand out. Make a name out there for a brilliant performance.

Advanced Predictive Analytics And Machine Learning Concept
This is a advanced predictive analytics and machine learning concept. This is a nine stage process. The stages in this process are demographics, orders, products, visits channels, social media sentiment, customer data, orzota predictive analytics, customer knowledge, improve conversion, targeted marketing, better customer satisfaction, increased sales.

Sustainability Calculation With KPI Profit Margin Measuring Kpi Dashboard Inspiration PDF Topics PDF
Following slide illustrates profit margin dashboard with a 12 months format. It also includes gross profit margin, operating profit margin and net profit margin. Deliver and pitch your topic in the best possible manner with this sustainability calculation with kpi profit margin measuring kpi dashboard inspiration pdf. Use them to share invaluable insights on net profit margin, operating profit margin, gross profit margin and impress your audience. This template can be altered and modified as per your expectations. So, grab it now.
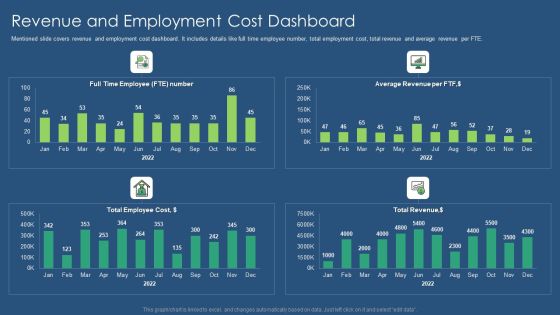
Sustainability Calculation With KPI Revenue And Employment Cost Dashboard Introduction PDF Professional PDF
Mentioned slide covers revenue and employment cost dashboard. It includes details like full time employee number, total employment cost, total revenue and average revenue per FTE. Deliver an awe inspiring pitch with this creative sustainability calculation with kpi revenue and employment cost dashboard introduction pdf bundle. Topics like full time employee, employee cost, revenue can be discussed with this completely editable template. It is available for immediate download depending on the needs and requirements of the user.

Enterprise Sustainability Performance Metrics Real Time Utilization Dashboard Portrait PDF
This slide covers real time utilization dashboard covering logged time such as billable, non-billable, estimated time and scheduled. It also include details of allotted hours to each employee and weekly hours for the assignment.Deliver and pitch your topic in the best possible manner with this Enterprise Sustainability Performance Metrics Real Time Utilization Dashboard Portrait PDF. Use them to share invaluable insights on Real Time, Utilization Dashboard and impress your audience. This template can be altered and modified as per your expectations. So, grab it now.

Sustainability Calculation With KPI Employee Billable Hours Dashboard Demonstration PDF Portrait PDF
Following slide shows employee billable hours dashboard covering total hours capacity, allocated hours billable, total hours worked, and total billable hours worked for the assignment. It also includes details of each team member indulged for same assignment. Deliver an awe inspiring pitch with this creative sustainability calculation with kpi employee billable hours dashboard demonstration pdf bundle. Topics like employee billable hours dashboard can be discussed with this completely editable template. It is available for immediate download depending on the needs and requirements of the user.

Colorful Puzzle Linear Flow It Business Requirements PowerPoint Slides
We present our colorful puzzle linear flow it business requirements PowerPoint Slides.Use our Success PowerPoint Templates because, The success of your venture depends on the performance of every team member. Use our Puzzles or Jigsaws PowerPoint Templates because,Your business and plans for its growth consist of processes that are highly co-related. Use our Shapes PowerPoint Templates because,You must Evolve the strategy to take you down the required path with appropriate, efficient and effective marketing along the way. Use our Business PowerPoint Templates because,Project your ideas to you colleagues and complete the full picture Use our Metaphors-Visual Concepts PowerPoint Templates because,the gears of youthful minds are useful, therefore set them in motion.Use these PowerPoint slides for presentations relating to Assembly, complete, concept, copy, finish, finished, fit, idea, interlock, jigsaw, match, metaphor, mystery, outline, patience, picture, piece, play, playing, point, pointing, problem, puzzle, quiz, skill, solution, solved, space, struggle, success, support, teamwork. The prominent colors used in the PowerPoint template are Purple, Gray, Black

Concept Of Mystery Using 5 Puzzles Creating Flow Chart PowerPoint Slides
We present our concept of mystery using 5 puzzles creating flow chart PowerPoint Slides.Use our Success PowerPoint Templates because, The success of your venture depends on the performance of every team member. Use our Puzzles or Jigsaws PowerPoint Templates because,There are various viable propositions available to further your commercial interests. Use our Arrows PowerPoint Templates because,They will Amplify your views and plans for getting ahead and then the manner in which you intend staying ahead. Use our Business PowerPoint Templates because,Project your ideas to you colleagues and complete the full picture Use our Metaphors-Visual Concepts PowerPoint Templates because,your group can behave steady in the top bracket.Use these PowerPoint slides for presentations relating to Areows, Business, Assembly, complete, concept, copy, finish, finished, fit, idea, interlock, jigsaw, match, metaphor, mystery, outline, patience, picture, piece, play, playing, point, pointing, problem, puzzle, quiz, skill, solution, solved, space, struggle, success, support, teamwork. The prominent colors used in the PowerPoint template are Yellow, Gray, White

Strategies For Flipping Houses For Maximum Revenue Fund Allocation For Essential House Flipping Stages Formats PDF
This slide represents budget allocation for financing major phases of house flipping project. It covers suppliers, location, licensing, insurance, utilities etc. This modern and well arranged Strategies For Flipping Houses For Maximum Revenue Fund Allocation For Essential House Flipping Stages Formats PDF provides lots of creative possibilities. It is very simple to customize and edit with the Powerpoint Software. Just drag and drop your pictures into the shapes. All facets of this template can be edited with Powerpoint no extra software is necessary. Add your own material, put your images in the places assigned for them, adjust the colors, and then you can show your slides to the world, with an animated slide included.
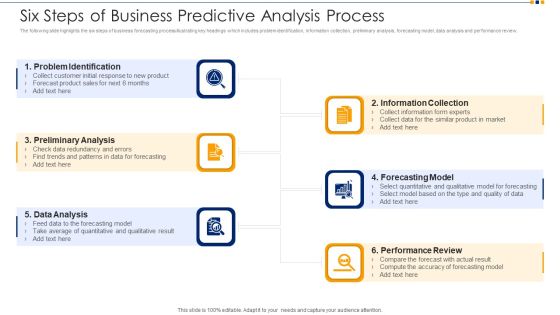
Six Steps Of Business Predictive Analysis Process Ppt Gallery Graphics Template PDF
The following slide highlights the six steps of business forecasting process illustrating key headings which includes problem identification, information collection, preliminary analysis, forecasting model, data analysis and performance review. Persuade your audience using this six steps of business predictive analysis process ppt gallery graphics template pdf. This PPT design covers six stages, thus making it a great tool to use. It also caters to a variety of topics including problem identification, preliminary analysis, data analysis, information collection, forecasting model, performance review. Download this PPT design now to present a convincing pitch that not only emphasizes the topic but also showcases your presentation skills.
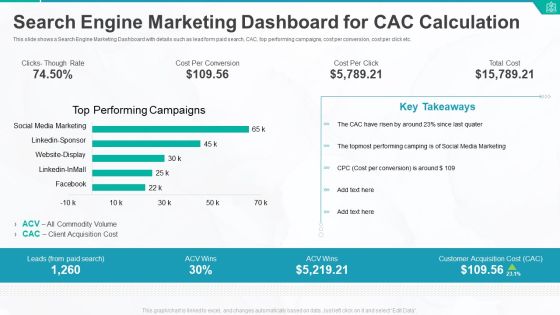
Search Engine Marketing Dashboard For CAC Calculation Ppt Styles Portrait PDF
This slide shows a Search Engine Marketing Dashboard with details such as lead form paid search, CAC, top performing campaigns, cost per conversion, cost per click etc. Deliver and pitch your topic in the best possible manner with this search engine marketing dashboard for cac calculation ppt styles portrait pdf. Use them to share invaluable insights on cost per conversion, cost per click, key takeaways, performing campaigns, client acquisition cost and impress your audience. This template can be altered and modified as per your expectations. So, grab it now.

Client Acquisition Cost For Customer Retention Search Engine Marketing Dashboard For CAC Calculation Infographics PDF
This slide shows a Search Engine Marketing Dashboard with details such as lead form paid search, CAC, top performing campaigns, cost per conversion, cost per click etc. Deliver an awe inspiring pitch with this creative client acquisition cost for customer retention search engine marketing dashboard for cac calculation infographics pdf bundle. Topics like performing, campaign, social media, marketing, customer acquisition cost can be discussed with this completely editable template. It is available for immediate download depending on the needs and requirements of the user.

Sustainability Calculation With KPI Cash Flow Dashboard Liquidity Ratio Inspiration PDF Introduction PDF
Following slide covers cash flow dashboard covering details like beginning cash on hand, cash going in, cash going out, profit loss and ending cash on hand. It also includes detail of accounts receivable and payable. Deliver an awe inspiring pitch with this creative sustainability calculation with kpi cash flow dashboard cash designs pdf bundle. Topics like beginning cash on hand, cash going out, profit and loss, ending cash on hand can be discussed with this completely editable template. It is available for immediate download depending on the needs and requirements of the user.

Sustainability Calculation With KPI Customer Service Dashboard Revenue Ideas PDF Graphics PDF
Following slide illustrates customer service dashboard covering details such as request answered, total requests, total revenue and support cost revenue. It also includes customer satisfaction score, customer retention in a 12 months format. Deliver and pitch your topic in the best possible manner with this sustainability calculation with kpi customer service dashboard microsoft pdf. Use them to share invaluable insights on customer satisfaction, revenue, customer retention and impress your audience. This template can be altered and modified as per your expectations. So, grab it now.

Customer Retention Based Success KPIS Dashboard Ppt PowerPoint Presentation Slides Graphics Pictures PDF
This slide covers dashboard for estimation of customer retention based success metrics. It includes KPIs such as net retention rates including expansion, contractions, net MRR, cancelled accounts, etc. Showcasing this set of slides titled Customer Retention Based Success KPIS Dashboard Ppt PowerPoint Presentation Slides Graphics Pictures PDF. The topics addressed in these templates are Account Retention, Cancelled Accounts, Retention Components. All the content presented in this PPT design is completely editable. Download it and make adjustments in color, background, font etc. as per your unique business setting.

Customer Retention With Email Advertising Campaign Plan Forecasted Impact Of Email Marketing On Business Designs PDF
Following slide demonstrates predicted impact of email marketing strategy on organisation performance which can be used to improve business profitability. It includes key performance indicators such as website traffic, customer engagement rate, customer conversion rate, retention rate, and per-customer acquisition cost. Crafting an eye catching presentation has never been more straightforward. Let your presentation shine with this tasteful yet straightforward Customer Retention With Email Advertising Campaign Plan Forecasted Impact Of Email Marketing On Business Designs PDF template. It offers a minimalistic and classy look that is great for making a statement. The colors have been employed intelligently to add a bit of playfulness while still remaining professional. Construct the ideal Customer Retention With Email Advertising Campaign Plan Forecasted Impact Of Email Marketing On Business Designs PDF that effortlessly grabs the attention of your audience. Begin now and be certain to wow your customers.

Economic Facts And Insights Analysis Dashboard Ppt PowerPoint Presentation Inspiration Slide Download PDF
Showcasing this set of slides titled economic facts and insights analysis dashboard ppt powerpoint presentation inspiration slide download pdf. The topics addressed in these templates are current working capital, cash conversion cycle in days last, current quick stats, vendor payment error rate last, 12 months currnet budget variance. All the content presented in this PPT design is completely editable. Download it and make adjustments in color, background, font etc. as per your unique business setting.
Stock Photo Business Strategy Model Use Calculator With Pencil Photos
Delight Them With Our stock photo business strategy model use calculator with pencil stock photo photos Powerpoint Templates. Your Audience Will Be Ecstatic. Our education Powerpoint Templates Are Created Cost Effective. They Understand The Need For Economy.
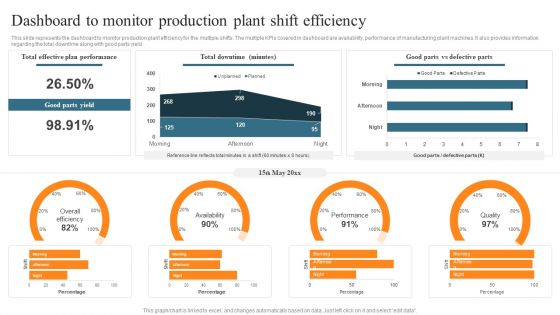
Leveraging Predictive Maintenance To Enhance Production Process Dashboard To Monitor Production Plant Shift Efficiency Structure PDF
This slide represents the dashboard to monitor production plant efficiency for the multiple shifts. The multiple KPIs covered in dashboard are availability, performance of manufacturing plant machines. It also provides information regarding the total downtime along with good parts yield. There are so many reasons you need a Leveraging Predictive Maintenance To Enhance Production Process Dashboard To Monitor Production Plant Shift Efficiency Structure PDF. The first reason is you cant spend time making everything from scratch, Thus, Slidegeeks has made presentation templates for you too. You can easily download these templates from our website easily.

Usa Ppt Background Logical Model Using 4 Rectangular Arrows 2 Graphic
We present our USA PPT Background Logical model using 4 rectangular arrows 2 Graphic. Use our Arrows PowerPoint Templates because; they help to focus the thoughts of your listeners. Use our Symbol PowerPoint Templates because, Business ethics is an essential element in your growth. Use our Business PowerPoint Templates because, Team Efforts Business Template:- The concept and strategy is your strength. Use our Shapes PowerPoint Templates because; Give them an overview of your capability and insight into the minute details of the overall picture highlighting the interdependence at every operational level. Use our Process and Flows PowerPoint Templates because; illustrate these thoughts with this slide. Use these PowerPoint slides for presentations relating to 3d, arrow, background, bullet, business, chart, checkmark, chevron, diagram, eps10, financial, graphic, gray, icon, illustration, isometric, management, point, process, project, reflection, set, shadow, silver, stage, text, transparency, vector, white. The prominent colors used in the PowerPoint template are Red, Gray, and Black
Ppt Theme Two State Diagram Of Commerce Procedure Time Management PowerPoint 2 Image
We present our PPT Theme two state diagram of commerce Procedure time management power point 2 Image. Use our Arrows PowerPoint Templates because; you have the entire picture in mind. Use our Business PowerPoint Templates because, Marketing Strategy Business Template: - Maximizing sales of your product is the intended destination. Use our Shapes PowerPoint Templates because, the alphabetical order is a time honored concept. Use our Finance PowerPoint Templates because, It is also a time to bond with family, friends, colleagues and any other group of your choice. Use our Process and Flows PowerPoint Templates because; Use this template to explain the value of its wellness to human life. Use these PowerPoint slides for presentations relating to 3d, arrow, background, bullet, business, chart, checkmark, chevron, diagram, drop, eps10, financial, five, glass, graphic, gray, icon, illustration, management, point, process, project, reflection, set, shadow, stage, text, transparency, vector, white. The prominent colors used in the PowerPoint template are Blue, Gray, and Black

Arrow With Word Business PowerPoint Templates Ppt Background For Slides 1112
We present our Arrow With Word Business PowerPoint Templates PPT Background For Slides 1112.Use our Signs PowerPoint Templates because, With the help of our Slides you can Illustrate these thoughts with this slide. Use our Business PowerPoint Templates because,Project your ideas to you colleagues and complete the full picture Use our Success PowerPoint Templates because,The choices you make today will determine the future growth of your enterprise. Use our Shapes PowerPoint Templates because,you can put it up there for all to see. Use our Arrows PowerPoint Templates because,They will Amplify your plans to have dedicated sub groups working on related but distinct tasks.Use these PowerPoint slides for presentations relating to Arrow with word business, arrows, shapes, success, business, signs. The prominent colors used in the PowerPoint template are Yellow, Green, Gray

Puzzle Linear Flow Process 8 Stages PowerPoint Transformer Templates
We present our puzzle linear flow process 8 stages PowerPoint transformer templates.Use our Business PowerPoint Templates because,Project your ideas to you colleagues and complete the full picture Use our Puzzles or Jigsaws PowerPoint Templates because,Using our templates for your colleagues will impart knowledge tofeed. Use our Communication PowerPoint Templates because,Your business and plans for its growth consist of processes that are highly co-related. Use our Shapes PowerPoint Templates because,There are so many different pieces to the puzzle. Use our Success PowerPoint Templates because,You know that the core of any organisation is the people who work for it.Use these PowerPoint slides for presentations relating to abstract, action, attach, box, business, center, chain, chart, communication, concept, connection, cube, cycle, data, diagram, flow, horizontal, illustration, individual, interaction, jigsaw, join, link, merge, puzzle, relation, relationship, search, shape, silhouette, success. The prominent colors used in the PowerPoint template are Purple, White, Gray
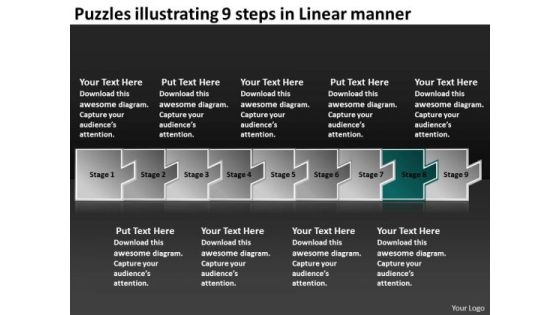
Puzzles Illustrating 9 Steps Linear Manner Flow Charting PowerPoint Templates
We present our puzzles illustrating 9 steps linear manner flow charting PowerPoint templates.Use our Business PowerPoint Templates because,Project your ideas to you colleagues and complete the full picture Use our Design PowerPoint Templates because, This is Aesthetically designed to make a great first impression this template highlights . Use our Marketing PowerPoint Templates because,It demonstrates the seeds of many of our successes. Use our Shapes PowerPoint Templates because, You are going along well but your foresight shows that it may need a slight change in plans or direction. Use our Metaphor PowerPoint Templates because,Readymade PowerPoint templates can prove best of your knowledge for your slides to show.Use these PowerPoint slides for presentations relating to abstract, arrow, arrows, business, chart, design, development, diagram, direction, element, flow, flowchart, graph, linear, management, model, motion, organization, plan, process, program, section, segment, set, sign, solution, strategy, symbol, technology. The prominent colors used in the PowerPoint template are Blue, White, Gray

Decentralization App Development Process Of Dapp Development Infographics PDF
This slide represents the five stages of DApp development which includes defining the environment, setting up the project, coding the app, deploying and testing, and finally launching the app. This modern and well arranged Decentralization App Development Process Of Dapp Development Infographics PDF provides lots of creative possibilities. It is very simple to customize and edit with the Powerpoint Software. Just drag and drop your pictures into the shapes. All facets of this template can be edited with Powerpoint no extra software is necessary. Add your own material, put your images in the places assigned for them, adjust the colors, and then you can show your slides to the world, with an animated slide included.
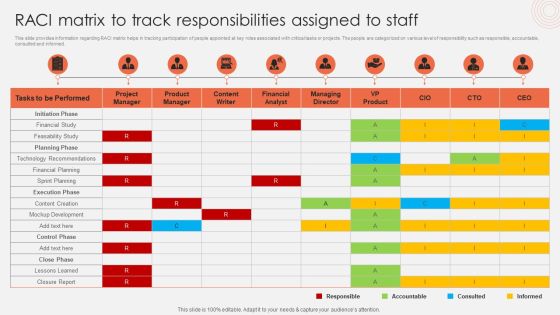
Raci Matrix To Track Responsibilities Assigned To Staff Slides PDF
This slide provides information regarding RACI matrix helps in tracking participation of people appointed at key roles associated with critical tasks or projects. The people are categorized on various level of responsibility such as responsible, accountable, consulted and informed. This modern and well arranged Raci Matrix To Track Responsibilities Assigned To Staff Slides PDF provides lots of creative possibilities. It is very simple to customize and edit with the Powerpoint Software. Just drag and drop your pictures into the shapes. All facets of this template can be edited with Powerpoint no extra software is necessary. Add your own material, put your images in the places assigned for them, adjust the colors, and then you can show your slides to the world, with an animated slide included.
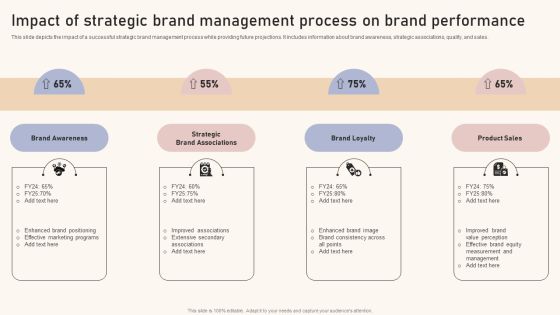
Optimizing Brand Equity Through Strategic Management Impact Of Strategic Brand Management Process Infographics PDF
This slide depicts the impact of a successful strategic brand management process while providing future projections. It includes information about brand awareness, strategic associations, quality, and sales. This modern and well-arranged Optimizing Brand Equity Through Strategic Management Impact Of Strategic Brand Management Process Infographics PDF provides lots of creative possibilities. It is very simple to customize and edit with the Powerpoint Software. Just drag and drop your pictures into the shapes. All facets of this template can be edited with Powerpoint, no extra software is necessary. Add your own material, put your images in the places assigned for them, adjust the colors, and then you can show your slides to the world, with an animated slide included.

CRM System Deployment Plan CRM Dashboard For Tracking Sales Pipeline Pictures PDF
This slide covers the CRM KPI dashboard for monitoring lead status in the sales funnel. It includes metrics such as open pipeline value, open pipeline by product package, pipeline value forecast, etc. Deliver an awe inspiring pitch with this creative CRM System Deployment Plan CRM Dashboard For Tracking Sales Pipeline Pictures PDF bundle. Topics like Pipeline Value Forecast, Open Pipeline Value, Branding can be discussed with this completely editable template. It is available for immediate download depending on the needs and requirements of the user.
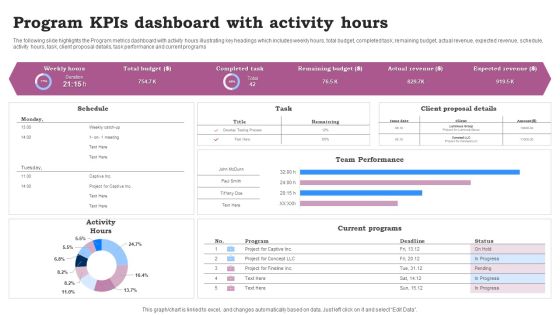
Program Kpis Dashboard With Activity Hours Ppt Infographics Clipart Images PDF
The following slide highlights the Program metrics dashboard with activity hours illustrating key headings which includes weekly hours, total budget, completed task, remaining budget, actual revenue, expected revenue, schedule, activity hours, task, client proposal details, task performance and current programs. Pitch your topic with ease and precision using this Program Kpis Dashboard With Activity Hours Ppt Infographics Clipart Images PDF. This layout presents information on Team Performance, Current Programs, Activity Hours. It is also available for immediate download and adjustment. So, changes can be made in the color, design, graphics or any other component to create a unique layout.
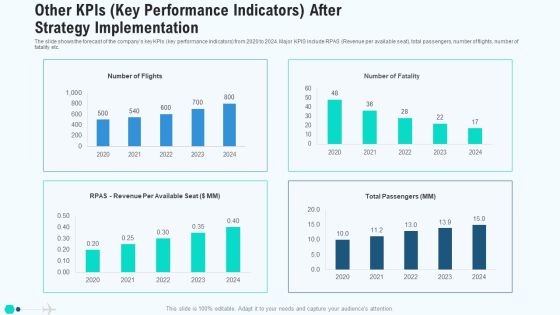
Other Kpis Key Performance Indicators After Strategy Implementation Mockup PDF
The slide shows the forecast of the companys key KPIs key performance indicators from 2020 to 2024. Major KPIS include RPAS Revenue per available seat, total passengers, number of flights, number of fatality etc. Deliver and pitch your topic in the best possible manner with this other kpis key performance indicators after strategy implementation mockup pdf. Use them to share invaluable insights on other kpis key performance indicators after strategy implementation and impress your audience. This template can be altered and modified as per your expectations. So, grab it now.
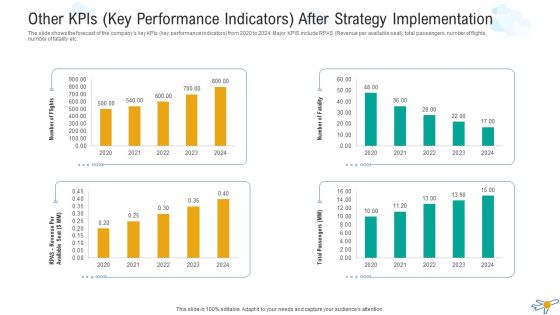
Other Kpis Key Performance Indicators After Strategy Implementation Microsoft PDF
The slide shows the forecast of the companys key KPIs key performance indicators from 2020 to 2024. Major KPIS include RPAS Revenue per available seat, total passengers, number of flights, number of fatality etc. Deliver and pitch your topic in the best possible manner with this other kpis key performance indicators after strategy implementation microsoft pdf. Use them to share invaluable insights on other kpis key performance indicators after strategy implementation and impress your audience. This template can be altered and modified as per your expectations. So, grab it now.

Other Kpis Key Performance Indicators After Strategy Implementation Infographics PDF
The slide shows the forecast of the companys key KPIs key performance indicators from 2020 to 2024. Major KPIS include RPAS Revenue per available seat, total passengers, number of flights, number of fatality etc. Deliver and pitch your topic in the best possible manner with this other kpis key performance indicators after strategy implementation infographics pdf. Use them to share invaluable insights on other kpis key performance indicators after strategy implementation and impress your audience. This template can be altered and modified as per your expectations. So, grab it now.

Predictive Data Model Time Series Model Of Predictive Analytics Infographics PDF
This slide talks about the time series model of predictive analytics that makes future outcome predictions by taking time as input. This model can be implemented in customer support services and healthcare industries to predict the expected number of queries or patients. Slidegeeks is here to make your presentations a breeze with Predictive Data Model Time Series Model Of Predictive Analytics Infographics PDF With our easy-to-use and customizable templates, you can focus on delivering your ideas rather than worrying about formatting. With a variety of designs to choose from, you are sure to find one that suits your needs. And with animations and unique photos, illustrations, and fonts, you can make your presentation pop. So whether you are giving a sales pitch or presenting to the board, make sure to check out Slidegeeks first
Employee Engagement Tools To Predict HR Attrition Elements PDF
Following slide provides the employee engagement tools which can be incorporated in company dashboard in order to track employee behavior. The tools covered are employee mood score, engagement trends, topic analysis, action planning and trend forecasting. Persuade your audience using this Employee Engagement Tools To Predict HR Attrition Elements PDF. This PPT design covers five stages, thus making it a great tool to use. It also caters to a variety of topics including Employee Mood Score, Engagement Trends, Topic Analysis. Download this PPT design now to present a convincing pitch that not only emphasizes the topic but also showcases your presentation skills.

Stock Photo Business Strategy Consulting Calculator With Piggy Bank Photos
Double Up Our stock photo business strategy consulting calculator with piggy bank stock photo photos Powerpoint Templates With Your Thoughts. They Will Make An Awesome Pair. When In Doubt Use Our finance Powerpoint Templates. The Way Ahead Will Become Crystal Clear.

Key Steps In Financial Planning Process Ppt Slide Show
This is a key steps in financial planning process ppt slide show. This is a six stage process. The stages in this process are review and report, implement the plan, create and present solution in a plan, define the relationship, gather data and agree goals, analysis and evaluation, the financial planning process.
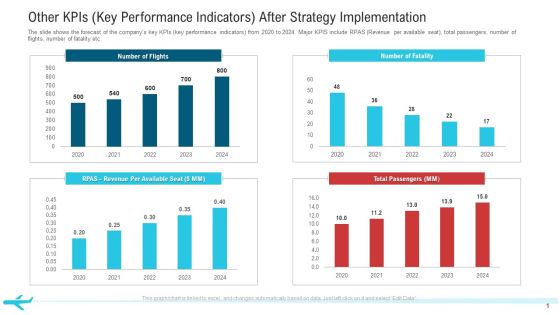
Other Kpis Key Performance Indicators After Strategy Implementation Professional PDF
The slide shows the forecast of the companys key KPIs key performance indicators from 2020 to 2024. Major KPIS include RPAS Revenue per available seat, total passengers, number of flights, number of fatality etc.Deliver and pitch your topic in the best possible manner with this other KPIs key performance indicators after strategy implementation professional pdf. Use them to share invaluable insights on total passengers, number of flights, 2020 to 2024 and impress your audience. This template can be altered and modified as per your expectations. So, grab it now.
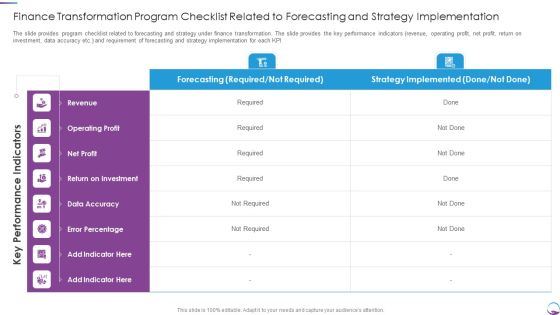
Finance Transformation Program Checklist Related To Forecasting And Strategy Implementation Pictures PDF
The slide provides program checklist related to forecasting and strategy under finance transformation. The slide provides the key performance indicators revenue, operating profit, net profit, return on investment, data accuracy etc. and requirement of forecasting and strategy implementation for each KPI. Deliver and pitch your topic in the best possible manner with this Finance Transformation Program Checklist Related To Forecasting And Strategy Implementation Pictures PDF. Use them to share invaluable insights on Finance Transformation Program Checklist Related To Forecasting And Strategy Implementation and impress your audience. This template can be altered and modified as per your expectations. So, grab it now.

Financial Forecast After Process Improvement Develop Organizational Productivity By Enhancing Business Process Brochure PDF
The slide provides the financial forecast of the company after the process improvement. Major KPIs key performance indicators covered in the slide are total revenue, interest income, number of customers, customer churn rate, online banking users, customer satisfaction rate etc. Deliver an awe inspiring pitch with this creative financial forecast after process improvement develop organizational productivity by enhancing business process brochure pdf bundle. Topics like revenue, interest income, performance indicator, actual, target can be discussed with this completely editable template. It is available for immediate download depending on the needs and requirements of the user.
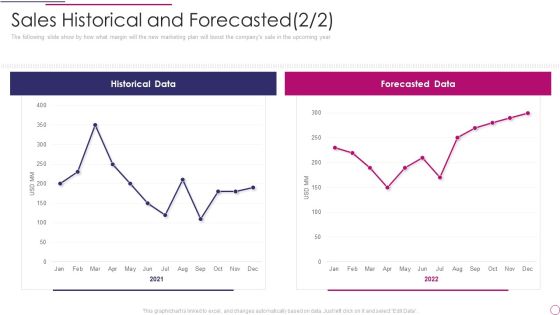
Performance Analysis Of New Product Development Sales Historical And Forecasted Data Rules PDF
The following slide show by how what margin will the new marketing plan will boost the companys sale in the upcoming year. Deliver and pitch your topic in the best possible manner with this performance analysis of new product development sales historical and forecasted data rules pdf. Use them to share invaluable insights on historical data, forecasted data and impress your audience. This template can be altered and modified as per your expectations. So, grab it now.
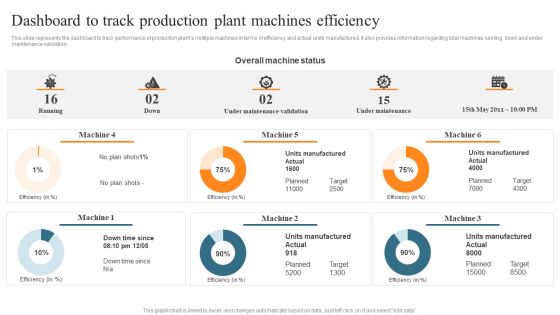
Leveraging Predictive Maintenance To Enhance Production Process Dashboard To Track Production Plant Machines Efficiency Template PDF
Do you have to make sure that everyone on your team knows about any specific topic I yes, then you should give Leveraging Predictive Maintenance To Enhance Production This slide presents a dashboard to showcase the existing operational efficiency of production plant by covering multiple KPIs such as throughput, inventory turns, scarp rate and production target attainment Process Dashboard To Track Production Plant Machines Efficiency Template PDF a try. Our experts have put a lot of knowledge and effort into creating this impeccable Leveraging Predictive Maintenance To Enhance Production Process Dashboard To Track Production Plant Machines Efficiency Template PDF. You can use this template for your upcoming presentations, as the slides are perfect to represent even the tiniest detail. You can download these templates from the Slidegeeks website and these are easy to edit. So grab these today.

Introduction To Predictive Analytics Technology Forward Looking Analysis IT Structure PDF
This slide represents the predictive analytics introduction that is used for forecasts action, behaviors, and trends using recent and past information. It performs the operations such as data mining, text analytics, statistics, and modeling on structured and unstructured data.Get a simple yet stunning designed Introduction To Predictive Analytics Technology Forward Looking Analysis IT Structure PDF. It is the best one to establish the tone in your meetings. It is an excellent way to make your presentations highly effective. So, download this PPT today from Slidegeeks and see the positive impacts. Our easy-to-edit Introduction To Predictive Analytics Technology Forward Looking Analysis IT Structure PDF can be your go-to option for all upcoming conferences and meetings. So, what are you waiting for Grab this template today.

Data Interpretation And Analysis Playbook Business Intelligence And Predictive Analytics Challenges Template PDF
This template covers the problems while implementing BI and predictive analytics in the organization. The challenges are undefined KPIs and metrics, and unable to hire right data science talent. Presenting data interpretation and analysis playbook business intelligence and predictive analytics challenges template pdf to provide visual cues and insights. Share and navigate important information on two stages that need your due attention. This template can be used to pitch topics like security vulnerabilities, operationalizing, perform analysis, deployed. In addtion, this PPT design contains high resolution images, graphics, etc, that are easily editable and available for immediate download.

Calculate Facebook Key Performance Indicator The Specific Campaign Details Introduction PDF
Showcasing this set of slides titled calculate facebook key performance indicator the specific campaign details introduction pdf. The topics addressed in these templates are calculate facebook key performance indicator the specific campaign details. All the content presented in this PPT design is completely editable. Download it and make adjustments in color, background, font etc. as per your unique business setting.

Administered Data And Analytic Quality Playbook Business Intelligence And Predictive Download PDF
This template covers the problems while implementing BI and predictive analytics in the organization. The challenges are undefined KPIs and metrics, and unable to hire right data science talent. Deliver and pitch your topic in the best possible manner with this Administered Data And Analytic Quality Playbook Business Intelligence And Predictive Download PDF Use them to share invaluable insights on Common Misconception, Operationalizing, Production Deployment and impress your audience. This template can be altered and modified as per your expectations. So, grab it now.

HR Budget Vs Actual KPI Dashboard Ppt PowerPoint Presentation File Structure PDF
The given below slide highlights the key metrics of HR budget to manage expense stream and take assist decision making. It includes KPAs such as month wise variations in budget, total amount allocated, actual expenditures etc. Pitch your topic with ease and precision using this HR Budget Vs Actual KPI Dashboard Ppt PowerPoint Presentation File Structure PDF. This layout presents information on Amount Allocated, Expenses by Heads, Budget Achieved. It is also available for immediate download and adjustment. So, changes can be made in the color, design, graphics or any other component to create a unique layout.
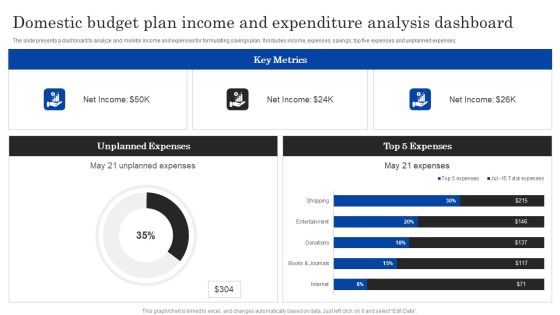
Domestic Budget Plan Income And Expenditure Analysis Dashboard Ppt PowerPoint Presentation Layouts Clipart Images PDF
The slide presents a dashboard to analyze and monitor income and expenses for formulating savings plan. It includes income, expenses, savings, top five expenses and unplanned expenses.Pitch your topic with ease and precision using this Domestic Budget Plan Income And Expenditure Analysis Dashboard Ppt PowerPoint Presentation Layouts Clipart Images PDF. This layout presents information on Unplanned Expenses, Expenses, Key Metrics. It is also available for immediate download and adjustment. So, changes can be made in the color, design, graphics or any other component to create a unique layout.
Expenditure Assessment Icon For Budget Planning Topics PDF
Presenting Expenditure Assessment Icon For Budget Planning Topics PDF to dispense important information. This template comprises Four stages. It also presents valuable insights into the topics including Expenditure Assessment, Icon For Budget Planning. This is a completely customizable PowerPoint theme that can be put to use immediately. So, download it and address the topic impactfully.

Business Operational Expenditure Monitoring Dashboard With Budget Analysis Icons PDF
This slide shows operating expenses OPEX monitoring dashboard with budget analysis assisting companies in evaluating funds useful until end of the year. It visually present the organizations operating expenses by time period and sector. Showcasing this set of slides titled Business Operational Expenditure Monitoring Dashboard With Budget Analysis Icons PDF. The topics addressed in these templates are Business Operational, Budget Analysis, Monitoring Dashboard. All the content presented in this PPT design is completely editable. Download it and make adjustments in color, background, font etc. as per your unique business setting.

ROI Calculation Ppt PowerPoint Presentation Complete Deck With Slides
This is a roi calculation ppt powerpoint presentation complete deck with slides. This is a one stage process. The stages in this process are business, planning, strategy, marketing, management.

Methods Of Data Clustering In Predictive Analytics Forward Looking Analysis IT Professional PDF
This slide outlines the two primary information clustering methods used in the predictive analytics clustering model. The methods include K-means and K-nearest neighbor clustering, including the working of both approaches.Slidegeeks is here to make your presentations a breeze with Methods Of Data Clustering In Predictive Analytics Forward Looking Analysis IT Professional PDF With our easy-to-use and customizable templates, you can focus on delivering your ideas rather than worrying about formatting. With a variety of designs to choose from, you are sure to find one that suits your needs. And with animations and unique photos, illustrations, and fonts, you can make your presentation pop. So whether you are giving a sales pitch or presenting to the board, make sure to check out Slidegeeks first.

Business Management Dashboards Budget Ppt Diagram Lists PDF
Deliver and pitch your topic in the best possible manner with this business management dashboards budget ppt diagram lists pdf. Use them to share invaluable insights on budget, income, expenses and impress your audience. This template can be altered and modified as per your expectations. So, grab it now.
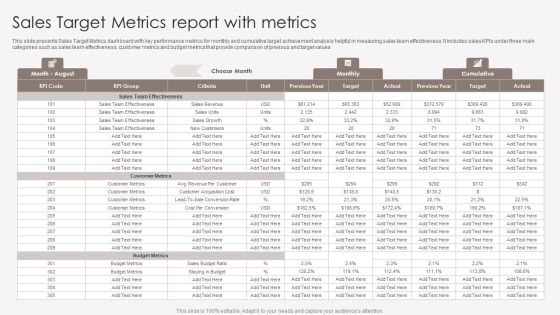
Sales Target Metrics Report With Metrics Introduction PDF
This slide presents Sales Target Metrics dashboard with key performance metrics for monthly and cumulative target achievement analysis helpful in measuring sales team effectiveness. It includes sales KPIs under three main categories such as sales team effectiveness, customer metrics and budget metrics that provide comparison of previous and target values. Pitch your topic with ease and precision using this Sales Target Metrics Report With Metrics Introduction PDF. This layout presents information on Sales Team Effectiveness, Customer Metrics, Budget Metrics. It is also available for immediate download and adjustment. So, changes can be made in the color, design, graphics or any other component to create a unique layout.
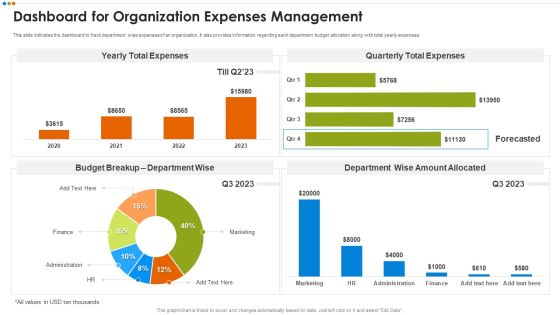
Quarterly Budget Analysis Of Business Organization Dashboard For Organization Expenses Microsoft PDF
This slide indicates the dashboard to track department wise expenses of an organization. It also provides information regarding each department budget allocation along with total yearly expenses.Deliver an awe inspiring pitch with this creative Quarterly Budget Analysis Of Business Organization Dashboard For Organization Expenses Microsoft PDF bundle. Topics like Budget Breakup, Quarterly Total Expenses, Department Wise Amount Allocated can be discussed with this completely editable template. It is available for immediate download depending on the needs and requirements of the user.

Dashboard For Organization Expenses Management Summary PDF
This slide indicates the dashboard to track department wise expenses of an organization. It also provides information regarding each department budget allocation along with total yearly expenses. Crafting an eye catching presentation has never been more straightforward. Let your presentation shine with this tasteful yet straightforward Dashboard For Organization Expenses Management Summary PDF template. It offers a minimalistic and classy look that is great for making a statement. The colors have been employed intelligently to add a bit of playfulness while still remaining professional. Construct the ideal Dashboard For Organization Expenses Management Summary PDF that effortlessly grabs the attention of your audience Begin now and be certain to wow your customers.
Predictive Data Analytics Ppt Powerpoint Presentation Infographics Master Slide Cpb
This is a predictive data analytics ppt powerpoint presentation infographics master slide cpb. This is a five stage process. The stages in this process are predictive data analytics.

Search Engine Marketing Estimated Campaign Performance Result Summary Designs PDF
The following slide depicts the forecasted campaign outcomes to assess potential earnings and spending. It includes key performance indicators such as monthly budget, cost per click, website traffic, conversion rate, average conversion value etc. Do you know about Slidesgeeks Search Engine Marketing Estimated Campaign Performance Result Summary Designs PDF These are perfect for delivering any kind od presentation. Using it, create PowerPoint presentations that communicate your ideas and engage audiences. Save time and effort by using our pre-designed presentation templates that are perfect for a wide range of topic. Our vast selection of designs covers a range of styles, from creative to business, and are all highly customizable and easy to edit. Download as a PowerPoint template or use them as Google Slides themes.

Estimated Campaign Performance Result Summary Ppt Slide PDF
The following slide depicts the forecasted campaign outcomes to assess potential earnings and spending. It includes key performance indicators such as monthly budget, cost per click, website traffic, conversion rate, average conversion value etc. Coming up with a presentation necessitates that the majority of the effort goes into the content and the message you intend to convey. The visuals of a PowerPoint presentation can only be effective if it supplements and supports the story that is being told. Keeping this in mind our experts created Estimated Campaign Performance Result Summary Ppt Slide PDF to reduce the time that goes into designing the presentation. This way, you can concentrate on the message while our designers take care of providing you with the right template for the situation.

Deploying Ai To Enhance Predictive Analytics Dashboard To Track Manufacturing Guidelines PDF
This slide depicts the predictive analytics dashboard to track manufacturing operations, including production volume, order volume, active machines, sales revenue, top five products, downtime causes, production volume by top five machines, and so on. This modern and well-arranged Deploying Ai To Enhance Predictive Analytics Dashboard To Track Manufacturing Guidelines PDF provides lots of creative possibilities. It is very simple to customize and edit with the Powerpoint Software. Just drag and drop your pictures into the shapes. All facets of this template can be edited with Powerpoint, no extra software is necessary. Add your own material, put your images in the places assigned for them, adjust the colors, and then you can show your slides to the world, with an animated slide included.

Predictive Data Model Predictive Analytics In Align Sales And Marketing Better Information PDF
This slide describes how predictive analytics can help align sales and marketing better. Predictive analytics can help get insights from sales and marketing teams that can help to improve several factors, including handing off leads, communication of promotions, and so on. Are you searching for a Predictive Data Model Predictive Analytics In Align Sales And Marketing Better Information PDF that is uncluttered, straightforward, and original Its easy to edit, and you can change the colors to suit your personal or business branding. For a presentation that expresses how much effort you have put in, this template is ideal With all of its features, including tables, diagrams, statistics, and lists, its perfect for a business plan presentation. Make your ideas more appealing with these professional slides. Download Predictive Data Model Predictive Analytics In Align Sales And Marketing Better Information PDF from Slidegeeks today.

Predictive Data Model Steps For Predictive Analytics Workflow Application Sample PDF
This slide represents the steps for predictive analytics workflow application in industries, and it includes accessing and exploring information, pre-processing information, developing predictive models, and integrating analytics with systems. Get a simple yet stunning designed Predictive Data Model Steps For Predictive Analytics Workflow Application Sample PDF. It is the best one to establish the tone in your meetings. It is an excellent way to make your presentations highly effective. So, download this PPT today from Slidegeeks and see the positive impacts. Our easy-to-edit Predictive Data Model Steps For Predictive Analytics Workflow Application Sample PDF can be your go-to option for all upcoming conferences and meetings. So, what are you waiting for Grab this template today.
MSW Management Waste Management Tracking Dashboard Rules PDF
This slide covers the key performance indicators for waste management including waste trucks tracker, green house gasses emissions, energy used and many more. Deliver an awe inspiring pitch with this creative MSW Management Waste Management Tracking Dashboard Rules Pdf bundle. Topics like waste management manpower budget can be discussed with this completely editable template. It is available for immediate download depending on the needs and requirements of the user.

Data Valuation And Monetization Predicting Customer Churn Probability Through Predictive Analytics Icons PDF
After deploying predictive analytics tool, the firm will become capable in predicting churn probability of various customers on basis of various attributes such as NPS, transaction usage, etc. that are retrieved from customer data.Deliver and pitch your topic in the best possible manner with this Data Valuation And Monetization Predicting Customer Churn Probability Through Predictive Analytics Icons PDF. Use them to share invaluable insights on Transaction, Churn Probability, Comments and impress your audience. This template can be altered and modified as per your expectations. So, grab it now.

Procedure Advancements Banking Department Financial Forecast After Process Improvement Template PDF
The slide provides the financial forecast of the company after the process improvement. Major KPIs key performance indicators covered in the slide are total revenue, interest income, number of customers, customer churn rate, online banking users, customer satisfaction rate etc. Deliver and pitch your topic in the best possible manner with this procedure advancements banking department financial forecast after process improvement template pdf. Use them to share invaluable insights on total revenue, interest income, customer satisfaction rate, customer churn rate, online banking users and impress your audience. This template can be altered and modified as per your expectations. So, grab it now.
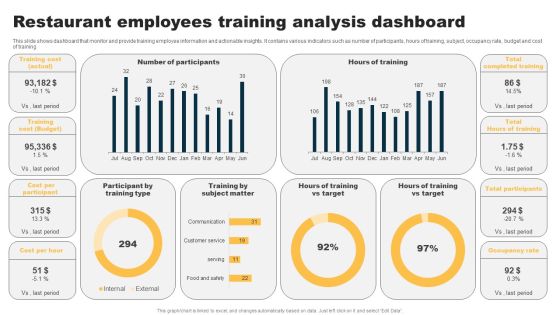
Restaurant Employees Training Analysis Dashboard Diagrams PDF
This slide shows dashboard that monitor and provide training employee information and actionable insights. It contains various indicators such as number of participants, hours of training, subject, occupancy rate, budget and cost of training. Showcasing this set of slides titled Restaurant Employees Training Analysis Dashboard Diagrams PDF. The topics addressed in these templates are Participant Training Type, Training Subject Matter, Hours Of Training Target. All the content presented in this PPT design is completely editable. Download it and make adjustments in color, background, font etc. as per your unique business setting.

Predictive Analytics In The Age Of Big Data Steps To Build Predictive Algorithm Models Sample PDF
This slide discusses the steps required to create predictive algorithm models for business processes. The steps include defining scope and scale, profile data, information collection, cleaning, and integrating, comprising analytics in business processes, and tracking models and business results. Create an editable Predictive Analytics In The Age Of Big Data Steps To Build Predictive Algorithm Models Sample PDF that communicates your idea and engages your audience. Whether youre presenting a business or an educational presentation, pre designed presentation templates help save time. Predictive Analytics In The Age Of Big Data Steps To Build Predictive Algorithm Models Sample PDF is highly customizable and very easy to edit, covering many different styles from creative to business presentations. Slidegeeks has creative team members who have crafted amazing templates. So, go and get them without any delay.

Predictive Data Model Roadmap For Predictive Analytics Model Development Clipart PDF
This slide represents the roadmap for predictive analytics model development, including the steps to be performed in the process, such as highlighting and formulating a problem, data preparation, information exploration, transforming and choosing, making, validating, and so on. Do you have to make sure that everyone on your team knows about any specific topic I yes, then you should give Predictive Data Model Roadmap For Predictive Analytics Model Development Clipart PDF a try. Our experts have put a lot of knowledge and effort into creating this impeccable Predictive Data Model Roadmap For Predictive Analytics Model Development Clipart PDF. You can use this template for your upcoming presentations, as the slides are perfect to represent even the tiniest detail. You can download these templates from the Slidegeeks website and these are easy to edit. So grab these today

Predictive Data Model Predictive Analytics To Understand Current Customers Needs Infographics PDF
This slide outlines how predictive analytics can help understand existing customers needs as many businesses depend on client retention and upsells. It also includes the factors impacting the marketing industry, including lead generation, new products or services, and improved referrals. Create an editable Predictive Data Model Predictive Analytics To Understand Current Customers Needs Infographics PDF that communicates your idea and engages your audience. Whether you are presenting a business or an educational presentation, pre-designed presentation templates help save time. Predictive Data Model Predictive Analytics To Understand Current Customers Needs Infographics PDF is highly customizable and very easy to edit, covering many different styles from creative to business presentations. Slidegeeks has creative team members who have crafted amazing templates. So, go and get them without any delay.

Predictive Data Model Training Program For Predictive Analytics Model Microsoft PDF
This slide represents the training program for the predictive analytics model, and it includes the name of teams, trainer names, modules to be covered in training, and the schedule and venue of the training. Find highly impressive Predictive Data Model Training Program For Predictive Analytics Model Microsoft PDF on Slidegeeks to deliver a meaningful presentation. You can save an ample amount of time using these presentation templates. No need to worry to prepare everything from scratch because Slidegeeks experts have already done a huge research and work for you. You need to download Predictive Data Model Training Program For Predictive Analytics Model Microsoft PDF for your upcoming presentation. All the presentation templates are 100 percent editable and you can change the color and personalize the content accordingly. Download now

Service Hourly Rate Calculation Stages Of Cost Allocation Procedure Pictures PDF
This slide covers the service hourly rate calculation including cost type, comments, annual budgeted cost, forecast billable hours and hourly rate. Crafting an eye-catching presentation has never been more straightforward. Let your presentation shine with this tasteful yet straightforward Service Hourly Rate Calculation Stages Of Cost Allocation Procedure Pictures PDF template. It offers a minimalistic and classy look that is great for making a statement. The colors have been employed intelligently to add a bit of playfulness while still remaining professional. Construct the ideal Service Hourly Rate Calculation Stages Of Cost Allocation Procedure Pictures PDF that effortlessly grabs the attention of your audience Begin now and be certain to wow your customers.

Transaction Data Overview Company Payout Dashboard Guidelines PDF
The slide highlights the payment dashboard to overview the transaction data for effectively managing finances. Various elements included are activities, statistics, card information, transaction history, and budget. Pitch your topic with ease and precision using this Transaction Data Overview Company Payout Dashboard Guidelines PDF. This layout presents information on Transaction History, Budget, Card Information, Statistics. It is also available for immediate download and adjustment. So, changes can be made in the color, design, graphics or any other component to create a unique layout.
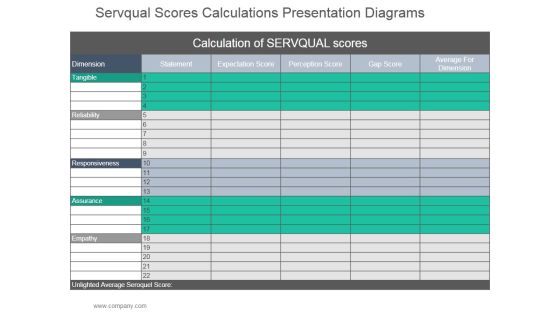
Servqual Scores Calculations Ppt PowerPoint Presentation Picture
This is a servqual scores calculations ppt powerpoint presentation picture. This is a five stage process. The stages in this process are calculation of servqual scores, dimension, statement, expectation score, perception score, gap score, average for dimension, tangible, reliability, responsiveness, assurance, empathy, unlighted average seroquel score.

Market Research Study Template Ppt Sample
This is a market research study template ppt sample. This is a four stage process. The stages in this process are market size estimation, market crack down and data triangulation, market forecast model, key data points.

Forecasted Policies And Claims Data After Successful Strategy Implementation Ppt Model Introduction PDF
This slide shows the forecasted policies and claims data after the successful implementation of the strategies which includes policies sold, GWP, average premium etc. This is a forecasted policies and claims data after successful strategy implementation ppt model introduction pdf template with various stages. Focus and dispense information on two stages using this creative set, that comes with editable features. It contains large content boxes to add your information on topics like average premium, paid claims ratio, 2021. You can also showcase facts, figures, and other relevant content using this PPT layout. Grab it now.

Budgeting Template Ppt PowerPoint Presentation Show Picture
This is a budgeting template ppt powerpoint presentation show picture. This is a three stage process. The stages in this process are business, marketing, strategy, budget, table.
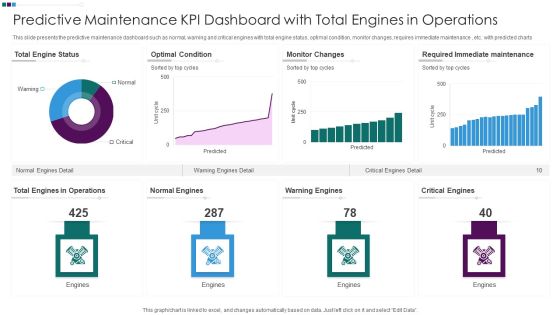
Predictive Maintenance KPI Dashboard With Total Engines In Operations Ppt Professional Inspiration PDF
This slide presents the predictive maintenance dashboard such as normal, warning and critical engines with total engine status, optimal condition, monitor changes, requires immediate maintenance , etc. with predicted charts. Pitch your topic with ease and precision using this Predictive Maintenance KPI Dashboard With Total Engines In Operations Ppt Professional Inspiration PDF. This layout presents information on Total Engine Status, Optimal Condition Monitor, Changes Warning Engines, Required Immediate Maintenance. It is also available for immediate download and adjustment. So, changes can be made in the color, design, graphics or any other component to create a unique layout.

Predictive Data Model Predictive Analytics In Banking And Finance Industry Introduction PDF
This slide represents the application of predictive analytics in the finance and banking sector as they deal with vast amounts of data. It helps these industries identify fraudulent transactions, generate credit score, monitor credit risks, and optimize cross-sell or up-sell possibilities. Retrieve professionally designed Predictive Data Model Predictive Analytics In Banking And Finance Industry Introduction PDF to effectively convey your message and captivate your listeners. Save time by selecting pre-made slideshows that are appropriate for various topics, from business to educational purposes. These themes come in many different styles, from creative to corporate, and all of them are easily adjustable and can be edited quickly. Access them as PowerPoint templates or as Google Slides themes. You do not have to go on a hunt for the perfect presentation because Slidegeeks got you covered from everywhere.

Predictive Data Model Checklist For Predictive Analytics Model Deployment Sample PDF
This slide talks about the checklist for predictive analytics deployment that is necessary for organizations before deploying it and avoiding possible mistakes. It includes defining objectives, building the right team, and planning the deployment. Present like a pro with Predictive Data Model Checklist For Predictive Analytics Model Deployment Sample PDF Create beautiful presentations together with your team, using our easy-to-use presentation slides. Share your ideas in real-time and make changes on the fly by downloading our templates. So whether you are in the office, on the go, or in a remote location, you can stay in sync with your team and present your ideas with confidence. With Slidegeeks presentation got a whole lot easier. Grab these presentations today.

Predictive Data Model Uses Of Predictive Analytics In Marketing Industry Themes PDF
This slide outlines the use of predictive analytics in the marketing industry, where active traders develop a new campaign based on customer behavior. The marketing use cases include understanding customer behavior, optimizing resources and spending, qualifying and prioritizing leads, and retaining customers. Are you in need of a template that can accommodate all of your creative concepts This one is crafted professionally and can be altered to fit any style. Use it with Google Slides or PowerPoint. Include striking photographs, symbols, depictions, and other visuals. Fill, move around, or remove text boxes as desired. Test out color palettes and font mixtures. Edit and save your work, or work with colleagues. Download Predictive Data Model Uses Of Predictive Analytics In Marketing Industry Themes PDF and observe how to make your presentation outstanding. Give an impeccable presentation to your group and make your presentation unforgettable.
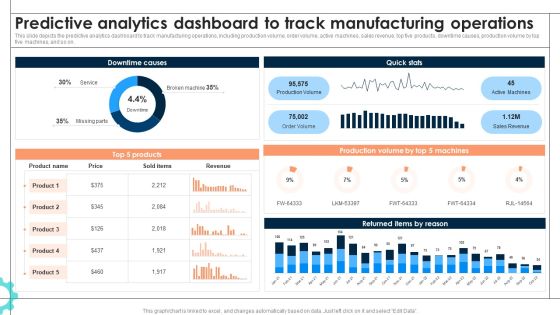
Intelligent Manufacturing Predictive Analytics Dashboard To Track Manufacturing Operations Information PDF
This slide depicts the predictive analytics dashboard to track manufacturing operations, including production volume, order volume, active machines, sales revenue, top five products, downtime causes, production volume by top five machines, and so on. If you are looking for a format to display your unique thoughts, then the professionally designed Intelligent Manufacturing Predictive Analytics Dashboard To Track Manufacturing Operations Information PDF is the one for you. You can use it as a Google Slides template or a PowerPoint template. Incorporate impressive visuals, symbols, images, and other charts. Modify or reorganize the text boxes as you desire. Experiment with shade schemes and font pairings. Alter, share or cooperate with other people on your work. Download Intelligent Manufacturing Predictive Analytics Dashboard To Track Manufacturing Operations Information PDF and find out how to give a successful presentation. Present a perfect display to your team and make your presentation unforgettable.

Iot Integration In Manufacturing Predictive Analytics Dashboard To Track Manufacturing Operations Background PDF
This slide depicts the predictive analytics dashboard to track manufacturing operations, including production volume, order volume, active machines, sales revenue, top five products, downtime causes, production volume by top five machines, and so on. If you are looking for a format to display your unique thoughts, then the professionally designed Iot Integration In Manufacturing Predictive Analytics Dashboard To Track Manufacturing Operations Background PDF is the one for you. You can use it as a Google Slides template or a PowerPoint template. Incorporate impressive visuals, symbols, images, and other charts. Modify or reorganize the text boxes as you desire. Experiment with shade schemes and font pairings. Alter, share or cooperate with other people on your work. Download Iot Integration In Manufacturing Predictive Analytics Dashboard To Track Manufacturing Operations Background PDF and find out how to give a successful presentation. Present a perfect display to your team and make your presentation unforgettable.
 Home
Home