Project Snapshot

Consumer Portfolio Dashboard With Budget Details Ppt PowerPoint Presentation Styles Graphics Tutorials PDF
Presenting this set of slides with name consumer portfolio dashboard with budget details ppt powerpoint presentation styles graphics tutorials pdf. The topics discussed in these slides are portfolio summary, portfolio owner, budget, projects, estimated cost across portfolios. This is a completely editable PowerPoint presentation and is available for immediate download. Download now and impress your audience.

Financial Assets Management KPI And Dashboard Ppt PowerPoint Presentation Complete Deck With Slides
Presenting this set of slides with name financial assets management kpi and dashboard ppt powerpoint presentation complete deck with slides. The topics discussed in these slides are pipeline projects, financial forecast, work forecast. This is a completely editable PowerPoint presentation and is available for immediate download. Download now and impress your audience.

Organization Chart Ppt PowerPoint Presentation Gallery Graphics Pictures
This is a organization chart ppt powerpoint presentation gallery graphics pictures. This is a four stage process. The stages in this process are head customer relations name, production name, head bending name, head employee relation and admin, name head projects.
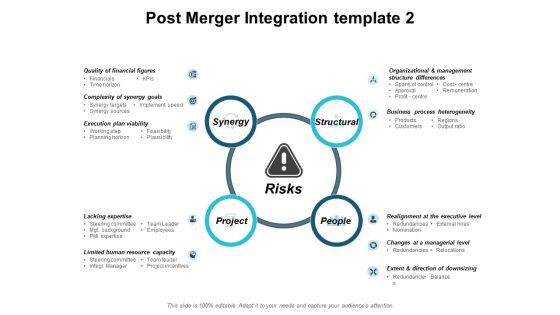
Post Merger Integration Template Planning Ppt PowerPoint Presentation Model Pictures
This is a post merger integration template planning ppt powerpoint presentation model pictures. This is a four stage process. The stages in this process are synergy, structural, project, people, strategy.

KPI Dashboard To Track Effectiveness Of Real Estate Business Performance Slides PDF
The following slide exhibits key performance indicator KPI dashboard which can be used to measure the financial performance of the real estate company. It covers various kpis such as sales vs target per agent, top 10 projects, top 5 agencies etc. Deliver an awe inspiring pitch with this creative KPI Dashboard To Track Effectiveness Of Real Estate Business Performance Slides PDF bundle. Topics like KPI Dashboard, Track Effectiveness, Real Estate Business Performance can be discussed with this completely editable template. It is available for immediate download depending on the needs and requirements of the user.
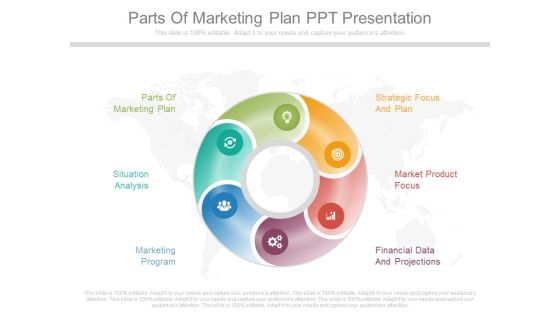
Parts Of Marketing Plan Ppt Presentation
This is a parts of marketing plan ppt presentation. This is a six stage process. The stages in this process are parts of marketing plan, strategic focus and plan, situation analysis, market product focus, marketing program, financial data and projections.

Innovation Roadmap Execution With Track And Monitor Ppt PowerPoint Presentation Pictures Summary
Presenting this set of slides with name innovation roadmap execution with track and monitor ppt powerpoint presentation pictures summary. This is a two stage process. The stages in this process are transition execution, executive presentation, calculate roi, create narrative, assign priority, identify project, confirm approach, confirm with client, close project, innovation roadmap execution, innovation roadmap development . This is a completely editable PowerPoint presentation and is available for immediate download. Download now and impress your audience.
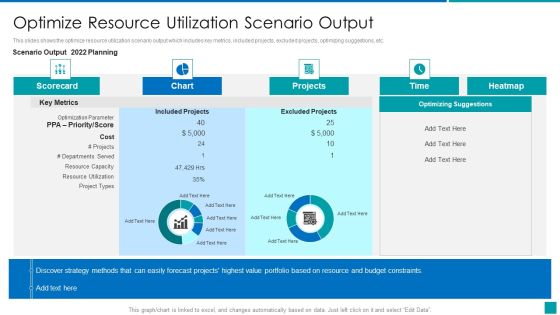
Optimize Resource Utilization Scenario Output Rules PDF
This slides shows the optimize resource utilization scenario output which includes key metrics, included projects, excluded projects, optimizing suggestions, etc. Deliver and pitch your topic in the best possible manner with this Optimize Resource Utilization Scenario Output Rules PDF. Use them to share invaluable insights on Portfolio, Strategy, Budget, Resource and impress your audience. This template can be altered and modified as per your expectations. So, grab it now.

Budget Analysis Dashboard With Actual And Forecasted Revenue Comparison Structure PDF
This slide displays the budget analysis report comparing the budget with the actual year to date data. It also helps in making estimations for the remaining year. It includes variance between budgeted and actual gross margin results, service revenue, profit margin, product revenue, payroll cost, etc. Pitch your topic with ease and precision using this Budget Analysis Dashboard With Actual And Forecasted Revenue Comparison Structure PDF. This layout presents information on Payroll Cost, Budget Revenue Components, Product Revenue. It is also available for immediate download and adjustment. So, changes can be made in the color, design, graphics or any other component to create a unique layout.

Business Plan Review Dashboard With Task Details Sample PDF
The following slide showcases dashboard of plan review to track KPIs and other relevant details regarding business, department and projects. Key indicators covered are contracts, proposals, documents review, bid date, plan review, completion percentage and priority. Pitch your topic with ease and precision using this Business Plan Review Dashboard With Task Details Sample PDF. This layout presents information on Business Plan Review, Dashboard With Task Details. It is also available for immediate download and adjustment. So, changes can be made in the color, design, graphics or any other component to create a unique layout.
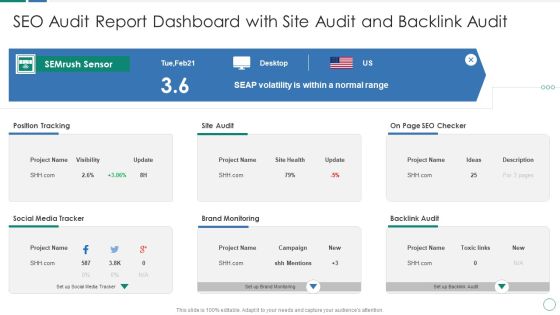
SEO Audit Report Dashboard With Site Audit And Backlink Audit Summary PDF
Deliver an awe inspiring pitch with this creative SEO Audit Report Dashboard With Site Audit And Backlink Audit Summary PDF bundle. Topics like Position Tracking Site, Audit Page SEO, Checker Backlink Audit, Brand Monitoring Project, Social Media Tracker can be discussed with this completely editable template. It is available for immediate download depending on the needs and requirements of the user.

Agenda For How To Prioritize Activities Action Priority Matrix Ppt Layouts Pictures PDF
Presenting agenda for how to prioritize activities action priority matrix ppt layouts pictures pdf to provide visual cues and insights. Share and navigate important information on five stages that need your due attention. This template can be used to pitch topics like analyze the project, understand the key activates in the project, implement the task prioritization technique. In addtion, this PPT design contains high resolution images, graphics, etc, that are easily editable and available for immediate download.

Customer Relationship Management Action Plan CRM Application Dashboard Icon Themes PDF
Deliver an awe inspiring pitch with this creative customer relationship management action plan crm application dashboard icon themes pdf bundle. Topics like onboarding projects, accounts at risk, ongoing accounts can be discussed with this completely editable template. It is available for immediate download depending on the needs and requirements of the user.

Cross Border Integration In Multinational Corporation Global Coordination Dashboard Cloud Formats PDF
This slide provides information regarding the dashboard that contains indicators to determine the coordination activities in various dispersed facilities in different regions across the globe. Deliver an awe-inspiring pitch with this creative cross border integration in multinational corporation global coordination dashboard cloud formats pdf bundle. Topics like project, cloud space, philip armstrong, cloud storage, upgrade storage can be discussed with this completely editable template. It is available for immediate download depending on the needs and requirements of the user.
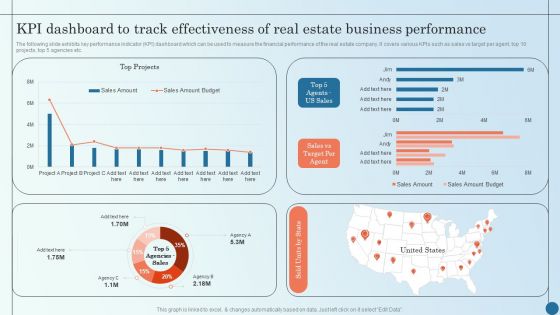
KPI Dashboard To Track Effectiveness Of Real Estate Business Managing Commercial Property Risks Demonstration PDF
The following slide exhibits key performance indicator KPI dashboard which can be used to measure the financial performance of the real estate company. It covers various KPIs such as sales vs target per agent, top 10 projects, top 5 agencies etc.Deliver an awe inspiring pitch with this creative KPI Dashboard To Track Effectiveness Of Real Estate Business Managing Commercial Property Risks Demonstration PDF bundle. Topics like Kpi Dashboard, Track Effectiveness, Estate Business can be discussed with this completely editable template. It is available for immediate download depending on the needs and requirements of the user.
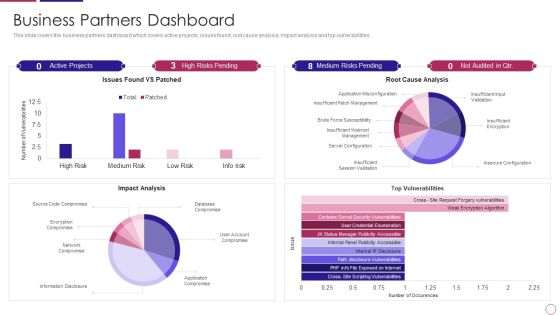
PRM To Streamline Business Processes Business Partners Dashboard Introduction PDF
This slide covers the business partners dashboard which covers active projects, issues found, root cause analysis, impact analysis and top vulnerabilities. Deliver and pitch your topic in the best possible manner with this prm to streamline business processes business partners dashboard introduction pdf. Use them to share invaluable insights on impact analysis, top vulnerabilities, server configuration, network compromise, issues found vs patched and impress your audience. This template can be altered and modified as per your expectations. So, grab it now.

Building Quality Inspection Dashboard With Customer Satisfaction Ratio Icons PDF
The following slide showcases dashboard of construction company exhibiting quality KPIs regarding safety, workmanship and customer satisfaction. Key indicators covered are site inspection success level, CSR, defect count, net promoter score, promotors, passives, defectors, total rework cost, safety meetings and average time taken to fix defects. Showcasing this set of slides titled Building Quality Inspection Dashboard With Customer Satisfaction Ratio Icons PDF. The topics addressed in these templates are Construction Project, Customer Satisfaction Ratio, Promoters. All the content presented in this PPT design is completely editable. Download it and make adjustments in color, background, font etc. as per your unique business setting.

Business Partners Dashboard Ppt Professional File Formats PDF
This slide covers the business partners dashboard which covers active projects, issues found, root cause analysis, impact analysis and top vulnerabilities. Deliver an awe inspiring pitch with this creative business partners dashboard ppt professional file formats pdf bundle. Topics like business partners dashboard can be discussed with this completely editable template. It is available for immediate download depending on the needs and requirements of the user.

Strategic Partnership Management Plan Business Partners Dashboard Mockup PDF
This slide covers the business partners dashboard which covers active projects, issues found, root cause analysis, impact analysis and top vulnerabilities. Deliver an awe inspiring pitch with this creative strategic partnership management plan business partners dashboard mockup pdf bundle. Topics like issues found vs patched, impact analysis, root cause analysis, top vulnerabilities can be discussed with this completely editable template. It is available for immediate download depending on the needs and requirements of the user.

Engineering Performance Metrics Dashboard To Track Cloud Services Cost Clipart PDF
This slide covers engineering KPI dashboard to track cost of cloud services. It involves KPIs such as average delay of product, cost of cloud services, pageview by browser and pull requests by projects. Showcasing this set of slides titled Engineering Performance Metrics Dashboard To Track Cloud Services Cost Clipart PDF. The topics addressed in these templates are Cost Of Cloud Services, Average, Product. All the content presented in this PPT design is completely editable. Download it and make adjustments in color, background, font etc. as per your unique business setting.
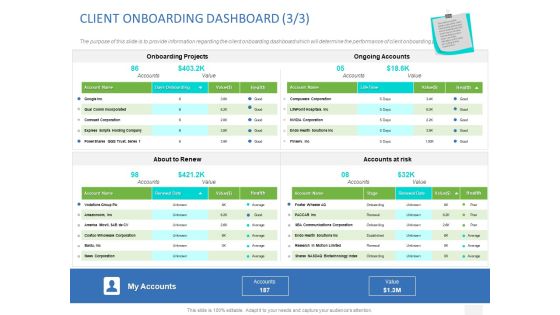
Organizational Socialization CLIENT ONBOARDING DASHBOARD Corporation Ppt Gallery Format PDF
The purpose of this slide is to provide information regarding the client onboarding dashboard which will determine the performance of client onboarding process. Deliver an awe inspiring pitch with this creative organizational socialization client onboarding dashboard corporation ppt gallery format pdf. bundle. topics like onboarding projects, ongoing accounts, about to renew, accounts at risk. can be discussed with this completely editable template. it is available for immediate download depending on the needs and requirements of the user.
Team Achievement Dashboard For Tracking Tasks Completion Graphics PDF
This slide illustrates team success dashboard for tracking tasks completion. This provides information about rate, section, incomplete, assignee, upcoming tasks, etc. Showcasing this set of slides titled team achievement dashboard for tracking tasks completion graphics pdf. The topics addressed in these templates are completion rate, spent time on project, task completion. All the content presented in this PPT design is completely editable. Download it and make adjustments in color, background, font etc. as per your unique business setting.
Performance Tracking Dashboard For Software Development Life Cycle Structure PDF
This slide represents the software development life cycle dashboard, including summary, tasks, workloads, time spent on projects, new vs. finished, and team cost breakdown. Deliver an awe inspiring pitch with this creative overview of the software development life cycle company demonstration pdf bundle. Topics like performance tracking dashboard for software development life cycle can be discussed with this completely editable template. It is available for immediate download depending on the needs and requirements of the user.
Solution Development Process Performance Tracking Dashboard For SDLC Ideas PDF
This slide represents the software development life cycle dashboard, including summary, tasks, workloads, time spent on projects, new vs. finished, and team cost breakdown.Deliver an awe inspiring pitch with this creative Solution Development Process Performance Tracking Dashboard For SDLC Ideas PDF bundle. Topics like Summary, Workload, Cost Backdown can be discussed with this completely editable template. It is available for immediate download depending on the needs and requirements of the user.

Architecture Transformation Playbook Essential Construction Activities Management Dashboard Topics PDF
This slide provides information regarding essential construction activities management dashboard with details about site inspection, rework costs, safety meetings, etc. Deliver an awe inspiring pitch with this creative Architecture Transformation Playbook Essential Construction Activities Management Dashboard Topics PDF bundle. Topics like Project, Customer Complaints, Customer Satisfaction Ratio can be discussed with this completely editable template. It is available for immediate download depending on the needs and requirements of the user.

Toolkit For Data Science And Analytics Transition Business Case And Roadmap For Data Analytics Microsoft PDF
This slide shows the detailed document covering the problem statement, companys vision, key processes and outcomes for the data analytics project.There are so many reasons you need a Toolkit For Data Science And Analytics Transition Business Case And Roadmap For Data Analytics Microsoft PDF. The first reason is you can not spend time making everything from scratch, Thus, Slidegeeks has made presentation templates for you too. You can easily download these templates from our website easily.

Inventory Management Dashboard To Forecasting Stock Budget Elements PDF
The following slide depicts the inventory analysis dashboard to determine inventory accuracy. It includes elements such as order cycle time, stock trend, ratio analysis, product wise inventory analysis etc. Pitch your topic with ease and precision using this Inventory Management Dashboard To Forecasting Stock Budget Elements PDF. This layout presents information on Inventory Ratio Analysis, Product Wise Inventory Analysis, Stock Trend. It is also available for immediate download and adjustment. So, changes can be made in the color, design, graphics or any other component to create a unique layout.
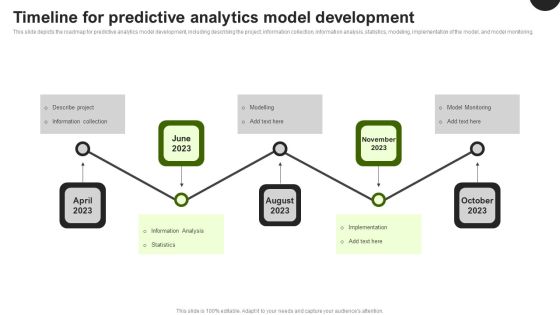
Predictive Analytics In The Age Of Big Data Timeline For Predictive Analytics Model Development Information PDF
This slide depicts the roadmap for predictive analytics model development, including describing the project, information collection, information analysis, statistics, modeling, implementation of the model, and model monitoring. There are so many reasons you need a Predictive Analytics In The Age Of Big Data Timeline For Predictive Analytics Model Development Information PDF. The first reason is you cannot spend time making everything from scratch, Thus, Slidegeeks has made presentation templates for you too. You can easily download these templates from our website easily.
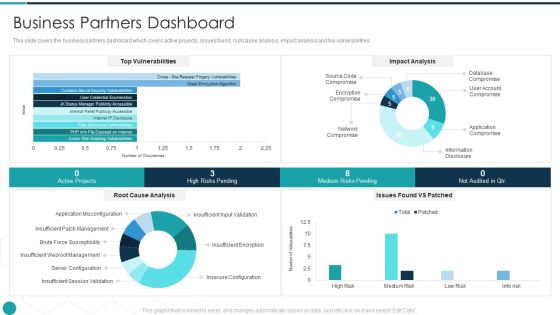
Upgrade Management Of Complex Business Associates Business Partners Dashboard Brochure PDF
This slide covers the business partners dashboard which covers active projects, issues found, root cause analysis, impact analysis and top vulnerabilities. Deliver and pitch your topic in the best possible manner with this upgrade management of complex business associates business partners dashboard brochure pdf. Use them to share invaluable insights on business partners dashboard and impress your audience. This template can be altered and modified as per your expectations. So, grab it now.

Business Partners Dashboard Effective Partnership Administration With Clients Channel And Corporate Partners Guidelines PDF
This slide covers the business partners dashboard which covers active projects, issues found, root cause analysis, impact analysis and top vulnerabilities. Deliver an awe inspiring pitch with this creative business partners dashboard effective partnership administration with clients channel and corporate partners guidelines pdf bundle. Topics like impact analysis, vulnerabilities, root cause analysis can be discussed with this completely editable template. It is available for immediate download depending on the needs and requirements of the user.

Forecasted Impact Of Strategies On Key Performance Indicators Slides PDF
Mentioned slide provides information about predicted affects on marketing communication strategies on business metrics. It includes KPIs such as website visit, blog traffic, conversion rate, social share, click through rate, bounce rate, impression, etc. Boost your pitch with our creative Forecasted Impact Of Strategies On Key Performance Indicators Slides PDF. Deliver an awe inspiring pitch that will mesmerize everyone. Using these presentation templates you will surely catch everyones attention. You can browse the ppts collection on our website. We have researchers who are experts at creating the right content for the templates. So you do not have to invest time in any additional work. Just grab the template now and use them.

Information Transformation Process Toolkit Data Analytics Program Checklist Mockup PDF
This slide shows progress status of data analytics process which includes important key tasks that must be performed while initiating a project. Deliver and pitch your topic in the best possible manner with this Information Transformation Process Toolkit Data Analytics Program Checklist Mockup PDF. Use them to share invaluable insights on Data Modelling, Statistical Analysis, Data Analysis and impress your audience. This template can be altered and modified as per your expectations. So, grab it now.
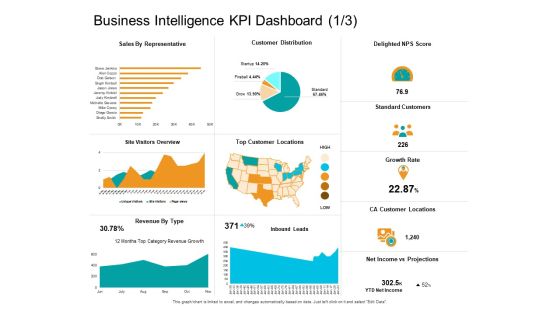
Facts Assessment Business Intelligence KPI Dashboard Expenses Ppt PowerPoint Presentation Layouts Background Images PDF
Presenting this set of slides with name facts assessment business intelligence kpi dashboard expenses ppt powerpoint presentation layouts background images pdf. The topics discussed in these slides are sales representative, delighted nps score, standard customers, growth rate, ca customer locations, net income vs projections, revenue type, top customer locations, customer distribution. This is a completely editable PowerPoint presentation and is available for immediate download. Download now and impress your audience.

Firm Productivity Administration Business Intelligence KPI Dashboard Score Ppt PowerPoint Presentation Infographic Template Display PDF
Presenting this set of slides with name firm productivity administration business intelligence kpi dashboard score ppt powerpoint presentation infographic template display pdf. The topics discussed in these slides are sales representative, delighted nps score, standard customers, growth rate, ca customer locations, net income vs projections, revenue type, top customer locations, customer distribution. This is a completely editable PowerPoint presentation and is available for immediate download. Download now and impress your audience.
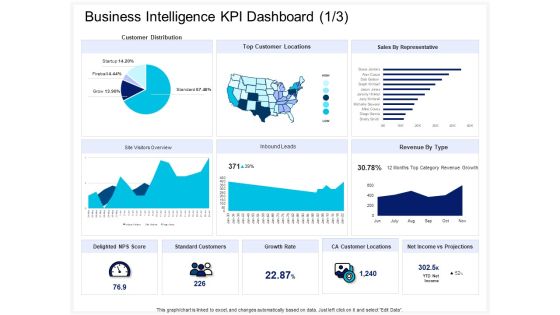
Enterprise Problem Solving And Intellect Business Intelligence KPI Dashboard Growth Ppt PowerPoint Presentation Model Images PDF
Presenting this set of slides with name enterprise problem solving and intellect business intelligence kpi dashboard growth ppt powerpoint presentation model images pdf. The topics discussed in these slides are sales representative, delighted nps score, standard customers, growth rate, ca customer locations, net income vs projections, revenue type, top customer locations, customer distribution. This is a completely editable PowerPoint presentation and is available for immediate download. Download now and impress your audience.
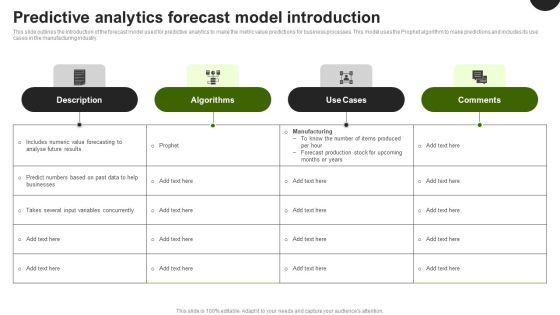
Predictive Analytics In The Age Of Big Data Predictive Analytics Forecast Model Introduction Information PDF
This slide outlines the introduction of the forecast model used for predictive analytics to make the metric value predictions for business processes. This model uses the Prophet algorithm to make predictions and includes its use cases in the manufacturing industry. Formulating a presentation can take up a lot of effort and time, so the content and message should always be the primary focus. The visuals of the PowerPoint can enhance the presenters message, so our Predictive Analytics In The Age Of Big Data Predictive Analytics Forecast Model Introduction Information PDF was created to help save time. Instead of worrying about the design, the presenter can concentrate on the message while our designers work on creating the ideal templates for whatever situation is needed. Slidegeeks has experts for everything from amazing designs to valuable content, we have put everything into Predictive Analytics In The Age Of Big Data Predictive Analytics Forecast Model Introduction Information PDF

Agile Development Approach IT Team Management Dashboard In Agile Sample PDF
This slide represents the team management dashboard in agile by covering the details of total resources, overall task completion rate, features closed, and bugs closed. Deliver an awe inspiring pitch with this creative Agile Development Approach IT Team Management Dashboard In Agile Sample PDF bundle. Topics like Total Resources, Project, Features Closed, Bugs Closed, Team Roles can be discussed with this completely editable template. It is available for immediate download depending on the needs and requirements of the user.

Enterprise Governance Business Management Kpis Metrics Demonstration PDF
Deliver and pitch your topic in the best possible manner with this enterprise governance business management kpis metrics demonstration pdf. Use them to share invaluable insights on new clients, delayed projects, gross profit margin and impress your audience. This template can be altered and modified as per your expectations. So, grab it now.

Digital Marketing Campaign Performance Monitoring Dashboard Pictures PDF
This slide represents the dashboard for measuring and monitoring the performance of digital marketing campaign. It includes information related to the advertisement cost, cost per conversion, no. of clicks, conversion rate, impressions, cost per click, click through rate and cost per thousand impressions of the project.Pitch your topic with ease and precision using this Digital Marketing Campaign Performance Monitoring Dashboard Pictures PDF. This layout presents information on Conversion Rate, Per Conversion, Cost Per Thousand. It is also available for immediate download and adjustment. So, changes can be made in the color, design, graphics or any other component to create a unique layout.
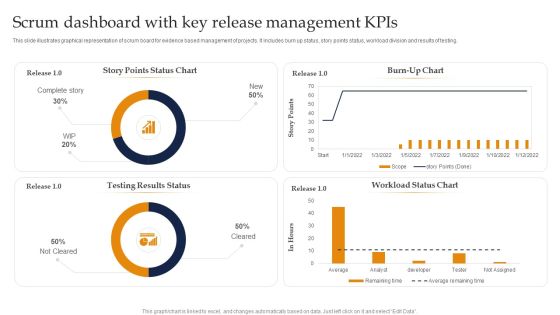
Scrum Dashboard With Key Release Management Kpis Ppt Summary Vector PDF
This slide illustrates graphical representation of scrum board for evidence based management of projects. It includes burn up status, story points status, workload division and results of testing. Showcasing this set of slides titled Scrum Dashboard With Key Release Management Kpis Ppt Summary Vector PDF. The topics addressed in these templates are Burn Up Chart, Workload Status Chart, Testing Results Status. All the content presented in this PPT design is completely editable. Download it and make adjustments in color, background, font etc. as per your unique business setting.

One Page Summary Annual Committee Report Template Department Of Entomology One Pager Documents
This one page shows the information regarding annual committee report template department of entomology which includes executive summary, role of department, goals, vision, overview, other projects, data management, etc. Presenting you a fantastic One Page Summary Annual Committee Report Template Department Of Entomology One Pager Documents. This piece is crafted on hours of research and professional design efforts to ensure you have the best resource. It is completely editable and its design allow you to rehash its elements to suit your needs. Get this One Page Summary Annual Committee Report Template Department Of Entomology One Pager Documents A4 One-pager now.

Business Intelligence And Big Data Analytics Data Analytics Change Management Gantt Pictures PDF
The slide shows the timeline for assessing and implementing the change in data analytics project. Deliver and pitch your topic in the best possible manner with this business intelligence and big data analytics data analytics change management gantt pictures pdf. Use them to share invaluable insights on change execution, assessments and solutioning, develop change management plan and impress your audience. This template can be altered and modified as per your expectations. So, grab it now.

Training Skills Plan For Data Analytics Program Business Analysis Modification Toolkit Template PDF
This slide illustrates the training plan by analyzing the key skills required data analytics project.Deliver and pitch your topic in the best possible manner with this Training Skills Plan For Data Analytics Program Business Analysis Modification Toolkit Template PDF. Use them to share invaluable insights on Business Stakeholders, Decisions Framework, Professional Marketing and impress your audience. This template can be altered and modified as per your expectations. So, grab it now.
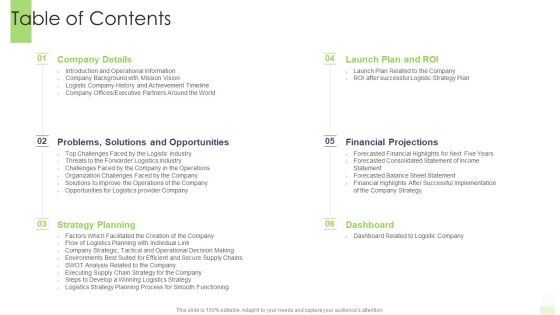
Developing Functional Logistic Plan Business Table Of Contents Ppt Infographics Information PDF
Deliver and pitch your topic in the best possible manner with this developing functional logistic plan business table of contents ppt infographics information pdf. Use them to share invaluable insights on strategy planning, dashboard, financial projections, opportunities and impress your audience. This template can be altered and modified as per your expectations. So, grab it now.

Role Of Logistics Strategy In Production Table Of Contents Demonstration PDF
Deliver an awe inspiring pitch with this creative role of logistics strategy in production table of contents demonstration pdf bundle. Topics like company details, opportunities, plan, financial projections, dashboard can be discussed with this completely editable template. It is available for immediate download depending on the needs and requirements of the user.

Business Strategy Development Process Business Management Kpis Metrics Clients Introduction PDF
Deliver an awe inspiring pitch with this creative business strategy development process business management kpis metrics clients introduction pdf bundle. Topics like delayed projects, ports, new clients, new orders can be discussed with this completely editable template. It is available for immediate download depending on the needs and requirements of the user.
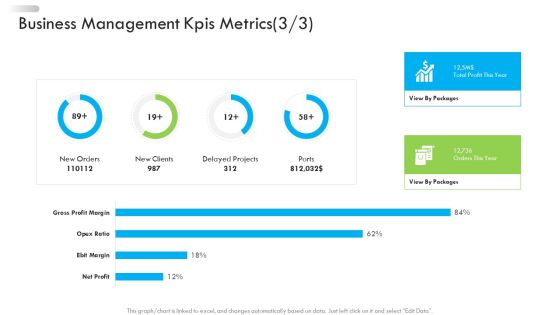
Enterprise Tactical Planning Enterprise Tactical Planning Business Management Kpis Metrics Ports Formats PDF
Deliver an awe-inspiring pitch with this creative enterprise tactical planning enterprise tactical planning business management kpis metrics ports formats pdf bundle. Topics like delayed projects, ports, new clients, gross profit margin, net profit can be discussed with this completely editable template. It is available for immediate download depending on the needs and requirements of the user.

0814 Stock Photo Service Tools In Red Box PowerPoint Slide
Define your ideas in inspiring manner with this professional image of red tool box. This image may be used to explain importance of tools for industrial project. Add this image in your presentations to visually support your content and express your thoughts.

Developing Organization Primary Data Storage Action Plan Budget Summary For Data Repository Expansion Pictures PDF
This slide represents the cost associated with each stage of the data repository expansion project. It also provides details regarding the percentage of the overall budget utilization at every step. Presenting developing organization primary data storage action plan budget summary for data repository expansion pictures pdf to provide visual cues and insights. Share and navigate important information on three stages that need your due attention. This template can be used to pitch topics like budget summary for data repository expansion and optimization project. In addtion, this PPT design contains high resolution images, graphics, etc, that are easily editable and available for immediate download.
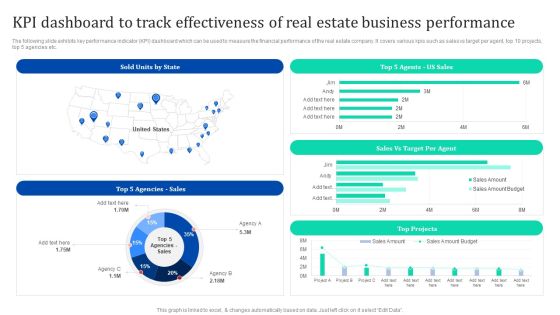
KPI Dashboard To Track Effectiveness Of Real Estate Business Enhancing Process Improvement By Regularly Themes PDF
The following slide exhibits key performance indicator KPI dashboard which can be used to measure the financial performance of the real estate company. It covers various kpis such as sales vs target per agent, top 10 projects, top 5 agencies etc. Welcome to our selection of the KPI Dashboard To Track Effectiveness Of Real Estate Business Enhancing Process Improvement By Regularly Themes PDF. These are designed to help you showcase your creativity and bring your sphere to life. Planning and Innovation are essential for any business that is just starting out. This collection contains the designs that you need for your everyday presentations. All of our PowerPoints are 100 parcent editable, so you can customize them to suit your needs. This multi-purpose template can be used in various situations. Grab these presentation templates today.
Forecast Analysis Technique IT Predictive Modeling Model Performance Tracking Dashboard Brochure PDF
This slide represents the predictive analytics model performance tracking dashboard, and it covers the details of total visitors, total buyers, total products added to the cart, filters by date and category, visitors to clients conversion rate, and so on. There are so many reasons you need a Forecast Analysis Technique IT Predictive Modeling Model Performance Tracking Dashboard Brochure PDF. The first reason is you can not spend time making everything from scratch, Thus, Slidegeeks has made presentation templates for you too. You can easily download these templates from our website easily.

Extreme Programming Methodology IT Communication Value Of Extreme Programming Pictures PDF
This slide explains the communication value of extreme programming and depicts that ineffective communication cause failed projects.This is a extreme programming methodology it communication value of extreme programming pictures pdf template with various stages. Focus and dispense information on six stages using this creative set, that comes with editable features. It contains large content boxes to add your information on topics like accomplishment of a project, reliant on communication, promotes regular You can also showcase facts, figures, and other relevant content using this PPT layout. Grab it now.

Calculator With Business Reports For Operational Efficiency Ppt Powerpoint Presentation Ideas Infographic Template
This is a calculator with business reports for operational efficiency ppt powerpoint presentation ideas infographic template. This is a four stage process. The stages in this process are business metrics, business kpi, business dashboard.

Financial Dashboard Powerpoint Slide
This is a financial dashboard powerpoint slide. This is a two stage process. The stages in this process are current assets, accounts receivable, prepaid expenses, short team investments.

Executing Risk Mitigation KPI Dashboard To Track Effectiveness Of Real Estate Rules PDF
The following slide exhibits key performance indicator KPI dashboard which can be used to measure the financial performance of the real estate company. It covers various KPIs such as sales vs target per agent, top 10 projects, top 5 agencies etc. Find highly impressive Executing Risk Mitigation KPI Dashboard To Track Effectiveness Of Real Estate Rules PDF on Slidegeeks to deliver a meaningful presentation. You can save an ample amount of time using these presentation templates. No need to worry to prepare everything from scratch because Slidegeeks experts have already done a huge research and work for you. You need to download Executing Risk Mitigation Kpi Dashboard To Track Effectiveness Of Real Estate Rules PDF for your upcoming presentation. All the presentation templates are 100 percent editable and you can change the color and personalize the content accordingly. Download now.

Active Ppt For Tenders And Bid Management Dashboard Microsoft PDF
This slide illustrates facts and figures related to bid management and PPT for tender submission. It includes active PPT for tenders, total PPT for tenders, awarded PPT for tenders, overdue PPT for tenders, etc. Presenting Active Ppt For Tenders And Bid Management Dashboard Microsoft PDF to dispense important information. This template comprises four stages. It also presents valuable insights into the topics including Project, Tender Name, Bid Invites. This is a completely customizable PowerPoint theme that can be put to use immediately. So, download it and address the topic impactfully.

30 60 90 Days Sales And Promotion Planning Valuation Icon Summary PDF
The given below slide showcases the required actions to improve companys sales and achieve the set targets. It also includes KPIs such as product, projection, and quality standards etc. Showcasing this set of slides titled 30 60 90 Days Sales And Promotion Planning Valuation Icon Summary PDF. The topics addressed in these templates are Quality Standards, Products, Projection. All the content presented in this PPT design is completely editable. Download it and make adjustments in color, background, font etc. as per your unique business setting.

Data Analytics Program Checklist Business Analysis Modification Toolkit Introduction PDF
This slide shows progress status of data analytics process which includes important key tasks that must be performed while initiating a project.This is a Data Analytics Program Checklist Business Analysis Modification Toolkit Introduction PDF template with various stages. Focus and dispense information on one stage using this creative set, that comes with editable features. It contains large content boxes to add your information on topics like Data Visualization, Data Modelling, Statistical Analysis. You can also showcase facts, figures, and other relevant content using this PPT layout. Grab it now.

Designing Great Client Experience Action Plan Calculate Net Promoter Score Ppt Gallery Ideas PDF
The Net Promoter Score measures the willingness of customers to recommend the companys products or services to others. It helps in gauging the customers overall satisfaction with the companys product or service. This is a designing great client experience action plan calculate net promoter score ppt gallery ideas pdf template with various stages. Focus and dispense information on one stages using this creative set, that comes with editable features. It contains large content boxes to add your information on topics like promoters, passives, detractors, customers, net promoter score. You can also showcase facts, figures, and other relevant content using this PPT layout. Grab it now.

Earning Potential And Financial Forecasting Dashboard Summary PDF
This slide illustrates facts and figures related to sales figures. It includes data of monthly revenue generation FY23, yearly revenue, expected revenue generation FY23 etc. Pitch your topic with ease and precision using this Earning Potential And Financial Forecasting Dashboard Summary PDF. This layout presents information on Sales Revenue, Expected Revenue, Product. It is also available for immediate download and adjustment. So, changes can be made in the color, design, graphics or any other component to create a unique layout.
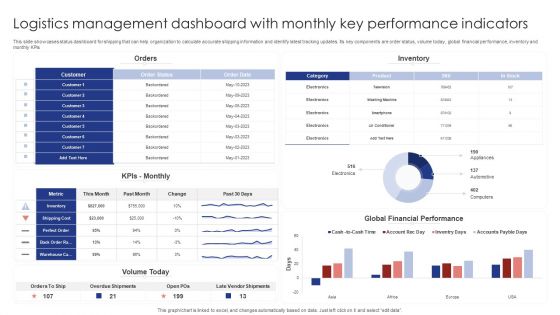
Logistics Management Dashboard With Monthly Key Performance Indicators Rules PDF
This slide showcases status dashboard for shipping that can help organization to calculate accurate shipping information and identify latest tracking updates. Its key components are order status, volume today, global financial performance, inventory and monthly KPIs. Pitch your topic with ease and precision using this Logistics Management Dashboard With Monthly Key Performance Indicators Rules PDF. This layout presents information on Orders, Inventory, Kpis Monthly. It is also available for immediate download and adjustment. So, changes can be made in the color, design, graphics or any other component to create a unique layout.
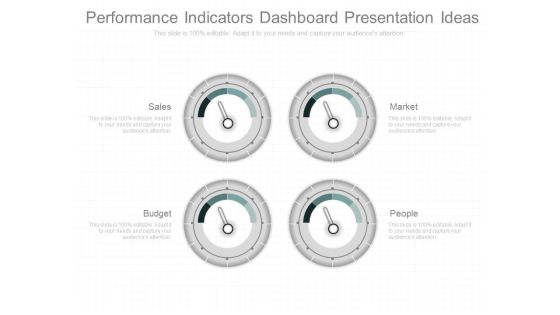
Performance Indicators Dashboard Presentation Ideas
This is a performance indicators dashboard presentation ideas. This is a four stage process. The stages in this process are sales, market, budget, people.

Sell Through Calculation Ppt Sample Presentations
This is a sell through calculation ppt sample presentations. This is a four stage process. The stages in this process are dashboard, business, graph.

Operational Dashboard Powerpoint Images
This is a operational dashboard powerpoint images. This is a four stage process. The stages in this process are cash and equivalents, revenue and expenses actual and forecast, store sales vs budget, expenses actual budget forecast.

Data Evaluation And Processing Toolkit Key Training Skills For Data Analytics Program Themes PDF
This slide highlights multiple skills required for conducting the data analytics project. It includes skkils such as python, data mining skills, predictive modeling skills and many more. There are so many reasons you need a Data Evaluation And Processing Toolkit Key Training Skills For Data Analytics Program Themes PDF. The first reason is you cant spend time making everything from scratch, Thus, Slidegeeks has made presentation templates for you too. You can easily download these templates from our website easily.

Stopwatch For Speed Calculation Powerpoint Slides
This innovative, stunningly beautiful dashboard has been designed for speed calculation. It contains graphics of stopwatch. This PowerPoint template helps to display your information in a useful, simple and orderly way.
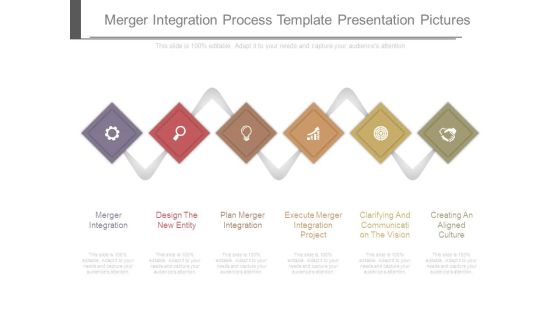
Merger Integration Process Template Presentation Pictures
This is a merger integration process template presentation pictures. This is a six stage process. The stages in this process are merger integration, design the new entity, plan merger integration, execute merger integration project, clarifying and communication the vision, creating an aligned culture.
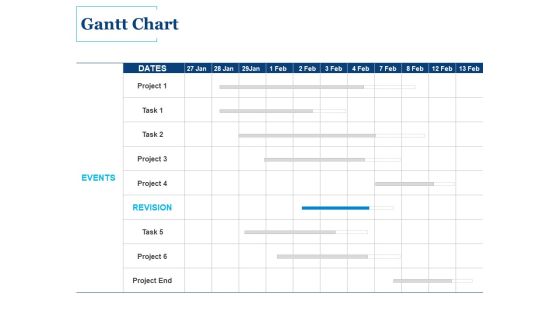
Gantt Chart Revision Ppt PowerPoint Presentation Pictures Professional
Presenting this set of slides with name gantt chart revision ppt powerpoint presentation pictures professional. The topics discussed in these slides are events, revision, project. This is a completely editable PowerPoint presentation and is available for immediate download. Download now and impress your audience.

Revenue Cycle Management Deal Engagement Model Tabular Form Pictures PDF
Deliver an awe-inspiring pitch with this creative revenue cycle management deal engagement model tabular form pictures pdf bundle. Topics like based model, iterative process, involvement project, characteristics can be discussed with this completely editable template. It is available for immediate download depending on the needs and requirements of the user.
Customer Satisfaction Index Calculation Diagram Ppt Sample
This is a customer satisfaction index calculation diagram ppt sample. This is a three stage process. The stages in this process are scale, efficiency, quality.

Sales Forecasting Analysis Powerpoint Slide Ideas
This is a sales forecasting analysis powerpoint slide ideas. This is a three stage process. The stages in this process are collect and analysis data, calculate sales forecast, determine forecasting method.
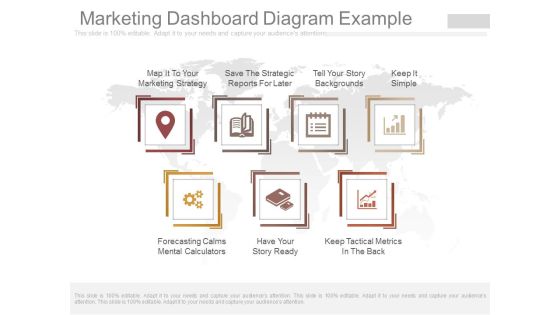
Marketing Dashboard Diagram Example
This is a marketing dashboard diagram example. This is a seven stage process. The stages in this process are map it to your marketing strategy, save the strategic reports for later, tell your story backgrounds, keep it simple, forecasting calms mental calculators, have your story ready, keep tactical metrics in the back.

Business Sales Predictive Report Icon Ppt Ideas Portrait PDF
Presenting business sales predictive report icon ppt ideas portrait pdf to dispense important information. This template comprises one stages. It also presents valuable insights into the topics including business sales predictive report icon. This is a completely customizable PowerPoint theme that can be put to use immediately. So, download it and address the topic impactfully.
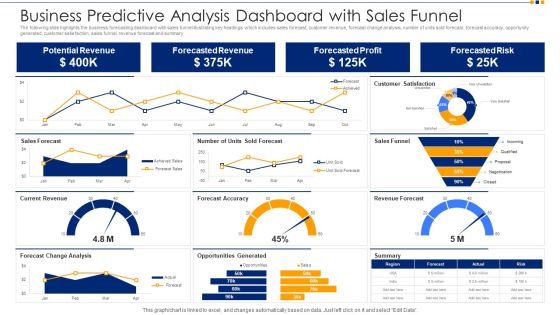
Business Predictive Analysis Dashboard With Sales Funnel Ppt Show Images PDF
The following slide highlights the business forecasting dashboard with sales funnel illustrating key headings which includes sales forecast, customer revenue, forecast change analysis, number of units sold forecast, forecast accuracy, opportunity generated, customer satisfaction, sales funnel, revenue forecast and summary. Pitch your topic with ease and precision using this business predictive analysis dashboard with sales funnel ppt show images pdf. This layout presents information on potential revenue, forecasted revenue, forecasted profit, forecasted risk. It is also available for immediate download and adjustment. So, changes can be made in the color, design, graphics or any other component to create a unique layout.

Monthly Real Estate Sales Dashboard For Real Estate Business Ppt PowerPoint Presentation File Skills PDF
This slide showcases property sales dashboard to track progress and communicate key development to management. It further includes details such as US sales, target per employee, top selling segments, etc. Showcasing this set of slides titled Monthly Real Estate Sales Dashboard For Real Estate Business Ppt PowerPoint Presentation File Skills PDF. The topics addressed in these templates are Top 5 Sales Segments, Sold Units By State, Top 10 Projects, Sales Vs Target Per Agent. All the content presented in this PPT design is completely editable. Download it and make adjustments in color, background, font etc. as per your unique business setting.

Business Intelligence And Big Data Analytics Program Checklist Demonstration PDF
This slide shows progress status of data analytics process which includes important key tasks that must be performed while initiating a project. This is a business intelligence and big data analytics program checklist demonstration pdf template with various stages. Focus and dispense information on one stages using this creative set, that comes with editable features. It contains large content boxes to add your information on topics like data collection, data analysis, statistical analysis, data modelling, data visualization. You can also showcase facts, figures, and other relevant content using this PPT layout. Grab it now.

Customer Orientation With Teamwork And Discipline Ppt PowerPoint Presentation Pictures Graphics
Presenting this set of slides with name customer orientation with teamwork and discipline ppt powerpoint presentation pictures graphics. This is a four stage process. The stages in this process are team work, education, discipline, balanced, cross project, team cooperation, communicate based on common understanding. This is a completely editable PowerPoint presentation and is available for immediate download. Download now and impress your audience.

Understanding Business REQM Current Problems Of The Firm Ppt Portfolio Pictures PDF
Presenting this set of slides with name understanding business reqm current problems of the firm ppt portfolio pictures pdf. The topics discussed in these slides are product, priorities, project, management, requirements. This is a completely editable PowerPoint presentation and is available for immediate download. Download now and impress your audience.

Property Investment Strategies Tie Ups With Real Estate Financers Ppt PowerPoint Presentation Pictures Background PDF
Deliver an awe inspiring pitch with this creative property investment strategies tie ups with real estate financers ppt powerpoint presentation pictures background pdf. bundle. Topics like rate of interest, what s its best for, occupied commercial, multifamily projects, experienced developers. can be discussed with this completely editable template. It is available for immediate download depending on the needs and requirements of the user.

Estimating Business Overall Kpi Metrics Dashboard Highlighting Organization Revenue Clipart PDF
The following slide outlines key performance indicator KPI dashboard showcasing various financial metrics of the organization. The key metrics are gross revenue, product revenue, service revenue, gross profit, net profit etc. Formulating a presentation can take up a lot of effort and time, so the content and message should always be the primary focus. The visuals of the PowerPoint can enhance the presenters message, so our Estimating Business Overall Kpi Metrics Dashboard Highlighting Organization Revenue Clipart PDF was created to help save time. Instead of worrying about the design, the presenter can concentrate on the message while our designers work on creating the ideal templates for whatever situation is needed. Slidegeeks has experts for everything from amazing designs to valuable content, we have put everything into Estimating Business Overall Kpi Metrics Dashboard Highlighting Organization Revenue Clipart PDF.
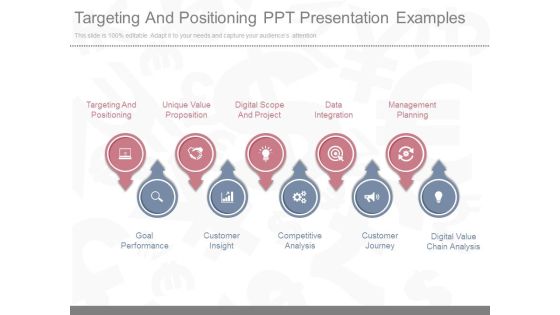
Targeting And Positioning Ppt Presentation Examples
This is a targeting and positioning ppt presentation examples. This is a ten stage process. The stages in this process are targeting and positioning, unique value proposition, digital scope and project, data integration, management planning, goal performance, customer insight, competitive analysis, customer journey, digital value chain analysis.
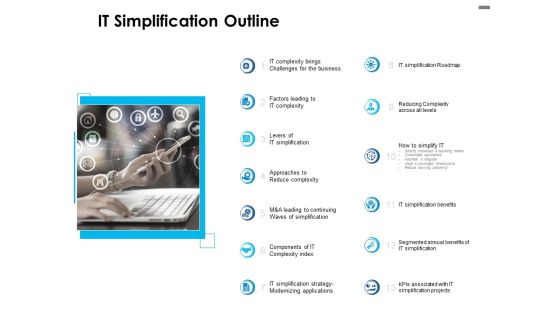
IT Simplification Outline Ppt PowerPoint Presentation Infographic Template Templates
Presenting this set of slides with name it simplification outline ppt powerpoint presentation infographic template templates. This is a thirteen stage process. The stages in this process are kpis associated it simplification projects, approaches reduce complexity, factors leading it complexity. This is a completely editable PowerPoint presentation and is available for immediate download. Download now and impress your audience.

Collection Of Quality Assurance PPT Quality Assurance Vs Control With Key Metrics Rules PDF
This slide distinguished quality assurance and quality control based on focus, character, starting point, tools and measures. It also covers information about key metrics of both. Deliver an awe inspiring pitch with this creative collection of quality assurance ppt quality assurance vs control with key metrics rules pdf bundle. Topics like planning, project, quality metrics, requirement can be discussed with this completely editable template. It is available for immediate download depending on the needs and requirements of the user.

Data Interpretation And Analysis Playbook Table Of Contents For Data Interpretation And Analysis Playbook Rules PDF
Deliver an awe inspiring pitch with this creative data interpretation and analysis playbook table of contents for data interpretation and analysis playbook rules pdf bundle. Topics like six critical elements, data management framework, solutions to the barriers, data management in bi projects, final thoughts can be discussed with this completely editable template. It is available for immediate download depending on the needs and requirements of the user.

Key Training Skills For Data Analytics Program Business Analysis Modification Toolkit Elements PDF
This slide highlights multiple skills required for conducting the data analytics project. It includes skills such as python, data mining skills, predictive modeling skills and many more.Presenting Key Training Skills For Data Analytics Program Business Analysis Modification Toolkit Elements PDF to provide visual cues and insights. Share and navigate important information on eleven stages that need your due attention. This template can be used to pitch topics like Statistical Analytics, Regression Analytics, Predictive Modelling. In addtion, this PPT design contains high resolution images, graphics, etc, that are easily editable and available for immediate download.

Business Intelligence And Big Data Analytics Work Streams With Its Roles And Responsibilities Ideas PDF
This slide highlights the key responsibilities, data work streams and. and data head roles for constructing data analytics project. Deliver an awe inspiring pitch with this creative business intelligence and big data analytics work streams with its roles and responsibilities ideas pdf bundle. Topics like data engineer, data analyst, responsibilities, data work streams can be discussed with this completely editable template. It is available for immediate download depending on the needs and requirements of the user.

Business Intelligence And Big Training Skills Plan For Data Analytics Program Template PDF
This slide illustrates the training plan by analyzing the key skills required data analytics project. Deliver an awe inspiring pitch with this creative business intelligence and big training skills plan for data analytics program template pdf bundle. Topics like analytics skills, training options, sql skills, business stakeholders can be discussed with this completely editable template. It is available for immediate download depending on the needs and requirements of the user.

Business Intelligence And Big Transformation Business Case And Data Analytical Elements PDF
This slide illustrates a detailed roadmap covering the key stages, priority tasks and action plan for the data analytics project. Deliver and pitch your topic in the best possible manner with this business intelligence and big transformation business case and data analytical elements pdf. Use them to share invaluable insights on business stage, analytical stage, capability stage, technological stage and impress your audience. This template can be altered and modified as per your expectations. So, grab it now.

Information Transformation Process Toolkit Data Analytics Change Management Gantt Chart Inspiration PDF
The slide shows the timeline for assessing and implementing the change in data analytics project. Presenting Information Transformation Process Toolkit Data Analytics Change Management Gantt Chart Inspiration PDF to provide visual cues and insights. Share and navigate important information on one stages that need your due attention. This template can be used to pitch topics like Design Documentation, Environment, Implement. In addtion, this PPT design contains high resolution images, graphics, etc, that are easily editable and available for immediate download.
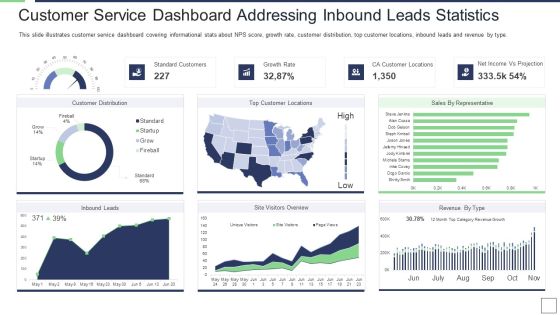
IT Service Incorporation And Administration Customer Service Dashboard Addressing Inbound Leads Statistics Clipart PDF
This slide illustrates customer service dashboard covering informational stats about NPS score, growth rate, customer distribution, top customer locations, inbound leads and revenue by type. Deliver an awe inspiring pitch with this creative it service incorporation and administration customer service dashboard addressing inbound leads statistics clipart pdf bundle. Topics like standard customers, growth rate, net income vs projection, ca customer locations can be discussed with this completely editable template. It is available for immediate download depending on the needs and requirements of the user.

Forecast Analysis Technique IT Methods Of Data Clustering In Predictive Modeling Formats PDF
This slide outlines the two primary information clustering methods used in the predictive analytics clustering model. The methods include K means and K nearest neighbor clustering, including the working of both approaches. Create an editable Forecast Analysis Technique IT Methods Of Data Clustering In Predictive Modeling Formats PDF that communicates your idea and engages your audience. Whether you are presenting a business or an educational presentation, pre designed presentation templates help save time. Forecast Analysis Technique IT Methods Of Data Clustering In Predictive Modeling Formats PDF is highly customizable and very easy to edit, covering many different styles from creative to business presentations. Slidegeeks has creative team members who have crafted amazing templates. So, go and get them without any delay.

Transformation Toolkit Competitive Intelligence Information Analysis Training Skills Plan For Data Analytics Program Ideas PDF
This slide illustrates the training plan by analyzing the key skills required data analytics project. Get a simple yet stunning designed Transformation Toolkit Competitive Intelligence Information Analysis Training Skills Plan For Data Analytics Program Ideas PDF. It is the best one to establish the tone in your meetings. It is an excellent way to make your presentations highly effective. So, download this PPT today from Slidegeeks and see the positive impacts. Our easy to edit Transformation Toolkit Competitive Intelligence Information Analysis Training Skills Plan For Data Analytics Program Ideas PDF can be your go to option for all upcoming conferences and meetings. So, what are you waiting for Grab this template today.

Predictive Data Model Predictive Analytics Model Performance Tracking Dashboard Themes PDF
This slide represents the predictive analytics model performance tracking dashboard, and it covers the details of total visitors, total buyers, total products added to the cart, filters by date and category, visitors to clients conversion rate, and so on. Find a pre-designed and impeccable Predictive Data Model Predictive Analytics Model Performance Tracking Dashboard Themes PDF. The templates can ace your presentation without additional effort. You can download these easy-to-edit presentation templates to make your presentation stand out from others. So, what are you waiting for Download the template from Slidegeeks today and give a unique touch to your presentation.

Comprehensive Analysis Of Different Data Lineage Classification Steps To Implement Data Lineage Designs PDF
This slide represents the steps to implement data lineage in business, and it includes finding key business drivers, onboarding the senior management on the project, scoping the project, and defining the scope. Find highly impressive Comprehensive Analysis Of Different Data Lineage Classification Steps To Implement Data Lineage Designs PDF on Slidegeeks to deliver a meaningful presentation. You can save an ample amount of time using these presentation templates. No need to worry to prepare everything from scratch because Slidegeeks experts have already done a huge research and work for you. You need to download Comprehensive Analysis Of Different Data Lineage Classification Steps To Implement Data Lineage Designs PDF for your upcoming presentation. All the presentation templates are 100 percent editable and you can change the color and personalize the content accordingly. Download now

System Analysis And Design Audit Checklist Ppt Layouts Pictures PDF
This slide shows system analysis and designing timeline with key phases. It provides information about gathering requirements, data preparation, analysis, modeling and finalizing project. Presenting System Analysis And Design Audit Checklist Ppt Layouts Pictures PDF to dispense important information. This template comprises one stages. It also presents valuable insights into the topics including JAD And Prototype, Does Database Design, Supports Requirements. This is a completely customizable PowerPoint theme that can be put to use immediately. So, download it and address the topic impactfully.

Forecast Analysis Technique IT Regression Model For Predictive Modeling Mockup PDF
This slide represents the regression model of predictive analytics that is most commonly used in statistical analysis. This model is used to identify patterns in large amounts of data and works by calculating a formula. Crafting an eye catching presentation has never been more straightforward. Let your presentation shine with this tasteful yet straightforward Forecast Analysis Technique IT Regression Model For Predictive Modeling Mockup PDF template. It offers a minimalistic and classy look that is great for making a statement. The colors have been employed intelligently to add a bit of playfulness while still remaining professional. Construct the ideal Forecast Analysis Technique IT Regression Model For Predictive Modeling Mockup PDF that effortlessly grabs the attention of your audience Begin now and be certain to wow your customers.

Predictive Data Model Introduction To Predictive Analytics Technology Introduction PDF
This slide represents the predictive analytics introduction that is used for forecasts action, behaviors, and trends using recent and past information. It performs the operations such as data mining, text analytics, statistics, and modeling on structured and unstructured data. Find highly impressive Predictive Data Model Introduction To Predictive Analytics Technology Introduction PDF on Slidegeeks to deliver a meaningful presentation. You can save an ample amount of time using these presentation templates. No need to worry to prepare everything from scratch because Slidegeeks experts have already done a huge research and work for you. You need to download Predictive Data Model Introduction To Predictive Analytics Technology Introduction PDF for your upcoming presentation. All the presentation templates are 100 percent editable and you can change the color and personalize the content accordingly. Download now

Business Assessment Outline Business Management KPIS Metrics Ratio Ppt Model Layout Ideas PDF
Deliver and pitch your topic in the best possible manner with this business assessment outline business management kpis metrics ratio ppt model layout ideas pdf. Use them to share invaluable insights on gross profit margin, opex ratio, ebit margin, net profit, new orders, delayed projects, new clients and impress your audience. This template can be altered and modified as per your expectations. So, grab it now.
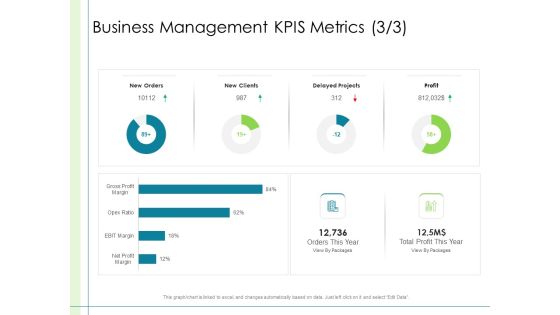
In Depth Business Assessment Business Management Kpis Metrics Profit Ppt PowerPoint Presentation Show Layouts PDF
Deliver and pitch your topic in the best possible manner with this in depth business assessment business management kpis metrics profit ppt powerpoint presentation show layouts pdf. Use them to share invaluable insights on gross profit margin, opex ratio, ebit margin, net profit, new orders, delayed projects, new clients and impress your audience. This template can be altered and modified as per your expectations. So, grab it now.

Administrative Regulation Business Management KPIs Metrics Ration Ppt PowerPoint Presentation Professional Background Image PDF
Deliver and pitch your topic in the best possible manner with this administrative regulation business management kpis metrics ration ppt powerpoint presentation professional background image pdf. Use them to share invaluable insights on gross profit margin, opex ratio, ebit margin, net profit, new orders, delayed projects, new clients and impress your audience. This template can be altered and modified as per your expectations. So, grab it now.

Business Revenue And Sales Predictive Dashboard Ppt Inspiration Background Designs PDF
The following slide highlights the business and sales forecasting dashboard illustrating key headings which includes revenue forecast by type, unit sold forecast, forecasting accuracy, sales by type, average sales price trend and revenue trend. Pitch your topic with ease and precision using this business revenue and sales predictive dashboard ppt inspiration background designs pdf. This layout presents information on revenue forecast by type, units sold forecast, forecasting accuracy, average sales price trend, revenue trend. It is also available for immediate download and adjustment. So, changes can be made in the color, design, graphics or any other component to create a unique layout.

Predictive Data Model Overview Of Predictive Analytics Framework Summary PDF
This slide outlines the overview of the predictive analytics framework and its components, including wide area network, OpenFlow, forecasting, software-defined networking controller, predictive models, elastic cluster, data acquisition and application servers. Coming up with a presentation necessitates that the majority of the effort goes into the content and the message you intend to convey. The visuals of a PowerPoint presentation can only be effective if it supplements and supports the story that is being told. Keeping this in mind our experts created Predictive Data Model Overview Of Predictive Analytics Framework Summary PDF to reduce the time that goes into designing the presentation. This way, you can concentrate on the message while our designers take care of providing you with the right template for the situation.

Agenda Data Management Solutions Download PDF
This is a Agenda Data Management Solutions Download PDF template with various stages. Focus and dispense information on six stages using this creative set, that comes with editable features. It contains large content boxes to add your information on topics like Governance Requirements, Minimizing Data Movement, Analysis Project. You can also showcase facts, figures, and other relevant content using this PPT layout. Grab it now.
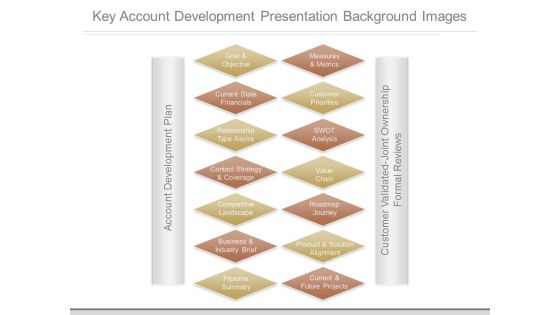
Key Account Development Presentation Background Images
This is a key account development presentation background images. This is a fourteen stage process. The stages in this process are goal and objective, current state financials, relationship type aspire, contact strategy and coverage, competitive landscape, business and industry brief, pipeline summary, measures and metrics, customer priorities, swot analysis, value chain, roadmap journey, product and solution alignment, current and future projects, account development plan, customer validated joint ownership formal reviews.

Information Transformation Process Toolkit Data Analytics Business Case And Roadmap Professional PDF
This slide shows the business processes and key deliverables for developing the data analytics BI project. It starts with assessing and document the current state to identify priorities, analyze the process and ends at developing roadmap to achieve the outcomes. This is a Information Transformation Process Toolkit Data Analytics Business Case And Roadmap Professional PDF template with various stages. Focus and dispense information on five stages using this creative set, that comes with editable features. It contains large content boxes to add your information on topics like Identify Business Priorities, Analysis Of User Base, Process Analysis. You can also showcase facts, figures, and other relevant content using this PPT layout. Grab it now.

Choosing Best Partner Relationship Management Software Ideas PDF
This slide covers the business partners dashboard which covers active projects, issues found, root cause analysis, impact analysis and top vulnerabilities. Deliver an awe inspiring pitch with this creative choosing best partner relationship management software ideas pdf bundle. Topics like impact analysis, vulnerabilities, root cause analysis can be discussed with this completely editable template. It is available for immediate download depending on the needs and requirements of the user.

Table Of Contents For Developer Operations Automated Tools And Initiatives IT Infographics PDF
Presenting table of contents for developer operations automated tools and initiatives it infographics pdf to provide visual cues and insights. Share and navigate important information on seven stages that need your due attention. This template can be used to pitch topics like employee training schedule and cost, previous projects, market analysis, business performance, kpi dashboard. In addtion, this PPT design contains high resolution images, graphics, etc, that are easily editable and available for immediate download.

Google Cloud Console IT Ways To Interact With The Google Cloud Services Google Cloud Console Ppt Ideas Gridlines PDF
This slide represents the Google cloud console architecture and how it keeps track of the activities performed on services and resources. Deliver an awe inspiring pitch with this creative google cloud console it ways to interact with the google cloud services google cloud console ppt ideas gridlines pdf bundle. Topics like resources, dashboard, google cloud projects, graphical user interface can be discussed with this completely editable template. It is available for immediate download depending on the needs and requirements of the user.

Corporate Sales Capability And Financial Forecast Dashboard Download PDF
This slide illustrates facts and figures related to expected revenue generation in upcoming months in a corporation. It includes expected sales revenue for FY23, yearly sales revenue etc. Showcasing this set of slides titled Corporate Sales Capability And Financial Forecast Dashboard Download PDF. The topics addressed in these templates are Corporate Sales, Capability And Financial, Forecast Dashboard. All the content presented in this PPT design is completely editable. Download it and make adjustments in color, background, font etc. as per your unique business setting

Actual And Forecasted Income And Expenses Analysis Dashboard Portrait PDF
This slide shows the dashboard representing the comparison between the actual and forecasted monthly income and expenses of an organization. It also shows the report overview of monthly income and expenses of organization. Showcasing this set of slides titled Actual And Forecasted Income And Expenses Analysis Dashboard Portrait PDF. The topics addressed in these templates are Expenses, Income, Expenses. All the content presented in this PPT design is completely editable. Download it and make adjustments in color, background, font etc. as per your unique business setting.

Commodity Up Selling Table Of Content Ppt Show Ideas PDF
Presenting this set of slides with name commodity up selling table of content ppt show ideas pdf. This is a ten stage process. The stages in this process are problem statement, financial highlights, product and services, industry scenario, training, sales projection, challenges and solutions, kpi dashboard. This is a completely editable PowerPoint presentation and is available for immediate download. Download now and impress your audience.

Dashboard For Big Healthcare Data Analytics Graphics PDF
This slide showcase the dashboard for big data analytics in healthcare. It includes elements such as bed occupancy rate, patient turnover rate, efficiency and costs, missed and cancelled appointment rate. Showcasing this set of slides titled Dashboard For Big Healthcare Data Analytics Graphics PDF. The topics addressed in these templates are Satisfaction Service Indicators, Occupancy, Forecasted Patient Turnover. All the content presented in this PPT design is completely editable. Download it and make adjustments in color, background, font etc. as per your unique business setting.

Departments Of Visualization Research Lack Of Data Understanding Faced By The Company Download PDF
This slide depicts the different issues faced by the company in a project, but the lack of data understanding is the primary concern among all.Deliver an awe inspiring pitch with this creative Departments Of Visualization Research Lack Of Data Understanding Faced By The Company Download PDF bundle. Topics like Analytics Is Experienced, Lack Of Understanding, Analytics And Data Science can be discussed with this completely editable template. It is available for immediate download depending on the needs and requirements of the user.

Toolkit For Data Science And Analytics Transition Data Analytics Change Management Gantt Chart Portrait PDF
The slide shows the timeline for assessing and implementing the change in data analytics project. Get a simple yet stunning designed Toolkit For Data Science And Analytics Transition Data Analytics Change Management Gantt Chart Portrait PDF It is the best one to establish the tone in your meetings. It is an excellent way to make your presentations highly effective. So, download this PPT today from Slidegeeks and see the positive impacts. Our easy to edit Toolkit For Data Science And Analytics Transition Data Analytics Change Management Gantt Chart Portrait PDF can be your go to option for all upcoming conferences and meetings. So, what are you waiting for Grab this template today.

Business Intelligence And Big Data Analytics Business Case And Roadmap For Data Analytics Designs PDF
This slide shows the detailed document covering the problem statement, companys vision, key processes and outcomes for the data analytics project. Presenting business intelligence and big data analytics business case and roadmap for data analytics designs pdf to provide visual cues and insights. Share and navigate important information on one stages that need your due attention. This template can be used to pitch topics like problem statement, vision and objectives, process, analytical capabilities, key owners. In addtion, this PPT design contains high resolution images, graphics, etc, that are easily editable and available for immediate download.

Toolkit For Data Science And Analytics Transition Data Analytics Program Checklist Portrait PDF
This slide shows progress status of data analytics process which includes important key tasks that must be performed while initiating a project. From laying roadmaps to briefing everything in detail, our templates are perfect for you. You can set the stage with your presentation slides. All you have to do is download these easy to edit and customizable templates. Toolkit For Data Science And Analytics Transition Data Analytics Program Checklist Portrait PDF will help you deliver an outstanding performance that everyone would remember and praise you for. Do download this presentation today.

Toolkit For Data Science And Analytics Transition Training Skills Plan For Data Analytics Program Summary PDF
This slide illustrates the training plan by analyzing the key skills required data analytics project. Make sure to capture your audiences attention in your business displays with our gratis customizable Toolkit For Data Science And Analytics Transition Training Skills Plan For Data Analytics Program Summary PDF. These are great for business strategies, office conferences, capital raising or task suggestions. If you desire to acquire more customers for your tech business and ensure they stay satisfied, create your own sales presentation with these plain slides.
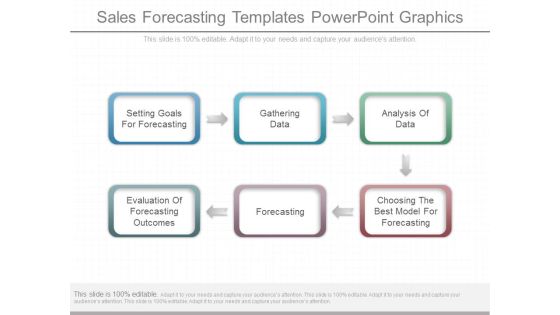
Sales Forecasting Templates Powerpoint Graphics
This is a sales forecasting templates powerpoint graphics. This is a six stage process. The stages in this process are setting goals for forecasting, gathering data, analysis of data, evaluation of forecasting outcomes, forecasting, choosing the best model for forecasting.

Financial Metrics And Kpi Template Presentation Visual Aids
This is a financial metrics and kpi template presentation visual aids. This is a three stage process. The stages in this process are operating profit last 12 months, total income act vs forecast between 2009 and 2010, income by qtr by tr between 2007 and 2010.

Predictive Data Model Regression Model For Predictive Analytics Sample PDF
This slide represents the regression model of predictive analytics that is most commonly used in statistical analysis. This model is used to identify patterns in large amounts of data and works by calculating a formula. There are so many reasons you need a Predictive Data Model Regression Model For Predictive Analytics Sample PDF. The first reason is you can not spend time making everything from scratch, Thus, Slidegeeks has made presentation templates for you too. You can easily download these templates from our website easily.
 Home
Home