Project Review

Ppt Templates Past History And Future Planning Trend Time Line PowerPoint Slides Editable
PPT_templates_Past_History_and_Future_Planning_trend_Time_Line_PowerPoint_Slides_Editable-These high quality powerpoint pre-designed slides and powerpoint templates have been carefully created by our professional team to help you impress your audience. All slides have been created and are 100% editable in powerpoint. Each and every property of any graphic - color, size, orientation, shading, outline etc. can be modified to help you build an effective powerpoint presentation. Any text can be entered at any point in the powerpoint template or slide. Simply DOWNLOAD, TYPE and PRESENT! These PowerPoint presentation slides can be used to represent themes relating to --account, arrow, arrows, away, box, business, chart, choice, choose, concept, concepts, consultation, corporate, design, diagram, direction, elements, flow, follow, follows, future, group, grow, increase, lines, many, month, move, past, period, phase, project, report, rise, row, step, success, text, time, timeline, today, up, way, ways, work, year-PPT_templates_Past_History_and_Future_Planning_trend_Time_Line_PowerPoint_Slides_Editable

Subsequent Arrow Process 6 Stages Flowcharts PowerPoint Slides
We present our subsequent arrow process 6 stages flowcharts PowerPoint Slides. Use our Spheres PowerPoint Templates because, your foot is on the pedal and your company is purring along smoothly. Use our Arrows PowerPoint Templates because, Our Template designs are State of the Art. Use our Symbol PowerPoint Templates because, All elements of the venture are equally critical. Use our Marketing PowerPoint Templates because, our presentation designs are for those on the go. Use our Process and Flows PowerPoint Templates because, Our Template designs are State of the Art. Use these PowerPoint slides for presentations relating to Account, Arrow, Arrows, Away, Box, Business, Chart, Choice, Choose, Concept, Concepts, Consultation, Corporate, Design, Diagram, Direction, Elements, Flow, Follow, Follows, Future, Group, Grow, Increase, Lines, Many, Month, Move, Past, Period, Phase, Project, Report, Rise, Row, Step, Success, Spheres, Text, Time, Timeline, Today, Up, Way, Ways, Work, Year. The prominent colors used in the PowerPoint template are Green, Gray, and Black

Sample Asset Valuation Report Excess Earnings Brand Value Estimation Guide Designs PDF
Mentioned slide highlights information about ABC corporations valuation using excess earnings approach. It also includes details about sales and marketing costs, contributory asset charges and tax basis.Boost your pitch with our creative Sample Asset Valuation Report Excess Earnings Brand Value Estimation Guide Designs PDF. Deliver an awe-inspiring pitch that will mesmerize everyone. Using these presentation templates you will surely catch everyones attention. You can browse the ppts collection on our website. We have researchers who are experts at creating the right content for the templates. So you do not have to invest time in any additional work. Just grab the template now and use them.
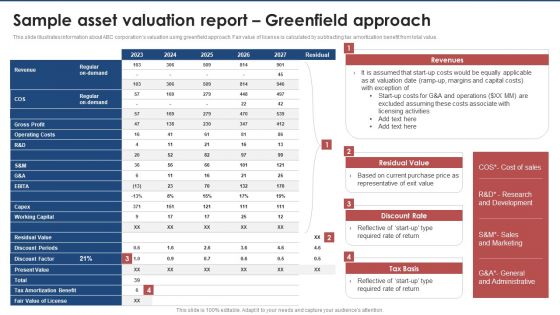
Sample Asset Valuation Report Greenfield Approach Brand Value Estimation Guide Brochure PDF
This slide highlights information about ABC corporations valuation using finite life approach. It also includes details about development costs, customer acquisition costs and discount rate.Slidegeeks is one of the best resources for PowerPoint templates. You can download easily and regulate Sample Asset Valuation Report Greenfield Approach Brand Value Estimation Guide Brochure PDF for your personal presentations from our wonderful collection. A few clicks is all it takes to discover and get the most relevant and appropriate templates. Use our Templates to add a unique zing and appeal to your presentation and meetings. All the slides are easy to edit and you can use them even for advertisement purposes.

Guide To Develop And Estimate Brand Value Sample Asset Valuation Report Finite Life Formats PDF
This slide highlights information about ABC corporations valuation using finite life approach. It also includes details about development costs, customer acquisition costs and discount rate.From laying roadmaps to briefing everything in detail, our templates are perfect for you. You can set the stage with your presentation slides. All you have to do is download these easy-to-edit and customizable templates. Guide To Develop And Estimate Brand Value Sample Asset Valuation Report Finite Life Formats PDF will help you deliver an outstanding performance that everyone would remember and praise you for. Do download this presentation today.

Weekly Marketing Investment Report Dashboard Ideas PDF
This slide illustrates the overview of advertising expenditure weekly performance metrics. It incorporate total budget spent and estimated for advertising, estimated and actual registration, revenue, conversion metrics rates etc. Showcasing this set of slides titled Weekly Marketing Investment Report Dashboard Ideas PDF. The topics addressed in these templates are Conversion Metrics, Quality Of Traffic, Quality Of Transaction. All the content presented in this PPT design is completely editable. Download it and make adjustments in color, background, font etc. as per your unique business setting.

Sample Asset Valuation Report Content Cost Approach Brand Value Estimation Guide Summary PDF
Mentioned slide provides information about ABC corporations valuation using content cost approach. It also includes details about economic obsolescence and depreciated replacement cost.Do you know about Slidesgeeks Sample Asset Valuation Report Content Cost Approach Brand Value Estimation Guide Summary PDF These are perfect for delivering any kind od presentation. Using it, create PowerPoint presentations that communicate your ideas and engage audiences. Save time and effort by using our pre-designed presentation templates that are perfect for a wide range of topic. Our vast selection of designs covers a range of styles, from creative to business, and are all highly customizable and easy to edit. Download as a PowerPoint template or use them as Google Slides themes.

Guide To Develop And Estimate Brand Value Sample Asset Valuation Report Historical Operating Results Background PDF
Following slide showcases information about historical operating results of ABC corporation with the help of cashflow statement and statement of financial position.Slidegeeks is here to make your presentations a breeze with Guide To Develop And Estimate Brand Value Sample Asset Valuation Report Historical Operating Results Background PDF With our easy-to-use and customizable templates, you can focus on delivering your ideas rather than worrying about formatting. With a variety of designs to choose from, you are sure to find one that suits your needs. And with animations and unique photos, illustrations, and fonts, you can make your presentation pop. So whether you are giving a sales pitch or presenting to the board, make sure to check out Slidegeeks first.
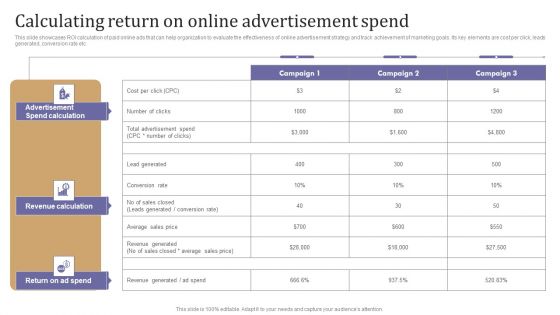
Calculating Return On Online Advertisement Spend Demonstration PDF
This slide showcases ROI calculation of paid online ads that can help organization to evaluate the effectiveness of online advertisement strategy and track achievement of marketing goals. Its key elements are cost per click, leads generated, conversion rate etc. Here you can discover an assortment of the finest PowerPoint and Google Slides templates. With these templates, you can create presentations for a variety of purposes while simultaneously providing your audience with an eye catching visual experience. Download Calculating Return On Online Advertisement Spend Demonstration PDF to deliver an impeccable presentation. These templates will make your job of preparing presentations much quicker, yet still, maintain a high level of quality. Slidegeeks has experienced researchers who prepare these templates and write high quality content for you. Later on, you can personalize the content by editing the Calculating Return On Online Advertisement Spend Demonstration PDF.

Expense Budget Plan Allocation For Construction Of Educational Institution Report Demonstration PDF
This slide covers the estimation for budget allocated for construction of educational institution. It includes different source of funds and budget for construction materials, transportation, labour, etc.Persuade your audience using this Expense Budget Plan Allocation For Construction Of Educational Institution Report Demonstration PDF This PPT design covers one stage, thus making it a great tool to use. It also caters to a variety of topics including Construction Items, Transportation, Income Source Download this PPT design now to present a convincing pitch that not only emphasizes the topic but also showcases your presentation skills.

Calculating Return On Investment For Brand And Business Clipart PDF
This slide provides an overview of the ROI of various activities conducted by marketers to achieve the set objectives. Major techniques covered are SEO, SEM, social media, influencer, affiliate, PPC, email, content and mobile marketing. Crafting an eye catching presentation has never been more straightforward. Let your presentation shine with this tasteful yet straightforward Calculating Return On Investment For Brand And Business Clipart PDF template. It offers a minimalistic and classy look that is great for making a statement. The colors have been employed intelligently to add a bit of playfulness while still remaining professional. Construct the ideal Calculating Return On Investment For Brand And Business Clipart PDF that effortlessly grabs the attention of your audience Begin now and be certain to wow your customers.

How To Calculate Cost Of Disengaged Employees Ppt Layouts Infographic Template PDF
This template covers a tool to estimate the cost of disengaged employees in your organization. This provides companies with a rough estimate of the minimum annual benefit an organization can achieve in their leadership strength by applying blue ocean leadership. Slidegeeks has constructed How To Calculate Cost Of Disengaged Employees Ppt Layouts Infographic Template PDF after conducting extensive research and examination. These presentation templates are constantly being generated and modified based on user preferences and critiques from editors. Here, you will find the most attractive templates for a range of purposes while taking into account ratings and remarks from users regarding the content. This is an excellent jumping off point to explore our content and will give new users an insight into our top notch PowerPoint Templates.
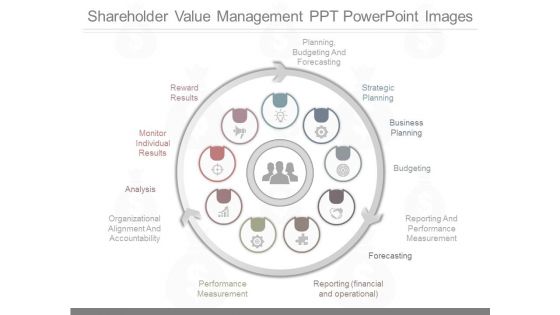
Shareholder Value Management Ppt Powerpoint Images
This is a shareholder value management ppt powerpoint images. This is a nine stage process. The stages in this process are planning, budgeting and forecasting, strategic planning, business planning, budgeting, reporting and performance measurement, forecasting, reporting financial and operational, performance measurement, organizational alignment and accountability, analysis, monitor individual results, reward results.

Integrated The Key Performance Powerpoint Slide Ideas
This is a integrated the key performance powerpoint slide ideas. This is a three stage process. The stages in this process are shareholder value, reward results, monitor individual results, analysis, performance measurement, reporting, business planning, budgeting, forecasting, strategic planning, planning, budgeting and forecasting, reporting and performance measurement, organizational alignment and accountability.
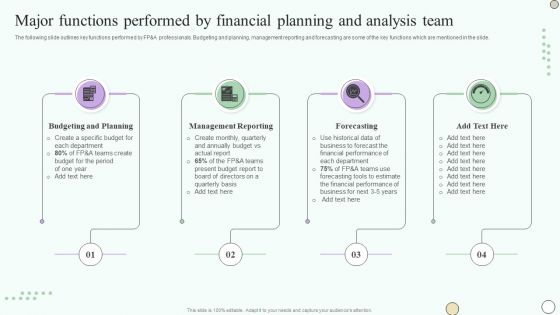
Estimating Business Overall Major Functions Performed By Financial Planning And Analysis Sample PDF
The following slide outlines key functions performed by FPandA professionals. Budgeting and planning, management reporting and forecasting are some of the key functions which are mentioned in the slide. This modern and well-arranged Estimating Business Overall Major Functions Performed By Financial Planning And Analysis Sample PDF provides lots of creative possibilities. It is very simple to customize and edit with the Powerpoint Software. Just drag and drop your pictures into the shapes. All facets of this template can be edited with Powerpoint, no extra software is necessary. Add your own material, put your images in the places assigned for them, adjust the colors, and then you can show your slides to the world, with an animated slide included.

Quarterly Cost Variance Analysis With Maintenance Metrics Dashboard Information PDF
The following slide depicts a maintenance KPI dashboard to have useful insights for effective decision making. It includes key performance areas such as quarterly cost variance, scrap, quarterly run time variance analysis etc. Pitch your topic with ease and precision using this Quarterly Cost Variance Analysis With Maintenance Metrics Dashboard Information PDF. This layout presents information on Production, Budgeted Cost, Planned Run Time, Actual Run Time. It is also available for immediate download and adjustment. So, changes can be made in the color, design, graphics or any other component to create a unique layout.
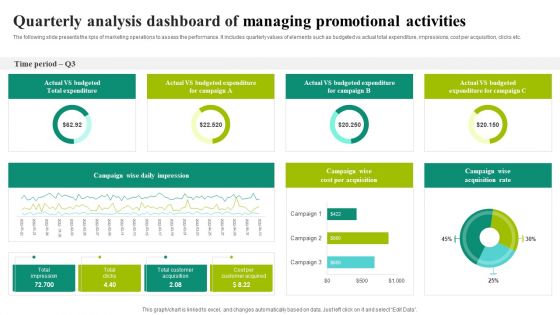
Quarterly Analysis Dashboard Of Managing Promotional Activities Ideas PDF
The following slide presents the kpis of marketing operations to assess the performance. It includes quarterly values of elements such as budgeted vs actual total expenditure, impressions, cost per acquisition, clicks etc. Showcasing this set of slides titled Quarterly Analysis Dashboard Of Managing Promotional Activities Ideas PDF. The topics addressed in these templates are Campaign Wise, Daily Impression, Total Impression, Total Clicks. All the content presented in this PPT design is completely editable. Download it and make adjustments in color, background, font etc. as per your unique business setting.

Power Point Arrows 5 Stages 3d Curved Process Ppt PowerPoint Slides
3d, achievement, aim, arrow, background, blue, career, chart, communication, competition, concept, curve, design, development, direction, education, financial, forecast, forward, glossy, graph, graphic, group, growth, icon, illustration, increase, investment, moving, outlook, path, plan, price, profit, progress, race, sales, start, success, target, team, three, turn, up, upwards, win, winner

Implementing Digital Transformation Addressing The Priority Deliverables To Achieve Infographics PDF
This slide showcases information about the deliverables to accomplish world class data infrastructure. Activities to perform, budget, duration, key partners, owner, status and KPIs are the key information covered in the slide. Get a simple yet stunning designed Implementing Digital Transformation Addressing The Priority Deliverables To Achieve Infographics PDF. It is the best one to establish the tone in your meetings. It is an excellent way to make your presentations highly effective. So, download this PPT today from Slidegeeks and see the positive impacts. Our easy-to-edit Implementing Digital Transformation Addressing The Priority Deliverables To Achieve Infographics PDF can be your go-to option for all upcoming conferences and meetings. So, what are you waiting for Grab this template today.
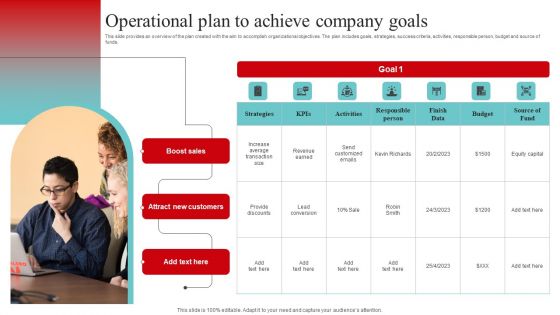
Strategic And Operational Strategy Operational Plan To Achieve Company Goals Diagrams PDF
This slide provides an overview of the plan created with the aim to accomplish organizational objectives. The plan includes goals, strategies, success criteria, activities, responsible person, budget and source of funds. Slidegeeks has constructed Strategic And Operational Strategy Operational Plan To Achieve Company Goals Diagrams PDF after conducting extensive research and examination. These presentation templates are constantly being generated and modified based on user preferences and critiques from editors. Here, you will find the most attractive templates for a range of purposes while taking into account ratings and remarks from users regarding the content. This is an excellent jumping off point to explore our content and will give new users an insight into our top notch PowerPoint Templates.

Marketing Planning Process To Achieve Company Goals Marketing Strategy Graphics PDF
This slide showcases the steps involved in marketing planning to accomplish set targets. The steps covered are determine goals, perform SWOT analysis, create budget, define roles, etc. Slidegeeks is here to make your presentations a breeze with Marketing Planning Process To Achieve Company Goals Marketing Strategy Graphics PDF With our easy to use and customizable templates, you can focus on delivering your ideas rather than worrying about formatting. With a variety of designs to choose from, you are sure to find one that suits your needs. And with animations and unique photos, illustrations, and fonts, you can make your presentation pop. So whether you are giving a sales pitch or presenting to the board, make sure to check out Slidegeeks first.

Addressing The Priority Deliverables To Achieve World Class Data Infrastructure Information PDF
Purpose of this slide is to provide information about the deliverables to accomplish online community. It includes details about activities to perform, budget, duration, key partners, owner, status and KPIs. Are you in need of a template that can accommodate all of your creative concepts This one is crafted professionally and can be altered to fit any style. Use it with Google Slides or PowerPoint. Include striking photographs, symbols, depictions, and other visuals. Fill, move around, or remove text boxes as desired. Test out color palettes and font mixtures. Edit and save your work, or work with colleagues. Download Addressing The Priority Deliverables To Achieve World Class Data Infrastructure Information PDF and observe how to make your presentation outstanding. Give an impeccable presentation to your group and make your presentation unforgettable.

Customer 360 Overview Predictive Analytics Results Ppt Inspiration Infographics PDF
Presenting this set of slides with name customer 360 overview predictive analytics results ppt inspiration infographics pdf. The topics discussed in these slides are achieve competitive advantage, new revenue opportunities, increased profitability, increased customer service, operational efficiencies. This is a completely editable PowerPoint presentation and is available for immediate download. Download now and impress your audience.
Icons Slide For Predictive Data Model Inspiration PDF

Predictive Analysis Value Chain Diagram Powerpoint Slide Themes
This is a predictive analysis value chain diagram powerpoint slide themes. This is a four stage process. The stages in this process are what is happening now, what is going happen in future, what happened why that happened, data, predictive analytics, reporting analysis, monitoring.

Managing Customer Experience Database Sales Status Report Deal Structure PDF
Deliver and pitch your topic in the best possible manner with this managing customer experience database sales status report deal structure pdf. Use them to share invaluable insights on finance, action, additional info, probability of deal, weighted forecast and impress your audience. This template can be altered and modified as per your expectations. So, grab it now.

Agriculture Marketing Strategy To Improve Revenue Performance Budget Allocation For Farm Marketing Plan Sample PDF
This slide provides an overview of the budget allocated to online and offline channels on quarterly basis. It further includes key takeaways that are maximum budget is allocated in Q4 on offline channels. There are so many reasons you need a Agriculture Marketing Strategy To Improve Revenue Performance Budget Allocation For Farm Marketing Plan Sample PDF. The first reason is you cannot spend time making everything from scratch, Thus, Slidegeeks has made presentation templates for you too. You can easily download these templates from our website easily.

Subsequent Arrow Process 6 Stages Network Mapping Freeware PowerPoint Slides
We present our subsequent arrow process 6 stages network mapping freeware PowerPoint Slides. Use our Spheres PowerPoint Templates because, you have the basic goal in mind. Use our Arrows PowerPoint Templates because; inform them of the various means they have to achieve them. Use our Symbol PowerPoint Templates because, which of late have been proving to be a hassle. Use our Marketing PowerPoint Templates because; inform them of the various means they have to achieve them. Use our Process and Flows PowerPoint Templates because, Explain the various related aspects of these varied tracks and how they will, on hitting their own targets, cumulatively contribute to hitting GOLD. Use these PowerPoint slides for presentations relating to Account, Arrow, Arrows, Away, Box, Business, Chart, Choice, Choose, Concept, Concepts, Consultation, Corporate, Design, Diagram, Direction, Elements, Flow, Follow, Follows, Future, Group, Grow, Increase, Lines, Many, Month, Move, Past, Period, Phase, Project, Report, Rise, Row, Step, Success, Spheres, Text, Time, Timeline, Today, Up, Way, Ways, Work, Year. The prominent colors used in the PowerPoint template are Green, Gray, and Black
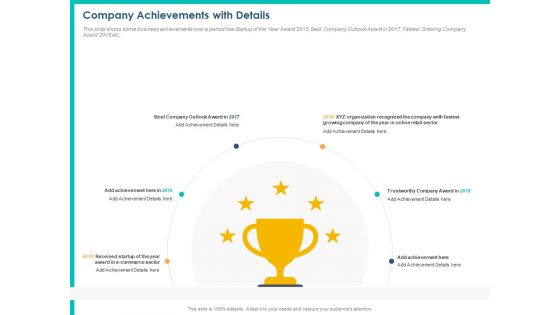
PPM Private Equity Company Achievements With Details Ppt PowerPoint Presentation Model Structure PDF
This slide shows some business achievements over a period like Startup of the Year Award 2015, Best Company Outlook Award in 2017, Fastest Growing Company Award 2018 etc. Presenting ppm private equity company achievements with details ppt powerpoint presentation model structure pdf to provide visual cues and insights. Share and navigate important information on one stages that need your due attention. This template can be used to pitch topics like achievement details, organization recognized, online retail sector, e commerce sector. In addition, this PPT design contains high-resolution images, graphics, etc, that are easily editable and available for immediate download.
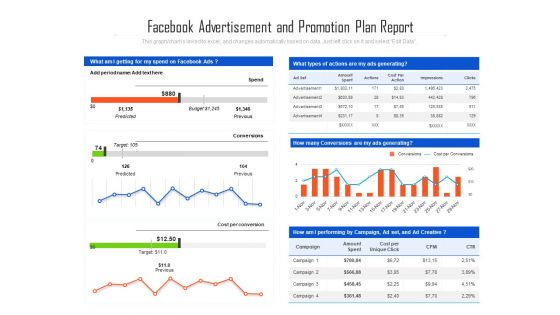
Facebook Advertisement And Promotion Plan Report Ppt PowerPoint Presentation Gallery Mockup PDF
Showcasing this set of slides titled facebook advertisement and promotion plan report ppt powerpoint presentation gallery mockup pdf. The topics addressed in these templates are budget, predicted, cost per conversion, predicted, previous. All the content presented in this PPT design is completely editable. Download it and make adjustments in color, background, font etc. as per your unique business setting.
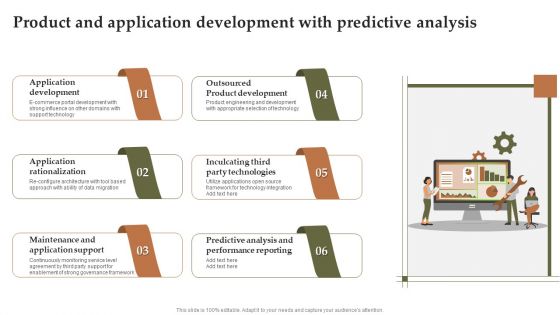
Product And Application Development With Predictive Analysis Themes PDF
Persuade your audience using this Product And Application Development With Predictive Analysis Themes PDF. This PPT design covers six stages, thus making it a great tool to use. It also caters to a variety of topics including Application Rationalization, Application Support, Performance Reporting. Download this PPT design now to present a convincing pitch that not only emphasizes the topic but also showcases your presentation skills.
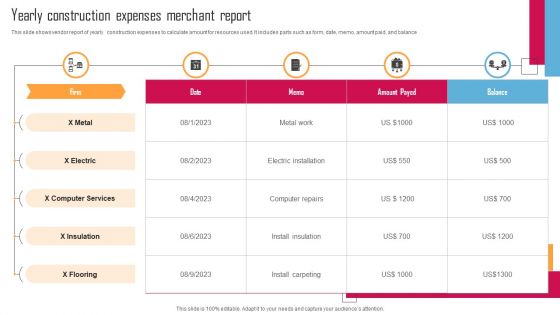
Yearly Construction Expenses Merchant Report Mockup PDF
This slide shows vendor report of yearly construction expenses to calculate amount for resources used. It includes parts such as form, date, memo, amount paid, and balance. Showcasing this set of slides titled Yearly Construction Expenses Merchant Report Mockup PDF. The topics addressed in these templates are X Metal, X Electric, X Computer Services. All the content presented in this PPT design is completely editable. Download it and make adjustments in color, background, font etc. as per your unique business setting.

5 Step Guide For Transitioning To Blue Ocean Strategy How To Calculate Cost Of Disengaged Employees Portrait PDF
This template covers a tool to estimate the cost of disengaged employees in your organization. This provides companies with a rough estimate of the minimum annual benefit an organization can achieve in their leadership strength by applying blue ocean leadership. Here you can discover an assortment of the finest PowerPoint and Google Slides templates. With these templates, you can create presentations for a variety of purposes while simultaneously providing your audience with an eye-catching visual experience. Download 5 Step Guide For Transitioning To Blue Ocean Strategy How To Calculate Cost Of Disengaged Employees Portrait PDF to deliver an impeccable presentation. These templates will make your job of preparing presentations much quicker, yet still, maintain a high level of quality. Slidegeeks has experienced researchers who prepare these templates and write high-quality content for you. Later on, you can personalize the content by editing the 5 Step Guide For Transitioning To Blue Ocean Strategy How To Calculate Cost Of Disengaged Employees Portrait PDF.
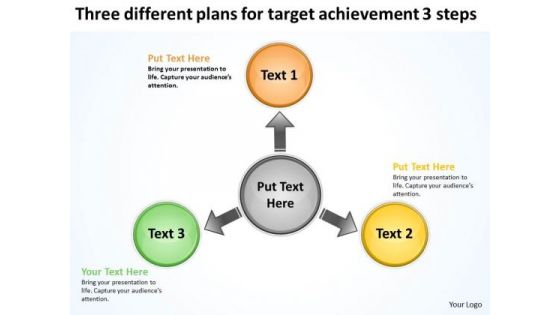
Three Different Plans For Target Achievement 3 Steps Charts And PowerPoint Slides
We present our three different plans for target achievement 3 steps Charts and PowerPoint Slides.Present our Circle Charts PowerPoint Templates because you have the people in place, selected the team leaders and all are raring to go. Present our Arrows PowerPoint Templates because with the help of our Slides you can Illustrate these thoughts with this slide. Download our Business PowerPoint Templates because this layout helps you to bring some important aspects of your business process to the notice of all concerned. Streamline the flow of information across the board. Present our Shapes PowerPoint Templates because Our PowerPoint Templates and Slides will effectively help you save your valuable time. They are readymade to fit into any presentation structure. Download and present our Flow Charts PowerPoint Templates because your ideas are fundamentally stable with a broad base of workable possibilities.Use these PowerPoint slides for presentations relating to 3d, achievement, aim, arrow, background, blue, business, career, chart, communication, competition, concept, curve, design, development, different, direction, education, financial, forecast, forward, glossy, graph, graphic, group, growth, icon, illustration, increase, investment, moving, outlook, path, plan, price, profit, progress, race, sales, start, success, target, team, three, turn, up, upwards, win, winner. The prominent colors used in the PowerPoint template are Orange, Yellow, Green. Customers tell us our three different plans for target achievement 3 steps Charts and PowerPoint Slides help you meet deadlines which are an element of today's workplace. Just browse and pick the slides that appeal to your intuitive senses. PowerPoint presentation experts tell us our blue PowerPoint templates and PPT Slides are Spectacular. People tell us our three different plans for target achievement 3 steps Charts and PowerPoint Slides are Tasteful. People tell us our background PowerPoint templates and PPT Slides are Handsome. Customers tell us our three different plans for target achievement 3 steps Charts and PowerPoint Slides are One-of-a-kind. People tell us our background PowerPoint templates and PPT Slides will help you be quick off the draw. Just enter your specific text and see your points hit home.

International Smartphone Shipping Report With Market Share Designs PDF
This slide showcases global report that can help to identify the shipment and market share growth of different smartphone models. It also outlines growth forecast for next financial year. Showcasing this set of slides titled International Smartphone Shipping Report With Market Share Designs PDF. The topics addressed in these templates are Shipment, Share, Global Smartphone Brands. All the content presented in this PPT design is completely editable. Download it and make adjustments in color, background, font etc. as per your unique business setting.
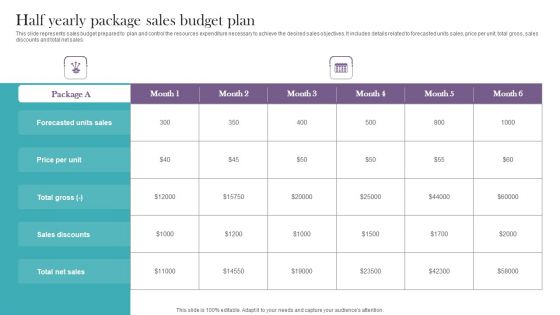
Half Yearly Package Sales Budget Plan Infographics PDF
This slide represents sales budget prepared to plan and control the resources expenditure necessary to achieve the desired sales objectives. It includes details related to forecasted units sales, price per unit, total gross, sales discounts and total net sales. Showcasing this set of slides titled Half Yearly Package Sales Budget Plan Infographics PDF. The topics addressed in these templates are Half Yearly Package, Sales Budget Plan. All the content presented in this PPT design is completely editable. Download it and make adjustments in color, background, font etc. as per your unique business setting.

Detailed Analysis Of Red Ocean Vs Blue Ocean Approach How To Calculate Cost Of Disengaged Employees Topics PDF
This template covers a tool to estimate the cost of disengaged employees in your organization. This provides companies with a rough estimate of the minimum annual benefit an organization can achieve in their leadership strength by applying blue ocean leadership. Welcome to our selection of the Detailed Analysis Of Red Ocean Vs Blue Ocean Approach How To Calculate Cost Of Disengaged Employees Topics PDF. These are designed to help you showcase your creativity and bring your sphere to life. Planning and Innovation are essential for any business that is just starting out. This collection contains the designs that you need for your everyday presentations. All of our PowerPoints are 100 percent editable, so you can customize them to suit your needs. This multi purpose template can be used in various situations. Grab these presentation templates today.
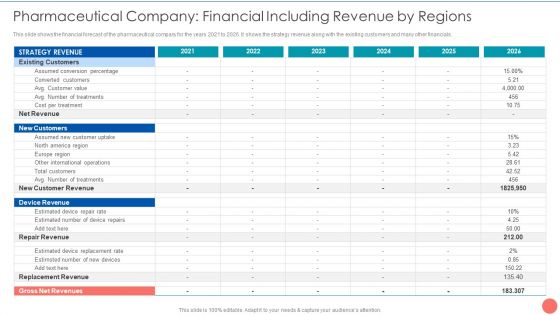
Tactics To Achieve Sustainability Pharmaceutical Company Financial Including Revenue By Regions Structure PDF
This slide shows the financial forecast of the pharmaceutical company for the years 2021 to 2026. It shows the strategy revenue along with the existing customers and many other financials. Deliver an awe inspiring pitch with this creative Tactics To Achieve Sustainability Pharmaceutical Company Financial Including Revenue By Regions Structure PDF bundle. Topics like Existing Customers Value, Cost Per Treatment, Avg Number Treatments can be discussed with this completely editable template. It is available for immediate download depending on the needs and requirements of the user.
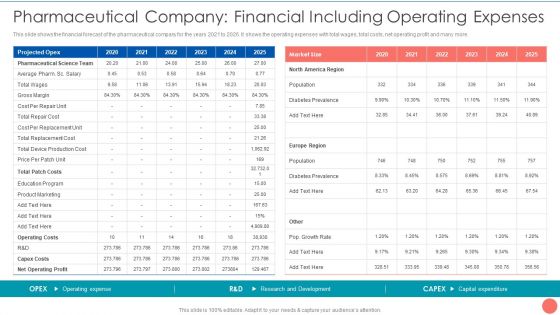
Tactics To Achieve Sustainability Pharmaceutical Company Financial Including Operating Expenses Diagrams PDF
This slide shows the financial forecast of the pharmaceutical company for the years 2021 to 2026. It shows the operating expenses with total wages, total costs, net operating profit and many more. Deliver an awe inspiring pitch with this creative Tactics To Achieve Sustainability Pharmaceutical Company Financial Including Operating Expenses Diagrams PDF bundle. Topics like Cost Per Repair, Total Patch Costs, Education Program Marketing can be discussed with this completely editable template. It is available for immediate download depending on the needs and requirements of the user.

Strategic Market Insight Implementation Guide Statistics Report Showing Market Highlights Themes PDF
This slide presents an statistics reports providing valuable insights of global market based on data collection and analysis. It covers key elements such as forecasted market CAGR, incremental growth, estimated YoY rate, revenue generating market region and key drivers. From laying roadmaps to briefing everything in detail, our templates are perfect for you. You can set the stage with your presentation slides. All you have to do is download these easy to edit and customizable templates. Strategic Market Insight Implementation Guide Statistics Report Showing Market Highlights Themes PDF will help you deliver an outstanding performance that everyone would remember and praise you for. Do download this presentation today.
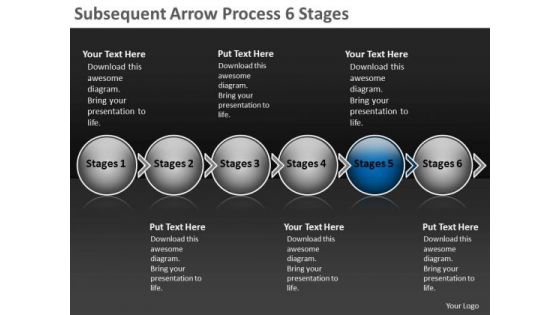
Subsequent Arrow Process 6 Stages Ppt Business Flow Chart PowerPoint Slides
We present our subsequent arrow process 6 stages ppt business flow chart PowerPoint Slides. Use our Spheres PowerPoint Templates because; Blaze a brilliant trail from point to point. Use our Arrows PowerPoint Templates because, Will surely see the all making the grade. Use our Symbol PowerPoint Templates because, this template with an image of helps you chart the course of your presentation. Use our Marketing PowerPoint Templates because, it is in your DNA to analyses possible causes to the minutest detail. Use our Process and Flows PowerPoint Templates because; Highlight these individual targets and the paths to their achievement. Use these PowerPoint slides for presentations relating to Account, Arrow, Arrows, Away, Box, Business, Chart, Choice, Choose, Concept, Concepts, Consultation, Corporate, Design, Diagram, Direction, Elements, Flow, Follow, Follows, Future, Group, Grow, Increase, Lines, Many, Month, Move, Past, Period, Phase, Project, Report, Rise, Row, Step, Success, Spheres, Text, Time, Timeline, Today, Up, Way, Ways, Work, Year. The prominent colors used in the PowerPoint template are Blue, Gray, and Black

Time Is Money For Business Calculation PowerPoint Templates Ppt Backgrounds For Slides 0713
Display your drive on our Time Is Money For Business Calculation PowerPoint Templates PPT Backgrounds For Slides. Invigorate the audience with your fervour. Drive your team towards excellence. Steer them there with our money PowerPoint Templates. Drive your passion with our clocks PowerPoint Templates. Steer yourself to achieve your aims.
Icons Slide For Sustainability Calculation With KPI Ppt PowerPoint Presentation File Information PDF
Introducing our well designed icons slide for sustainability calculation with kpi ppt powerpoint presentation file information pdf set of slides. The slide displays editable icons to enhance your visual presentation. The icons can be edited easily. So customize according to your business to achieve a creative edge. Download and share it with your audience.

Guide To Develop And Estimate Brand Value Sample Asset Valuation Report Weighted Average Returns Analysis Microsoft PDF
Mentioned slide highlights information about ABC corporations valuation using weighted average returns analysis. It also includes details about enterprise value.Find highly impressive Guide To Develop And Estimate Brand Value Sample Asset Valuation Report Weighted Average Returns Analysis Microsoft PDF on Slidegeeks to deliver a meaningful presentation. You can save an ample amount of time using these presentation templates. No need to worry to prepare everything from scratch because Slidegeeks experts have already done a huge research and work for you. You need to download Guide To Develop And Estimate Brand Value Sample Asset Valuation Report Weighted Average Returns Analysis Microsoft PDF for your upcoming presentation. All the presentation templates are 100 precent editable and you can change the color and personalize the content accordingly. Download now.
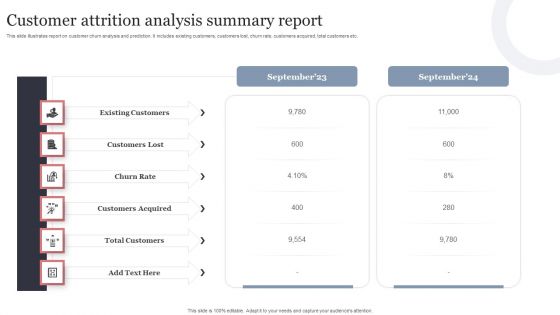
Customer Attrition Analysis Summary Report Template PDF
This slide illustrates report on customer churn analysis and prediction. It includes existing customers, customers lost, churn rate, customers acquired, total customers etc. Pitch your topic with ease and precision using this Customer Attrition Analysis Summary Report Template PDF. This layout presents information on Existing Customers, Customers Lost, Churn Rate, Customers Acquired, Total Customers. It is also available for immediate download and adjustment. So, changes can be made in the color, design, graphics or any other component to create a unique layout.
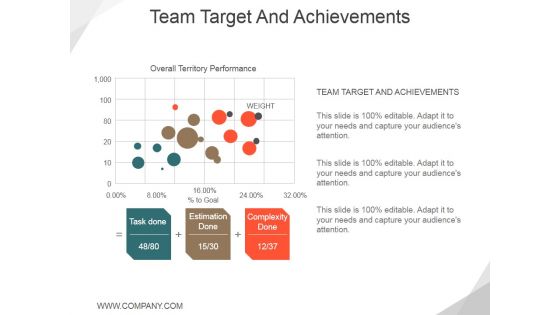
Team Target And Achievements Template 1 Ppt PowerPoint Presentation Background Image
This is a team target and achievements template 1 ppt powerpoint presentation background image. This is a three stage process. The stages in this process are task done, estimation done, complexity done, weight.

Corporate Performance Management Dashboard Ppt Powerpoint Topics
This is a corporate performance management dashboard ppt powerpoint topics. This is a eight stage process. The stages in this process are analysis, reporting, dashboards, financial consolidation, budgeting, forecasting, detailed planning, operational planning, corporate performance management.
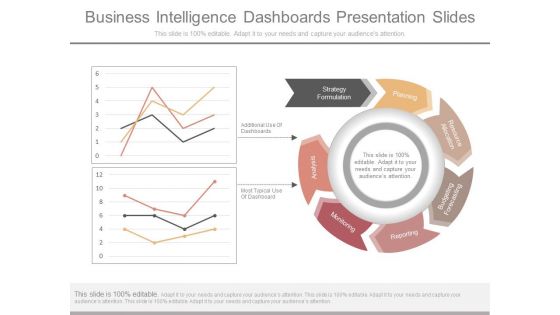
Business Intelligence Dashboards Presentation Slides
This is a business intelligence dashboards presentation slides. This is a seven stage process. The stages in this process are strategy formulation, planning, resource allocation, budgeting forecasting, reporting, monitoring, analysis, additional use of dashboards, most typical use of dashboard.
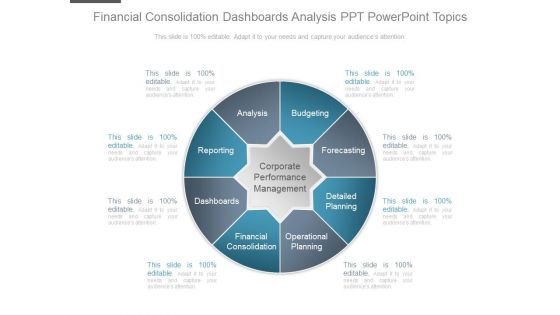
Financial Consolidation Dashboards Analysis Ppt Powerpoint Topics
This is a financial consolidation dashboards analysis ppt powerpoint topics. This is a eight stage process. The stages in this process are corporate performance management, budgeting, forecasting, detailed planning, operational planning, financial consolidation, dashboards, reporting, analysis.
Icons Slide For Brand Value Estimation Guide Brochure PDF
Introducing our well designed Icons Slide For Brand Value Estimation Guide Brochure PDF set of slides. The slide displays editable icons to enhance your visual presentation. The icons can be edited easily. So customize according to your business to achieve a creative edge. Download and share it with your audience.

Workforce Training Report Dashboard Elements PDF
This slide showcases hr training report dashboard. It provides information such as demands, budget, hours, cost, participants, approved sessions, training session, etc. Pitch your topic with ease and precision using this Workforce Training Report Dashboard Elements PDF. This layout presents information on Training Budget, Demands For Training, Approved Demands. It is also available for immediate download and adjustment. So, changes can be made in the color, design, graphics or any other component to create a unique layout.
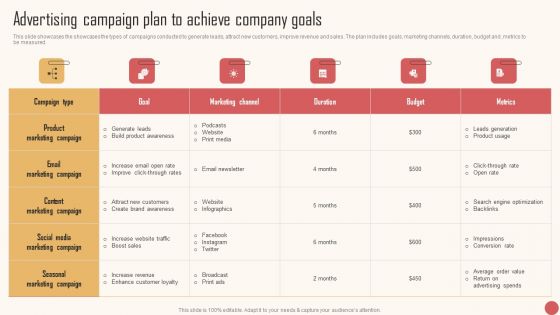
Advertising Campaign Plan To Achieve Company Goals Infographics PDF
This slide showcases the showcases the types of campaigns conducted to generate leads, attract new customers, improve revenue and sales. The plan includes goals, marketing channels, duration, budget and ,metrics to be measured. Get a simple yet stunning designed Advertising Campaign Plan To Achieve Company Goals Infographics PDF. It is the best one to establish the tone in your meetings. It is an excellent way to make your presentations highly effective. So, download this PPT today from Slidegeeks and see the positive impacts. Our easy-to-edit Advertising Campaign Plan To Achieve Company Goals Infographics PDF can be your go-to option for all upcoming conferences and meetings. So, what are you waiting for Grab this template today.
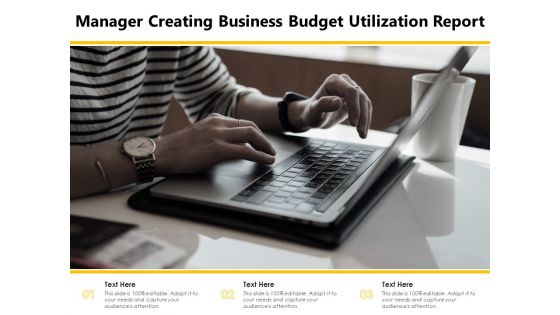
Manager Creating Business Budget Utilization Report Ppt PowerPoint Presentation Infographic Template Graphics Tutorials PDF
Presenting this set of slides with name manager creating business budget utilization report ppt powerpoint presentation infographic template graphics tutorials pdf. This is a three stage process. The stages in this process are manager creating business budget utilization report. This is a completely editable PowerPoint presentation and is available for immediate download. Download now and impress your audience.
Budget Capital Expenditure Strategy Report Icon Ppt PowerPoint Presentation Gallery Show PDF
Presenting budget capital expenditure strategy report icon ppt powerpoint presentation gallery show pdf to dispense important information. This template comprises three stages. It also presents valuable insights into the topics including budget capital expenditure strategy report icon. This is a completely customizable PowerPoint theme that can be put to use immediately. So, download it and address the topic impactfully.
Services Promotional Campaign Budget Allocation And Expenditure Report Icon Sample PDF
resenting Services Promotional Campaign Budget Allocation And Expenditure Report Icon Sample PDF to dispense important information. This template comprises three stages. It also presents valuable insights into the topics including Services Promotional Campaign, Budget Allocation, Expenditure Report Icon. This is a completely customizable PowerPoint theme that can be put to use immediately. So, download it and address the topic impactfully.
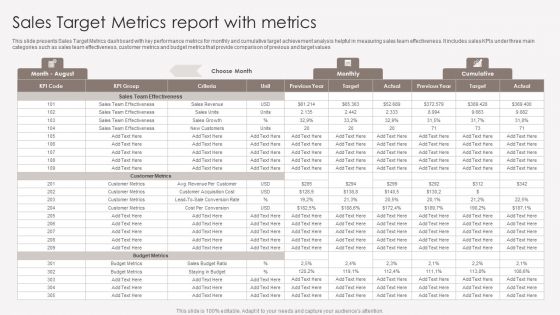
Sales Target Metrics Report With Metrics Introduction PDF
This slide presents Sales Target Metrics dashboard with key performance metrics for monthly and cumulative target achievement analysis helpful in measuring sales team effectiveness. It includes sales KPIs under three main categories such as sales team effectiveness, customer metrics and budget metrics that provide comparison of previous and target values. Pitch your topic with ease and precision using this Sales Target Metrics Report With Metrics Introduction PDF. This layout presents information on Sales Team Effectiveness, Customer Metrics, Budget Metrics. It is also available for immediate download and adjustment. So, changes can be made in the color, design, graphics or any other component to create a unique layout.

Business Monthly Operational Budget Report Summary With Actual Data Structure PDF
The following slide highlights the monthly operational budget report with actual data. It provides information about particulars, item, budget, revenue, expenses, salaries, materials, overhead, total and balance.Showcasing this set of slides titled Business Monthly Operational Budget Report Summary With Actual Data Structure PDF The topics addressed in these templates are Particulars, Membership Receivables, Administrative All the content presented in this PPT design is completely editable. Download it and make adjustments in color, background, font etc. as per your unique business setting.

Accounting Operations Training Department Program Completion Status Report Rules PDF
This slide covers training status report for business financial operations. It includes training for accounts and financial statements, operational ratios and forecasting, invoice processing, etc. along with all assignments completion status. Showcasing this set of slides titled Accounting Operations Training Department Program Completion Status Report Rules PDF. The topics addressed in these templates are Accounts And Financial, Operational Ratios, Invoice Processing. All the content presented in this PPT design is completely editable. Download it and make adjustments in color, background, font etc. as per your unique business setting.

E Commerce Sales Order Processing Services Market Report Structure PDF
The following slide highlights market report for e-commerce services for sales order fulfilment. It includes components such as warehousing, storage fulfilment services, bundling fulfilment services, key insights, key companies etc. Showcasing this set of slides titled E Commerce Sales Order Processing Services Market Report Structure PDF. The topics addressed in these templates are Expected Revenue Forecast, Growth Rate, Market Size Value. All the content presented in this PPT design is completely editable. Download it and make adjustments in color, background, font etc. as per your unique business setting.
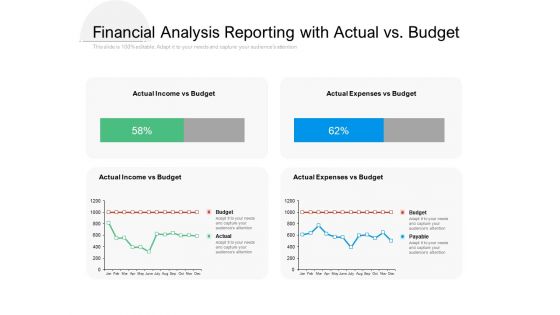
Financial Analysis Reporting With Actual Vs Budget Ppt PowerPoint Presentation Styles Format Ideas
Presenting this set of slides with name financial analysis reporting with actual vs budget ppt powerpoint presentation styles format ideas. The topics discussed in these slides are actual income vs budget, actual expenses vs budget . This is a completely editable PowerPoint presentation and is available for immediate download. Download now and impress your audience.

 Home
Home