Project Result

Pie Chart For Marketing And Business Result PowerPoint Templates Ppt Backgrounds For Slides 0413
We present our Pie Chart For Marketing And Business Result PowerPoint Templates PPT Backgrounds For Slides 0413.Use our Pie charts PowerPoint Templates because Our PowerPoint Templates and Slides will weave a web of your great ideas. They are gauranteed to attract even the most critical of your colleagues. Download and present our Business PowerPoint Templates because you can Break through with our PowerPoint Templates and Slides. Bring down the mental barriers of your audience. Present our Success PowerPoint Templates because Our PowerPoint Templates and Slides will let you Clearly mark the path for others to follow. Download our Marketing PowerPoint Templates because Our PowerPoint Templates and Slides will steer your racing mind. Hit the right buttons and spur on your audience. Present our Finance PowerPoint Templates because It will Strengthen your hand with your thoughts. They have all the aces you need to win the day.Use these PowerPoint slides for presentations relating to Pie chart, business, marketing, finance, success, shapes. The prominent colors used in the PowerPoint template are Red, Yellow, Green.
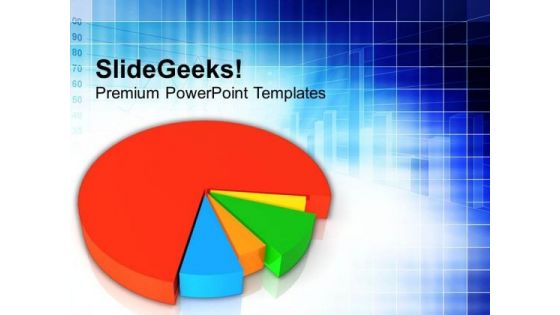
Pie Chart Business Result PowerPoint Templates Ppt Backgrounds For Slides 0413
We present our Pie Chart Business Result PowerPoint Templates PPT Backgrounds For Slides 0413.Download and present our Finance PowerPoint Templates because you should Whip up a frenzy with our PowerPoint Templates and Slides. They will fuel the excitement of your team. Download our Marketing PowerPoint Templates because You can Connect the dots. Fan expectations as the whole picture emerges. Download and present our Success PowerPoint Templates because Our PowerPoint Templates and Slides will embellish your thoughts. See them provide the desired motivation to your team. Use our Pie chart PowerPoint Templates because You have a driving passion to excel in your field. Our PowerPoint Templates and Slides will prove ideal vehicles for your ideas. Download our Business PowerPoint Templates because You have a driving passion to excel in your field. Our PowerPoint Templates and Slides will prove ideal vehicles for your ideas.Use these PowerPoint slides for presentations relating to Pie chart, finance, marketing, business, success, pie chart. The prominent colors used in the PowerPoint template are Blue, Red, Green.

Colorful Pie Chart Result Display For Business PowerPoint Templates Ppt Backgrounds For Slides 0413
We present our Colorful Pie Chart Result Display For Business PowerPoint Templates PPT Backgrounds For Slides 0413.Download our Pie Charts PowerPoint Templates because You aspire to touch the sky with glory. Let our PowerPoint Templates and Slides provide the fuel for your ascent. Present our Business PowerPoint Templates because Our PowerPoint Templates and Slides has conjured up a web of all you need with the help of our great team. Use them to string together your glistening ideas. Download and present our Success PowerPoint Templates because It can Bubble and burst with your ideas. Use our Marketing PowerPoint Templates because Timeline crunches are a fact of life. Meet all deadlines using our PowerPoint Templates and Slides. Download our Shapes PowerPoint Templates because Our PowerPoint Templates and Slides are Clear and concise. Use them and dispel any doubts your team may have.Use these PowerPoint slides for presentations relating to Business pie graphs displaying colorful, pie charts, business, success, marketing, shapes. The prominent colors used in the PowerPoint template are Purple, Gray, White.
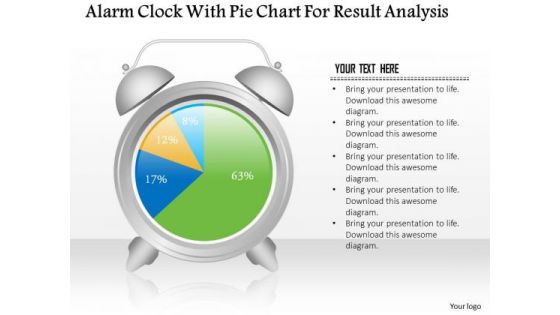
Business Diagram Alarm Clock With Pie Chart For Result Analysis PowerPoint Slide
This business slide displays alarm clock with pie chart. This diagram is a data visualization tool that gives you a simple way to present statistical information. This slide helps your audience examine and interpret the data you present.
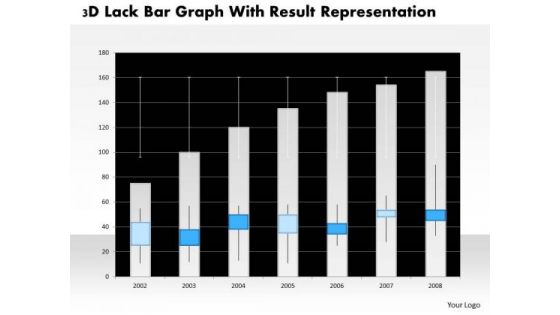
Business Diagram 3d Lack Bar Graph With Result Representation PowerPoint Slide
This business diagram has graphic of 3d lack bar graph. This diagram is a data visualization tool that gives you a simple way to present statistical information. This slide helps your audience examine and interpret the data you present.
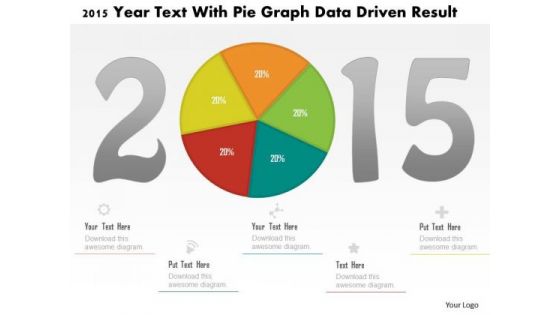
Business Diagram 2015 Year Text With Pie Graph Data Driven Result PowerPoint Slide
This business diagram displays 2015 year numbers with pie chart. This diagram is suitable to display business strategy for year 2015. Download this professional slide to present information in an attractive manner

Business Diagram Four Pie Chart For Data Driven Result Analysis Of Business PowerPoint Slide
This business diagram displays graphic of pie charts in shape of flasks. This business slide is suitable to present and compare business data. Use this diagram to build professional presentations for your viewers.

Business Diagram Tablet With Pie And Business Bar Graph For Result Analysis PowerPoint Slide
This PowerPoint template displays technology gadgets with various business charts. Use this diagram slide, in your presentations to make business reports for statistical analysis. You may use this diagram to impart professional appearance to your presentations.
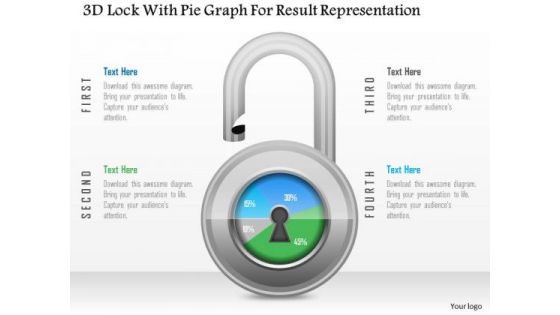
Business Diagram 3d Lock With Pie Graph For Result Representation PowerPoint Slide
This Power Point diagram has been crafted with pie chart in shape of lock. It contains diagram of lock pie chart to compare and present data in an effective manner. Use this diagram to build professional presentations for your viewers.
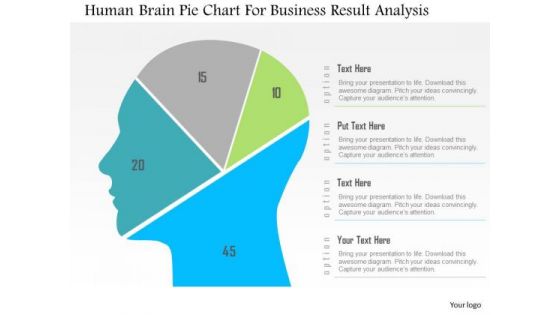
Business Diagram Human Brain Pie Chart For Business Result Analysis PowerPoint Slide
This diagram displays human face graphic divided into sections. This section can be used for data display. Use this diagram to build professional presentations for your viewers.
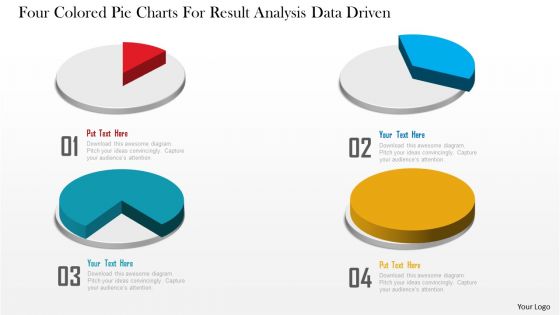
Business Diagram Four Colored Pie Charts For Result Analysis Data Driven PowerPoint Slide
This business diagram displays graphic of pie charts. This business slide is suitable to present and compare business data. Use this diagram to build professional presentations for your viewers.

Business Daigram Six Staged Pie Chart For Business Result Presentation Templets
Six staged pie chart is used to design this business slide. Download this diagram to make business and financial reports. Use our above diagram to express information in a visual way.

Stock Photo Colorful Bar Graph For Business Result Display PowerPoint Slide
This image slide displays bar graph. This image has been designed with graphic of 3d multicolor bar graph of solid cylinder shape. Use this image slide, in your presentations to express views on finance, growth and success. This image slide may also be used to exhibit any information which requires visual presentation in your presentations. This image slide will enhance the quality of your presentations.
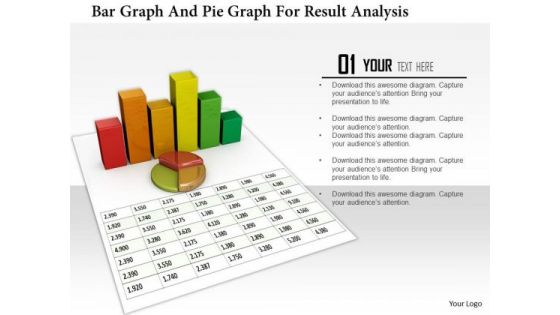
Stock Photo Bar Graph And Pie Graph For Result Analysis PowerPoint Slide
3D business graphs have been used to design this PowerPoint template. This Image slide is suitable to make business reports and charts. This slide can be used for business and marketing presentations.

Strength Opportunities Aspiration And Result Model Ppt PowerPoint Presentation Complete Deck With Slides
This complete presentation has PPT slides on wide range of topics highlighting the core areas of your business needs. It has professionally designed templates with relevant visuals and subject driven content. This presentation deck has total of fifteen slides. Get access to the customizable templates. Our designers have created editable templates for your convenience. You can edit the colour, text and font size as per your need. You can add or delete the content if required. You are just a click to away to have this ready made presentation. Click the download button now.

Bar And Pie Chart For Result Analysis PowerPoint Templates Ppt Backgrounds For Slides 0513
Our Great Team Has Conjured Up A Web Of business Power Point Templates. Use Them To String Together Your Glistening Ideas. Think Of It And Be Sure We Have It. Our pie charts Power Point Templates Offer You The Widest Possible Range Of Options.

Bar Graph With Variation In Result PowerPoint Templates Ppt Backgrounds For Slides 0513
Brilliant Backdrops Are The Essence Of Our marketing Power Point Templates. Guaranteed To Illuminate The Minds Of Your Audience. Our success Power Point Templates Are Conceived By A Dedicated Team. Use Them And Give Form To Your Wondrous Ideas.

Business Graph Success Global Result PowerPoint Templates Ppt Backgrounds For Slides 0513
Our marketing Power Point Templates Are The Chords Of Your Song. String Them Along And Provide The Lilt To Your Views. Our globe Power Point Templates Help You Pinpoint Your Timelines. Highlight The Reasons For Your Deadlines With Their Use.

Marketing Bar Graph For Result PowerPoint Templates Ppt Backgrounds For Slides 0513
Our marketing Power Point Templates Give Good Value For Money. They Also Have Respect For The Value Of Your Time. Take A Leap Off The Starting Blocks With Our business Power Point Templates. They Will Put You Ahead Of The Competition In Quick Time.

Business Result Meeting With Team PowerPoint Templates Ppt Backgrounds For Slides 0513
Our business Power Point Templates Will Generate And Maintain The Level Of Interest You Desire. They Will Create The Impression You Want To Imprint On Your Audience. Our people Power Point Templates Are Effectively Color Coded To Priorities Your Plans. They Automatically Highlight The Sequence Of Events You Desire.

Pie Chart Result Discussion With Team PowerPoint Templates Ppt Backgrounds For Slides 0613
Raise A Toast With Our People Powerpoint Templates. Spread Good Cheer Amongst Your Audience. Press The Right Buttons With Our Pie Charts Powerpoint Templates. They Will Take Your Ideas Down The Perfect Channel.
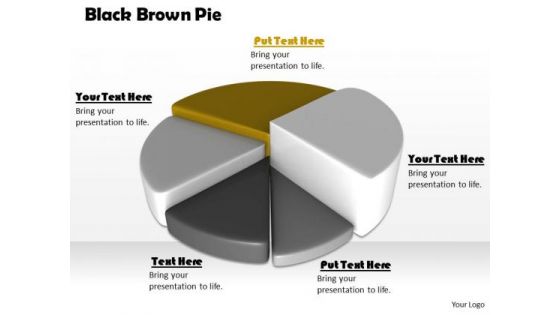
Stock Photo Black Brown Pie Chart For Business Result PowerPoint Slide
This high quality image is designed with pie chart. Use this image to make business reports. Use this outstanding image in presentations relating to data analysis and reports. Go ahead and add charm to your presentations.
Stock Photo Colorful 3d Pie Chart For Business Result PowerPoint Slide
This high quality image is designed with pie chart. Use this image to make business reports. Use this outstanding image in presentations relating to data analysis and reports. Go ahead and add charm to your presentations.

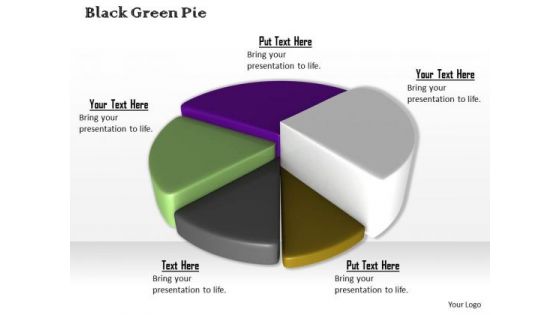
Stock Photo Green 3d Pie Chart For Result Analysis PowerPoint Slide
Develop competitive advantage with this image which contains 3d pie chart with five steps. Use this image to define steps of business process with this image of pie chart. This image is an excellent tool to give an ideal presentation.
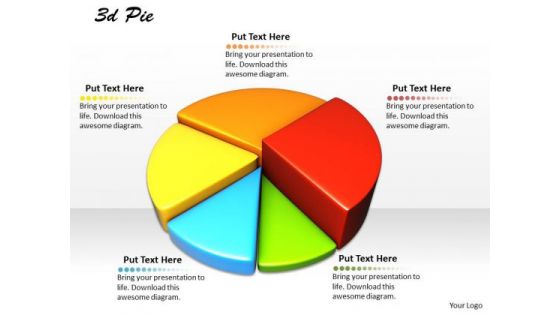
Stock Photo Multicolor Pie Chart For Business Result Analysis PowerPoint Slide
Develop competitive advantage with this image which contains 3d pie chart with five steps. Use this image to define steps of business process with this image of pie chart. This image is an excellent tool to give an ideal presentation.
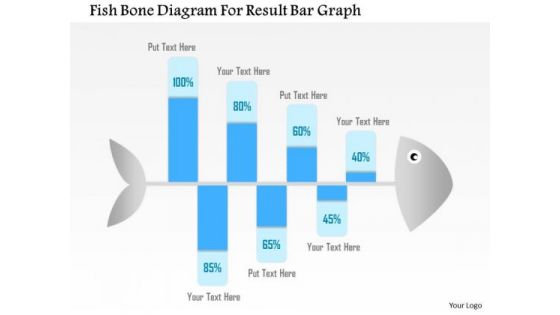
Business Diagram Fish Bone Diagram For Result Bar Graph Presentation Template
Graphic of fish bone has been used to design this Power Point template slide. This PPT slide contains the concept of problem analysis and root cause analysis. Use this PPT slide and display process of root cause analysis for any field. This PPT slide is very well designed for business and production related problem analysis.
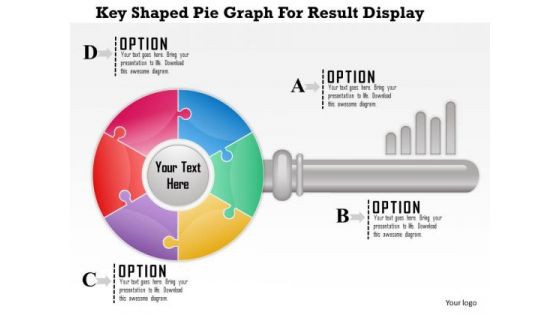
Business Diagram Key Shaped Pie Graph For Result Display Presentation Template
Key shaped pie graph has been used to design this business diagram. This slide has key graphic with abcd options. Use this amazing slide to present a business plan. Download this slide to impress your viewers.

Business Diagram Nine Staged Pie Graph For Business Result Analysis Presentation Template
This business slide displays nine staged pie chart. This diagram is a data visualization tool that gives you a simple way to present statistical information. This slide helps your audience examine and interpret the data you present.
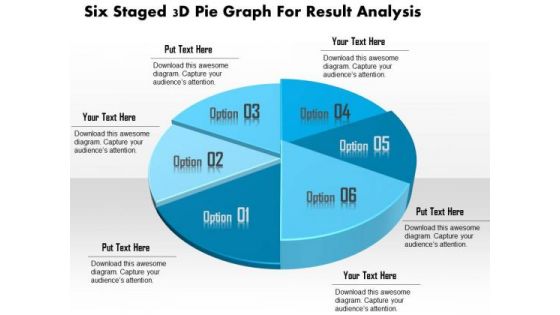
Business Diagram Six Staged 3d Pie Graph For Result Analysis Presentation Template
This business slide displays six staged pie chart. This diagram is a data visualization tool that gives you a simple way to present statistical information. This slide helps your audience examine and interpret the data you present.

Business Diagram 3d Bar Graph For Business Result Analysis Presentation Template
This business slide displays five staged pie chart. This diagram is a data visualization tool that gives you a simple way to present statistical information. This slide helps your audience examine and interpret the data you present.
Business Diagram Pie Chart With Icons For Result Analysis Presentation Template
This business slide contains graphics of pie chart with business icons. Download this impressive diagram to present marketing performance measurement. This image slide is best to present your newer thoughts.
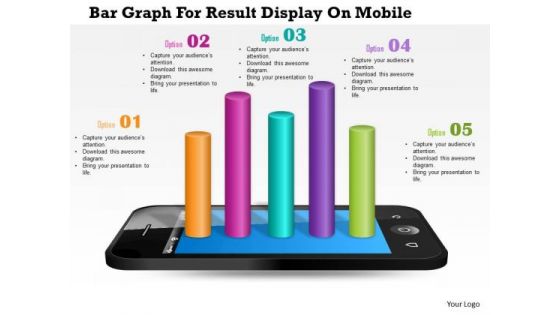
Business Diagram Bar Graph For Result Display On Mobile Presentation Template
This Power Point template has been designed with graphic of bar graph on mobile phone. This business diagram can be used to make business reports. Download this Power Point slide to build quality presentation for your viewers.

Business Diagram Five Linear Pie Charts For Result Analysis Presentation Template
This business diagram displays graphic of five staged process flow diagram. This PPT slide contains the concept of business data representation. Use this diagram to build professional presentation for your viewers.

Business Diagram 3d Graphic Colored Bar Graph For Business Result Analysis Presentation Template
This Power Point template has been designed with graphic of 3d graphic and colored bar graph. Use this slide to represent six steps of any business process. Use this diagram for your business presentations and get exclusive comments on your efforts.
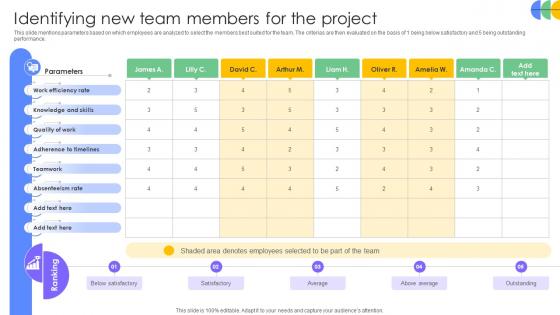
Driving Results Designing A Team Identifying New Team Members For The Project
This slide mentions parameters based on which employees are analyzed to select the members best suited for the team. The criterias are then evaluated on the basis of 1 being below satisfactory and 5 being outstanding performance. If you are looking for a format to display your unique thoughts, then the professionally designed Driving Results Designing A Team Identifying New Team Members For The Project is the one for you. You can use it as a Google Slides template or a PowerPoint template. Incorporate impressive visuals, symbols, images, and other charts. Modify or reorganize the text boxes as you desire. Experiment with shade schemes and font pairings. Alter, share or cooperate with other people on your work. Download Driving Results Designing A Team Identifying New Team Members For The Project and find out how to give a successful presentation. Present a perfect display to your team and make your presentation unforgettable.

Business Plan Methods Tools And Templates Set 2 SOAR Strength Opportunities Aspiration And Result Model Clipart PDF
This slide covers SOAR organization analysis model depicting strength opportunities, aspiration, results organization model including questions such as what can we build, what do we care about, what are stakeholders asking for and many more. This is a business plan methods tools and templates set 2 soar strength opportunities aspiration and result model clipart pdf template with various stages. Focus and dispense information on four stages using this creative set, that comes with editable features. It contains large content boxes to add your information on topics like result, aspiration, strengths, opportunities. You can also showcase facts, figures, and other relevant content using this PPT layout. Grab it now.
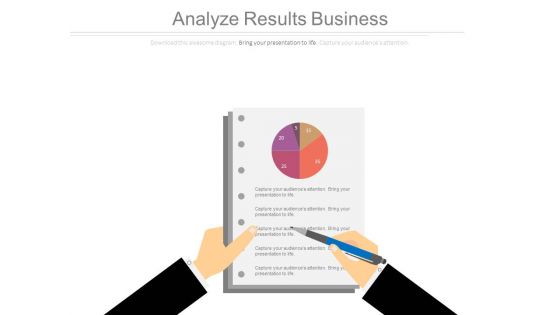
Analyze Results Business Ppt Slides
This is a analyze results business ppt slides. This is a one stage process. The stages in this process are business, success.

Smbs Survey Results Survey SS
Showcasing this set of slides titled Smbs Survey Results Survey SS. The topics addressed in these templates are Business, Increased, Moderate Negative . All the content presented in this PPT design is completely editable. Download it and make adjustments in color, background, font etc. as per your unique business setting.
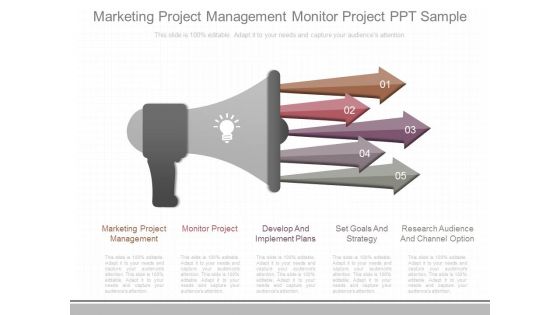
Marketing Project Management Monitor Project Ppt Sample
This is a marketing project management monitor project ppt sample. This is a five stage process. The stages in this process are marketing project management, monitor project, develop and implement plans, set goals and strategy, research audience and channel option.
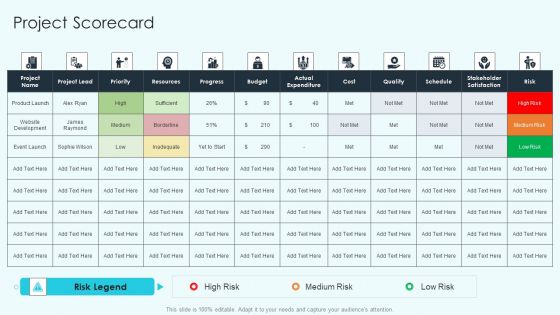
Project Administration Kpis Project Scorecard Demonstration PDF
Deliver an awe inspiring pitch with this creative Project Administration Kpis Project Scorecard Demonstration PDF bundle. Topics like Risk Legend, Resources, Cost can be discussed with this completely editable template. It is available for immediate download depending on the needs and requirements of the user.
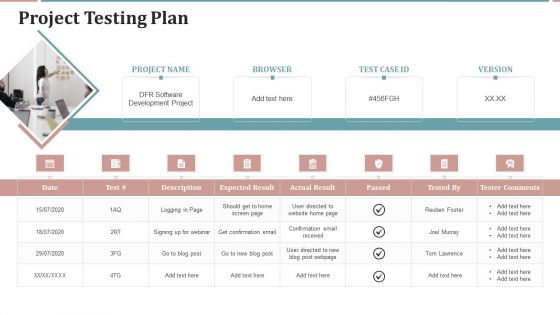
Project Planning Templates Bundle Project Testing Plan Pictures PDF
This is a Project Planning Templates Bundle Project Testing Plan Pictures PDF template with various stages. Focus and dispense information on one stage using this creative set, that comes with editable features. It contains large content boxes to add your information on topics like Tester Comments, Development Project, Expected Result. You can also showcase facts, figures, and other relevant content using this PPT layout. Grab it now.

Summary Of Site Survey Results Survey SS
Following slide shows the complete overview of survey in graphs and pie charts which assist in setting future trends. It basically shows the result of website visitors, overall website rating, etc. Showcasing this set of slides titled Summary Of Site Survey Results Survey SS. The topics addressed in these templates are Summary, Site Survey Results. All the content presented in this PPT design is completely editable. Download it and make adjustments in color, background, font etc. as per your unique business setting.
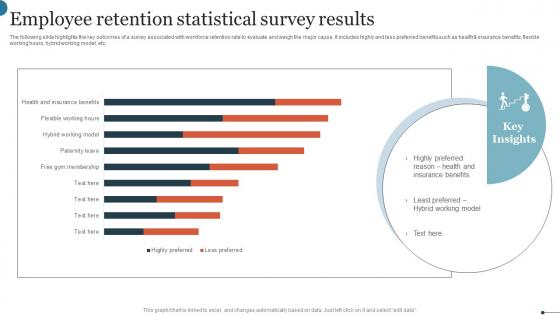
Employee Retention Statistical Survey Results Infographics Pdf
The following slide highlights the key outcomes of a survey associated with workforce retention rate to evaluate and weigh the major cause. It includes highly and less preferred benefits such as healthand insurance benefits, flexible working hours, hybrid working model, etc. Showcasing this set of slides titled Employee Retention Statistical Survey Results Infographics Pdf. The topics addressed in these templates are Highly Preferred Reason, Health Insurance Benefits, Hybrid Working Model. All the content presented in this PPT design is completely editable. Download it and make adjustments in color, background, font etc. as per your unique business setting.

Overview Of Site Survey Results Survey SS
Following slide shows the complete overview of survey in graphs and pie charts which assist in setting future trends. It basically shows the result of website visitors, overall website rating, etc. Pitch your topic with ease and precision using this Overview Of Site Survey Results Survey SS. This layout presents information on Overview, Site Survey Results. It is also available for immediate download and adjustment. So, changes can be made in the color, design, graphics or any other component to create a unique layout.
Results Ppt PowerPoint Presentation Icon Graphics Download
This is a results ppt powerpoint presentation icon graphics download. This is a three stage process. The stages in this process are result, finance, marketing, strategy, analysis, business.
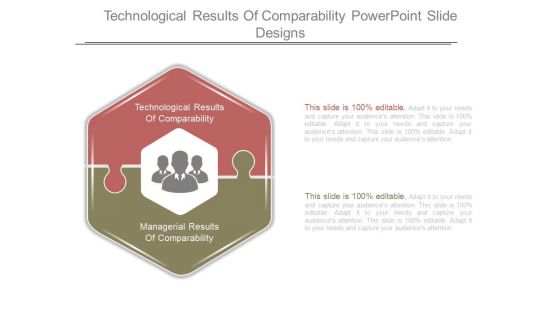
Technological Results Of Comparability Powerpoint Slide Designs
This is a technological results of comparability powerpoint slide designs. This is a two stage process. The stages in this process are technological results of comparability, managerial results of comparability.

Results Ppt PowerPoint Presentation Slides Vector
This is a results ppt powerpoint presentation slides vector. This is a three stage process. The stages in this process are results, business, management, marketing.
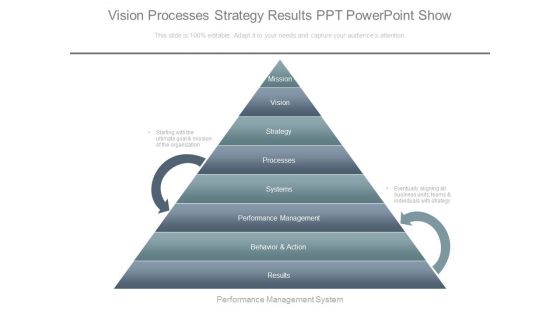
Vision Processes Strategy Results Ppt Powerpoint Show
This is a vision processes strategy results ppt powerpoint show. This is a eight stage process. The stages in this process are mission, vision, strategy, processes, systems, performance management, behavior and action, results, performance management system, starting with the ultimate goal and mission of the organization, eventually aligning all business units, teams and individuals with strategy.

Client Referrals Results Powerpoint Slide Show
This is a client referrals results powerpoint slide show. This is a three stage process. The stages in this process are series, year, success, planning, growth.

Last 90 Days Results Ppt Slides
This is a last 90 days results ppt slides. This is a four stage process. The stages in this process are business, marketing.

Analyze Results Ppt PowerPoint Presentation Slide
This is a analyze results ppt powerpoint presentation slide. This is a two stage process. The stages in this process are analysis, business, marketing, finance, pie chart.
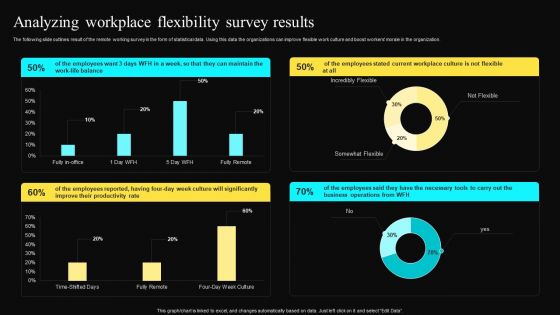
Analyzing Workplace Flexibility Survey Results Infographics PDF
The following slide outlines result of the remote working survey in the form of statistical data. Using this data the organizations can improve flexible work culture and boost workers morale in the organization. Slidegeeks is here to make your presentations a breeze with Analyzing Workplace Flexibility Survey Results Infographics PDF With our easy to use and customizable templates, you can focus on delivering your ideas rather than worrying about formatting. With a variety of designs to choose from, you are sure to find one that suits your needs. And with animations and unique photos, illustrations, and fonts, you can make your presentation pop. So whether you are giving a sales pitch or presenting to the board, make sure to check out Slidegeeks first.

International Sourcing Activities Survey Results Microsoft PDF
This slide covers the activities involved while sourcing the resources and products from overseas . It shows the survey results of respondents on the benefits of using global sourcing. Pitch your topic with ease and precision using this International Sourcing Activities Survey Results Microsoft PDF. This layout presents information on Global Sourcing, Labor Cost, Markets. It is also available for immediate download and adjustment. So, changes can be made in the color, design, graphics or any other component to create a unique layout.
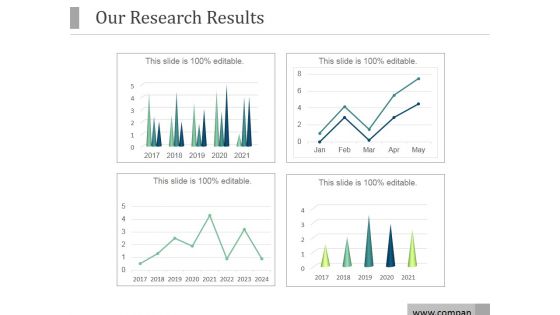
Our Research Results Ppt PowerPoint Presentation Model
This is a our research results ppt powerpoint presentation model. This is a four stage process. The stages in this process are research, financials, business, marketing, management, success.

Company Research Results Dashboard Ppt Background Graphics
This is a company research results dashboard ppt background graphics. This is a four stage process. The stages in this process are growth, business, marketing, year.
Results Ppt Powerpoint Presentation Infographics File Formats
This is a results ppt powerpoint presentation infographics file formats. This is a three stage process. The stages in this process are analysis, icon, business, marketing, strategy, finance.
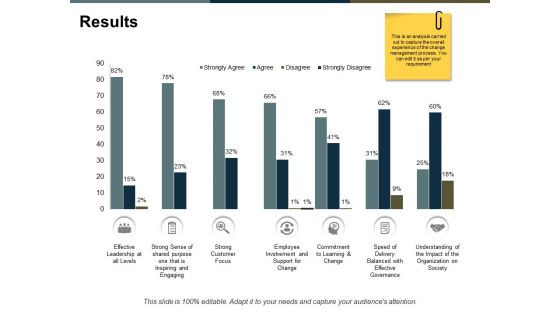
Results Ppt PowerPoint Presentation Model Graphics
This is a results ppt powerpoint presentation model graphics. This is a seven stage process. The stages in this process are finance, marketing, analysis, business, investment.
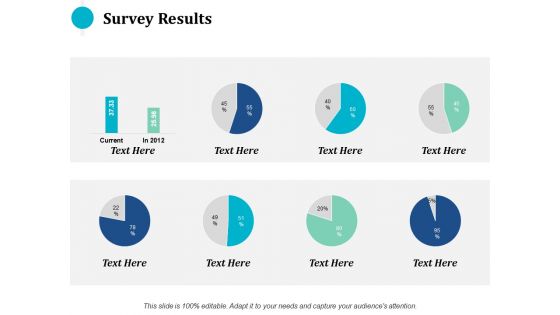
survey results ppt powerpoint presentation pictures guidelines
This is a survey results ppt powerpoint presentation pictures guidelines. This is a eight stage process. The stages in this process are finance, marketing, management, investment, analysis.

Analyze Results Ppt PowerPoint Presentation Guide
This is a analyze results ppt powerpoint presentation guide. This is a three stage process. The stages in this process are icon, percentage, finance, man, present.

Final 90 Days Results Presentation Layouts
This is a final 90 days results presentation layouts. This is a two stage process. The stages in this process are business, marketing, management, strategy, presentation.

 Home
Home