Project Result

Marketing Bar Graph For Result PowerPoint Templates Ppt Backgrounds For Slides 0513
Our marketing Power Point Templates Give Good Value For Money. They Also Have Respect For The Value Of Your Time. Take A Leap Off The Starting Blocks With Our business Power Point Templates. They Will Put You Ahead Of The Competition In Quick Time.
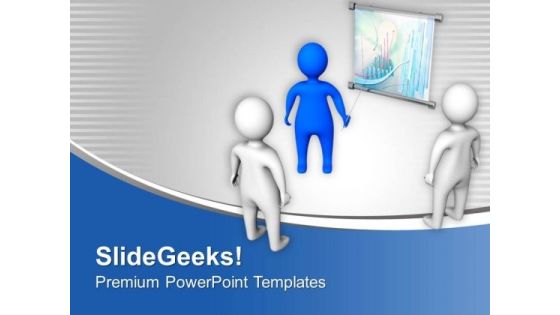
Business Result Meeting With Team PowerPoint Templates Ppt Backgrounds For Slides 0513
Our business Power Point Templates Will Generate And Maintain The Level Of Interest You Desire. They Will Create The Impression You Want To Imprint On Your Audience. Our people Power Point Templates Are Effectively Color Coded To Priorities Your Plans. They Automatically Highlight The Sequence Of Events You Desire.

Pie Chart Result Discussion With Team PowerPoint Templates Ppt Backgrounds For Slides 0613
Raise A Toast With Our People Powerpoint Templates. Spread Good Cheer Amongst Your Audience. Press The Right Buttons With Our Pie Charts Powerpoint Templates. They Will Take Your Ideas Down The Perfect Channel.

Stock Photo Black Brown Pie Chart For Business Result PowerPoint Slide
This high quality image is designed with pie chart. Use this image to make business reports. Use this outstanding image in presentations relating to data analysis and reports. Go ahead and add charm to your presentations.
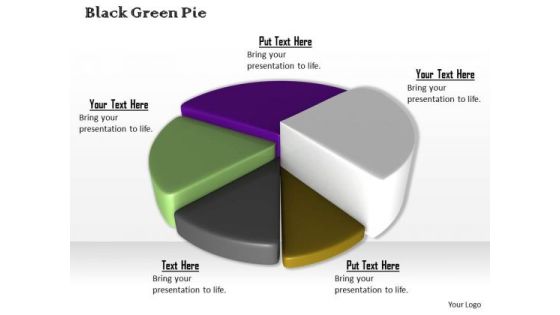
Stock Photo Colorful 3d Pie Chart For Business Result PowerPoint Slide
This high quality image is designed with pie chart. Use this image to make business reports. Use this outstanding image in presentations relating to data analysis and reports. Go ahead and add charm to your presentations.
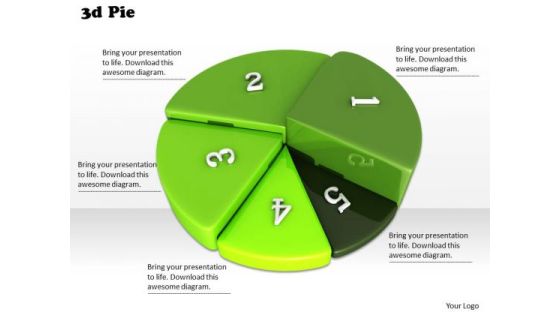
Stock Photo Green 3d Pie Chart For Result Analysis PowerPoint Slide
Develop competitive advantage with this image which contains 3d pie chart with five steps. Use this image to define steps of business process with this image of pie chart. This image is an excellent tool to give an ideal presentation.

Stock Photo Multicolor Pie Chart For Business Result Analysis PowerPoint Slide
Develop competitive advantage with this image which contains 3d pie chart with five steps. Use this image to define steps of business process with this image of pie chart. This image is an excellent tool to give an ideal presentation.
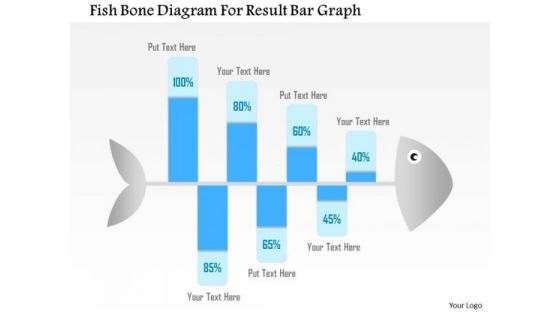
Business Diagram Fish Bone Diagram For Result Bar Graph Presentation Template
Graphic of fish bone has been used to design this Power Point template slide. This PPT slide contains the concept of problem analysis and root cause analysis. Use this PPT slide and display process of root cause analysis for any field. This PPT slide is very well designed for business and production related problem analysis.

Business Diagram Key Shaped Pie Graph For Result Display Presentation Template
Key shaped pie graph has been used to design this business diagram. This slide has key graphic with abcd options. Use this amazing slide to present a business plan. Download this slide to impress your viewers.
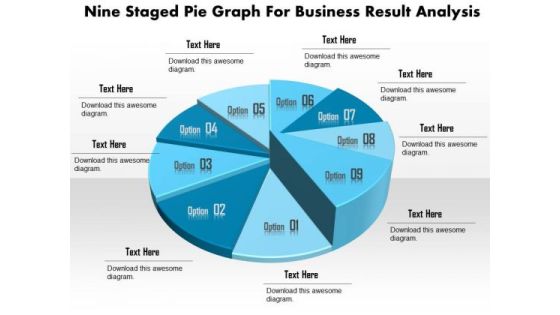
Business Diagram Nine Staged Pie Graph For Business Result Analysis Presentation Template
This business slide displays nine staged pie chart. This diagram is a data visualization tool that gives you a simple way to present statistical information. This slide helps your audience examine and interpret the data you present.

Business Diagram Six Staged 3d Pie Graph For Result Analysis Presentation Template
This business slide displays six staged pie chart. This diagram is a data visualization tool that gives you a simple way to present statistical information. This slide helps your audience examine and interpret the data you present.
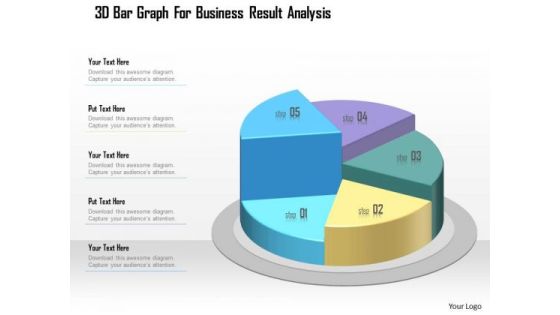
Business Diagram 3d Bar Graph For Business Result Analysis Presentation Template
This business slide displays five staged pie chart. This diagram is a data visualization tool that gives you a simple way to present statistical information. This slide helps your audience examine and interpret the data you present.
Business Diagram Pie Chart With Icons For Result Analysis Presentation Template
This business slide contains graphics of pie chart with business icons. Download this impressive diagram to present marketing performance measurement. This image slide is best to present your newer thoughts.

Business Diagram Bar Graph For Result Display On Mobile Presentation Template
This Power Point template has been designed with graphic of bar graph on mobile phone. This business diagram can be used to make business reports. Download this Power Point slide to build quality presentation for your viewers.
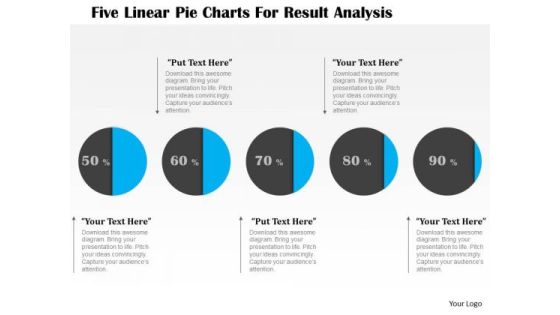
Business Diagram Five Linear Pie Charts For Result Analysis Presentation Template
This business diagram displays graphic of five staged process flow diagram. This PPT slide contains the concept of business data representation. Use this diagram to build professional presentation for your viewers.

Business Diagram 3d Graphic Colored Bar Graph For Business Result Analysis Presentation Template
This Power Point template has been designed with graphic of 3d graphic and colored bar graph. Use this slide to represent six steps of any business process. Use this diagram for your business presentations and get exclusive comments on your efforts.

Business Plan Methods Tools And Templates Set 2 SOAR Strength Opportunities Aspiration And Result Model Clipart PDF
This slide covers SOAR organization analysis model depicting strength opportunities, aspiration, results organization model including questions such as what can we build, what do we care about, what are stakeholders asking for and many more. This is a business plan methods tools and templates set 2 soar strength opportunities aspiration and result model clipart pdf template with various stages. Focus and dispense information on four stages using this creative set, that comes with editable features. It contains large content boxes to add your information on topics like result, aspiration, strengths, opportunities. You can also showcase facts, figures, and other relevant content using this PPT layout. Grab it now.

Analyze Results Business Ppt Slides
This is a analyze results business ppt slides. This is a one stage process. The stages in this process are business, success.
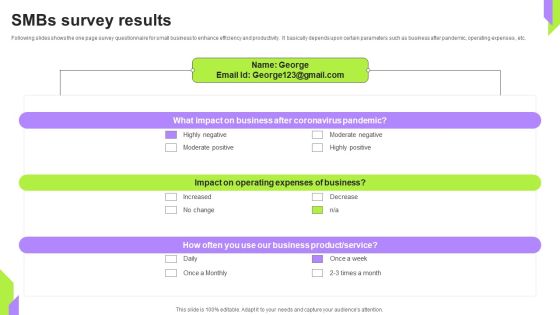
Smbs Survey Results Survey SS
Showcasing this set of slides titled Smbs Survey Results Survey SS. The topics addressed in these templates are Business, Increased, Moderate Negative . All the content presented in this PPT design is completely editable. Download it and make adjustments in color, background, font etc. as per your unique business setting.

Marketing Project Management Monitor Project Ppt Sample
This is a marketing project management monitor project ppt sample. This is a five stage process. The stages in this process are marketing project management, monitor project, develop and implement plans, set goals and strategy, research audience and channel option.

Project Administration Kpis Project Scorecard Demonstration PDF
Deliver an awe inspiring pitch with this creative Project Administration Kpis Project Scorecard Demonstration PDF bundle. Topics like Risk Legend, Resources, Cost can be discussed with this completely editable template. It is available for immediate download depending on the needs and requirements of the user.

Summary Of Site Survey Results Survey SS
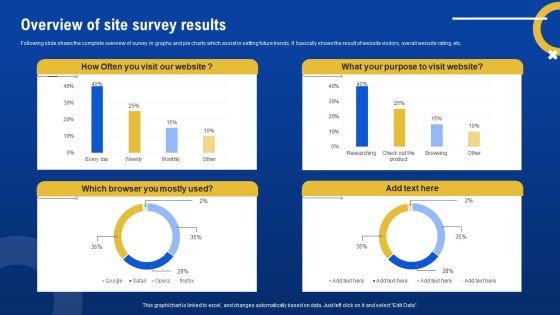
Following slide shows the complete overview of survey in graphs and pie charts which assist in setting future trends. It basically shows the result of website visitors, overall website rating, etc. Showcasing this set of slides titled Summary Of Site Survey Results Survey SS. The topics addressed in these templates are Summary, Site Survey Results. All the content presented in this PPT design is completely editable. Download it and make adjustments in color, background, font etc. as per your unique business setting.
Overview Of Site Survey Results Survey SS
Following slide shows the complete overview of survey in graphs and pie charts which assist in setting future trends. It basically shows the result of website visitors, overall website rating, etc. Pitch your topic with ease and precision using this Overview Of Site Survey Results Survey SS. This layout presents information on Overview, Site Survey Results. It is also available for immediate download and adjustment. So, changes can be made in the color, design, graphics or any other component to create a unique layout.

Technological Results Of Comparability Powerpoint Slide Designs
This is a technological results of comparability powerpoint slide designs. This is a two stage process. The stages in this process are technological results of comparability, managerial results of comparability.
Results Ppt PowerPoint Presentation Icon Graphics Download
This is a results ppt powerpoint presentation icon graphics download. This is a three stage process. The stages in this process are result, finance, marketing, strategy, analysis, business.
Results Ppt PowerPoint Presentation Slides Vector
This is a results ppt powerpoint presentation slides vector. This is a three stage process. The stages in this process are results, business, management, marketing.

Client Referrals Results Powerpoint Slide Show
This is a client referrals results powerpoint slide show. This is a three stage process. The stages in this process are series, year, success, planning, growth.

Analyze Results Ppt PowerPoint Presentation Slide
This is a analyze results ppt powerpoint presentation slide. This is a two stage process. The stages in this process are analysis, business, marketing, finance, pie chart.

Last 90 Days Results Ppt Slides
This is a last 90 days results ppt slides. This is a four stage process. The stages in this process are business, marketing.

Vision Processes Strategy Results Ppt Powerpoint Show
This is a vision processes strategy results ppt powerpoint show. This is a eight stage process. The stages in this process are mission, vision, strategy, processes, systems, performance management, behavior and action, results, performance management system, starting with the ultimate goal and mission of the organization, eventually aligning all business units, teams and individuals with strategy.

Analyzing Workplace Flexibility Survey Results Infographics PDF
The following slide outlines result of the remote working survey in the form of statistical data. Using this data the organizations can improve flexible work culture and boost workers morale in the organization. Slidegeeks is here to make your presentations a breeze with Analyzing Workplace Flexibility Survey Results Infographics PDF With our easy to use and customizable templates, you can focus on delivering your ideas rather than worrying about formatting. With a variety of designs to choose from, you are sure to find one that suits your needs. And with animations and unique photos, illustrations, and fonts, you can make your presentation pop. So whether you are giving a sales pitch or presenting to the board, make sure to check out Slidegeeks first.

Our Research Results Ppt PowerPoint Presentation Model
This is a our research results ppt powerpoint presentation model. This is a four stage process. The stages in this process are research, financials, business, marketing, management, success.

Analyze Results Ppt PowerPoint Presentation Guide
This is a analyze results ppt powerpoint presentation guide. This is a three stage process. The stages in this process are icon, percentage, finance, man, present.
Final 90 Days Results Presentation Layouts
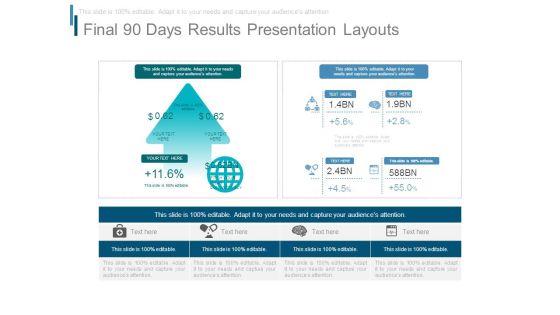
This is a final 90 days results presentation layouts. This is a two stage process. The stages in this process are business, marketing, management, strategy, presentation.

Company Research Results Dashboard Ppt Background Graphics
This is a company research results dashboard ppt background graphics. This is a four stage process. The stages in this process are growth, business, marketing, year.
Results Ppt Powerpoint Presentation Infographics File Formats
This is a results ppt powerpoint presentation infographics file formats. This is a three stage process. The stages in this process are analysis, icon, business, marketing, strategy, finance.
Valuation Results Ppt PowerPoint Presentation Icon Deck
This is a valuation results ppt powerpoint presentation icon deck. This is a one stage process. The stages in this process are business, finance, analysis, marketing, strategy.

Statistics Results Ppt PowerPoint Presentation Summary Example
This is a statistics results ppt powerpoint presentation summary example. This is a two stage process. The stages in this process are finance, media, data, assets, funding.
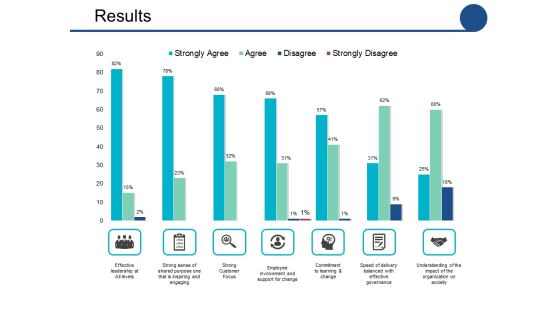
Results Ppt PowerPoint Presentation Ideas Graphics Example
This is a results ppt powerpoint presentation ideas graphics example. This is a seven stage process. The stages in this process are percentage, business, marketing, management.

Results Ppt PowerPoint Presentation Model Graphics
This is a results ppt powerpoint presentation model graphics. This is a seven stage process. The stages in this process are finance, marketing, analysis, business, investment.

Results Ppt PowerPoint Presentation Styles Background Images
This is a results ppt powerpoint presentation styles background images. This is a four stage process. The stages in this process are finance, marketing, management, investment, analysis.

survey results ppt powerpoint presentation pictures guidelines
This is a survey results ppt powerpoint presentation pictures guidelines. This is a eight stage process. The stages in this process are finance, marketing, management, investment, analysis.

Customer Focused Results Driven Ppt Slide
This is a customer focused results driven ppt slide. This is a five stage process. The stages in this process are time planning, success, business and marketing.

Brainstorming Session Results Powerpoint Slides Design
This is a brainstorming session results powerpoint slides design. This is a three stage process. The stages in this process are business, marketing, strategy, management, presentation.
Introduction Preliminary Results Powerpoint Slide Background Designs
This is a introduction preliminary results powerpoint slide background designs. This is a four stage process. The stages in this process are business, marketing, preliminary, technology, management.

Analyze Results Ppt PowerPoint Presentation Slides
This is a analyze results ppt powerpoint presentation slides. This is a five stage process. The stages in this process are semi, board, strategy, management, marketing.
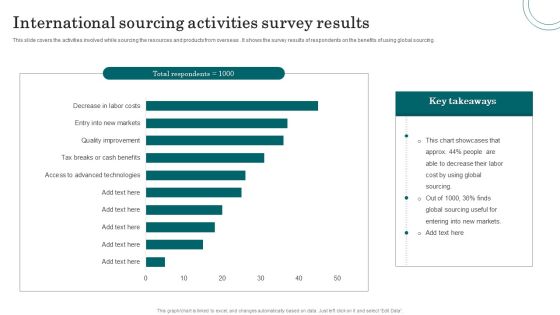
International Sourcing Activities Survey Results Microsoft PDF
This slide covers the activities involved while sourcing the resources and products from overseas . It shows the survey results of respondents on the benefits of using global sourcing. Pitch your topic with ease and precision using this International Sourcing Activities Survey Results Microsoft PDF. This layout presents information on Global Sourcing, Labor Cost, Markets. It is also available for immediate download and adjustment. So, changes can be made in the color, design, graphics or any other component to create a unique layout.
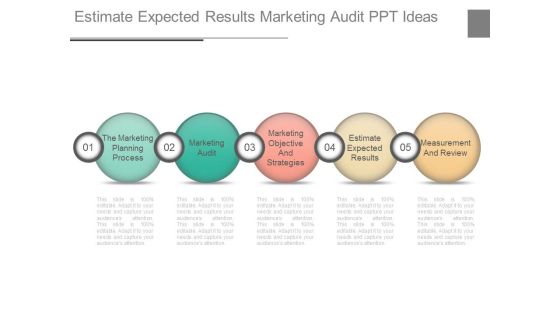
Estimate Expected Results Marketing Audit Ppt Ideas
This is a estimate expected results marketing audit ppt ideas. This is a five stage process. The stages in this process are circle charts, shapes success.

Biotechnology Company Employee Monitoring Results Demonstration PDF
Showcasing this set of slides titled biotechnology company employee monitoring results demonstration pdf. The topics addressed in these templates are biotechnology company employee monitoring results. All the content presented in this PPT design is completely editable. Download it and make adjustments in color, background, font etc. as per your unique business setting.

Customer Onboarding Journey Survey Results Clipart PDF
This exhibits the survey results for client onboarding journey. Major results covered are customers change brands if purchase procedure is difficult, customers prefer personalization, highly engaged users make more purchases, etc. Crafting an eye-catching presentation has never been more straightforward. Let your presentation shine with this tasteful yet straightforward Customer Onboarding Journey Survey Results Clipart PDF template. It offers a minimalistic and classy look that is great for making a statement. The colors have been employed intelligently to add a bit of playfulness while still remaining professional. Construct the ideal Customer Onboarding Journey Survey Results Clipart PDF that effortlessly grabs the attention of your audience Begin now and be certain to wow your customers

Net Promoter Score Results Ppt Powerpoint Show
This is a net promoter score results ppt powerpoint show. This is a five stage process. The stages in this process are net promoter score, detractors, passief tevredenen, promotors, passives, response breakdown.

Results Ppt PowerPoint Presentation Summary Inspiration
This is a results ppt powerpoint presentation summary inspiration. This is a seven stage process. The stages in this process are effective leadership at all levels, strong customer focus, commitment to learning and change.

Results Of Staff Engagement Plan Elements PDF
The following slide showcases activities performed to improve employee engagement. The table includes name of employee, area of improvement, initiative taken and results. Pitch your topic with ease and precision using this Results Of Staff Engagement Plan Elements PDF. This layout presents information on Performing Team Activities, Improved Productivity, Employee. It is also available for immediate download and adjustment. So, changes can be made in the color, design, graphics or any other component to create a unique layout.

Technology Sales Enablement Survey Results Pictures PDF
The following slide showcase survey results conducted to find out the usage of sales enablement technology in organizations. The responses covered are maximum benefit to teams and improved efficiency.Pitch your topic with ease and precision using this Technology Sales Enablement Survey Results Pictures PDF. This layout presents information on Teams Benefited, Sales Marketing, Percent Respondents. It is also available for immediate download and adjustment. So, changes can be made in the color, design, graphics or any other component to create a unique layout.
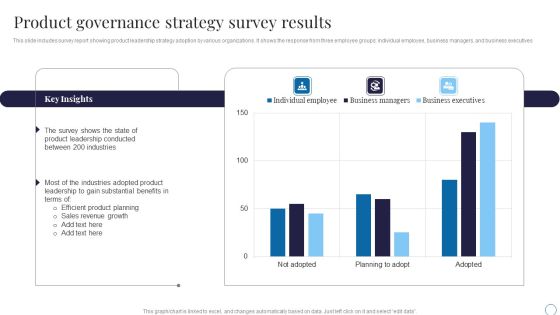
Product Governance Strategy Survey Results Guidelines PDF
This slide includes survey report showing product leadership strategy adoption by various organizations. It shows the response from three employee groups individual employee, business managers, and business executives.Showcasing this set of slides titled Product Governance Strategy Survey Results Guidelines PDF. The topics addressed in these templates are Leadership Conducted, Industries Adopted, Revenue Growth. All the content presented in this PPT design is completely editable. Download it and make adjustments in color, background, font etc. as per your unique business setting.
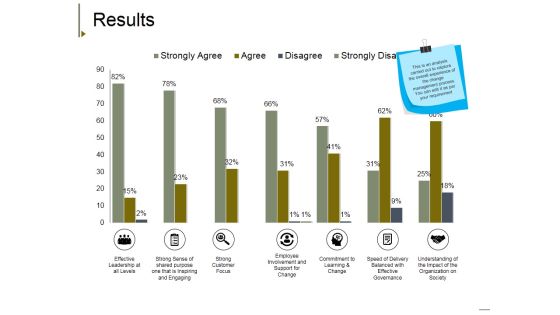
Results Ppt PowerPoint Presentation Model Gallery
This is a results ppt powerpoint presentation model gallery. This is a seven stage process. The stages in this process are effective leadership at all levels, strong sense of shared purpose one that is inspiring and engaging, strong customer focus, employee involvement and support for change, understanding of the impact of the organization on society.

Employee Staffing Data Survey Results Mockup PDF
The following slide depicts survey results conducted for HR and recruited to find out details related to recruitment. The slide includes usage of twitter list to find candidates, job portals to advertise positions and social media to screen candidates. Showcasing this set of slides titled Employee Staffing Data Survey Results Mockup PDF. The topics addressed in these templates are Social Media, Recruiters, Advertise. All the content presented in this PPT design is completely editable. Download it and make adjustments in color, background, font etc. as per your unique business setting.

Quantitative Market Research Survey Results Structure PDF
This slide showcases market survey conducted and data gathered by various people to know the topics that drive better customer engagement. It also covers the location of the users. Pitch your topic with ease and precision using this Quantitative Market Research Survey Results Structure PDF. This layout presents information on Marketing Manager, Customer Support, Data Analyst. It is also available for immediate download and adjustment. So, changes can be made in the color, design, graphics or any other component to create a unique layout.
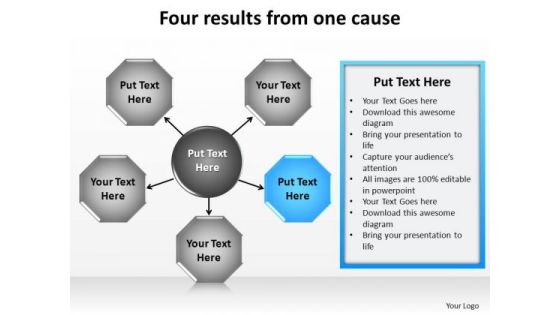
PowerPoint Presentation Chart Four Results Ppt Theme
PowerPoint Presentation Chart Four Results PPT Theme-The Circle of Life - a concept emmbedded in our minds and hence easy to comprehend. Life and Business is made up of processes comprising stages that flow from one to another. An excellent graphic to attract the attention of and understanding by your audience to improve earnings.-These amazing PowerPoint pre-designed slides and PowerPoint templates have been carefully created by our team of experts to help you impress your audience. Our stunning collection of Powerpoint slides are 100% editable and can easily fit in any PowerPoint presentations. By using these animations and graphics in PowerPoint and you can easily make professional presentations. Any text can be entered at any point in the PowerPoint template or slide. Just DOWNLOAD our awesome PowerPoint templates and you are ready to go.

Search Results Organic Vs Paid Training Ppt
The purpose of this slide is to provide information regarding the two types of search results, i.e. organic and paid search. It also compares the two on the basis of cost, time taken to deliver results, and longevity.

 Home
Home