Project Result

Kpis For Customer Satisfaction Survey Outcome Formats PDF
This slide outlines strategies that can help organization to improve the customer service KPIs which are net promoter score, average resolution time, customer satisfaction score and average response time . It also showcases result before and after the implementation of improvement tactics. Persuade your audience using this Kpis For Customer Satisfaction Survey Outcome Formats PDF. This PPT design covers four stages, thus making it a great tool to use. It also caters to a variety of topics including Improvement Strategy, Results Before Implementation, Results After Implementation. Download this PPT design now to present a convincing pitch that not only emphasizes the topic but also showcases your presentation skills.

Key Performance Indicator For Business Partner Lifecycle Brochure PDF
The following slide highlights the key performance indicator for partner lifecycle management illustrating key heading which includes key result area, key performance indicator and result. It also showcases key result area depicts contract management, on time delivery, order collaboration, quality, design collaboration, sourcing and invoice management. Showcasing this set of slides titled Key Performance Indicator For Business Partner Lifecycle Brochure PDF. The topics addressed in these templates are Key Performance Indicator, Inventory Hoarding, Design Collaboration. All the content presented in this PPT design is completely editable. Download it and make adjustments in color, background, font etc. as per your unique business setting.
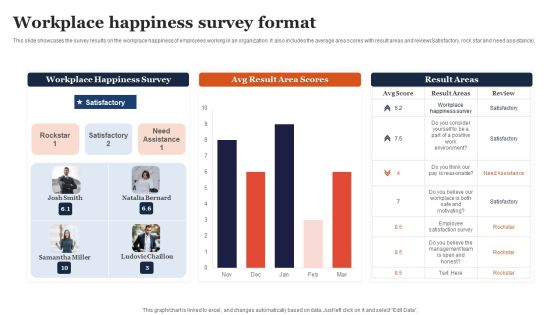
Workplace Happiness Survey Format Ppt Model Brochure PDF
This slide showcases the survey results on the workplace happiness of employees working in an organization. It also includes the average area scores with result areas and review Satisfactory, rock star and need. Pitch your topic with ease and precision using this Workplace Happiness Survey Format Ppt Model Brochure PDF. This layout presents information on Workplace Happiness Survey, Avg Result, Area Scores. It is also available for immediate download and adjustment. So, changes can be made in the color, design, graphics or any other component to create a unique layout.
Stock Performance Dashboard For Metrics Team Management Ppt Outline Icons PDF
This slide represents the dashboard for tracking the management team member, manager, and teams ability to ensure inventory accuracy over time. It includes KPIs such as inventory, average result area scores and result areas. Pitch your topic with ease and precision using this Stock Performance Dashboard For Metrics Team Management Ppt Outline Icons PDF. This layout presents information on Result areas, Metrics Team, Needs Help. It is also available for immediate download and adjustment. So, changes can be made in the color, design, graphics or any other component to create a unique layout.
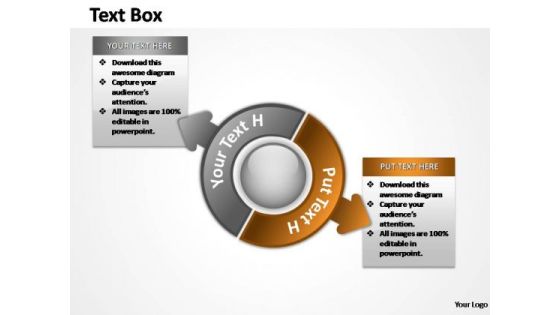
PowerPoint Slides Sales Steps Ppt Slide Designs
Circular business process chart assist you in creating your project roadmap with different ways, interim goals and project steps.
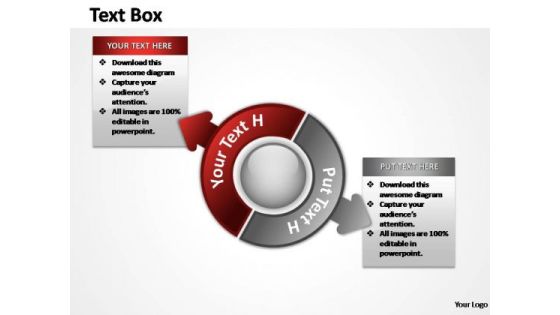
PowerPoint Themes Marketing Steps Ppt Templates
Circular business process chart assist you in creating your project roadmap with different ways, interim goals and project steps.
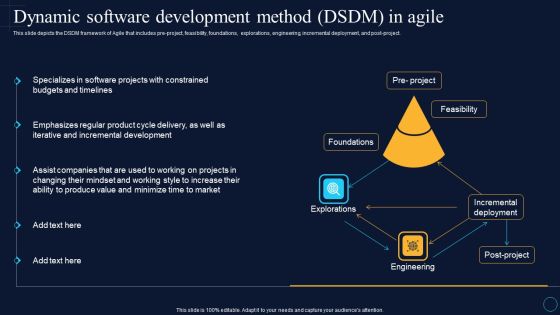
Dynamic Software Development Method Dsdm Software Development Approaches Inspiration PDF
This slide depicts the DSDM framework of Agile that includes pre-project, feasibility, foundations, explorations, engineering, incremental deployment, and post-project.Whether you have daily or monthly meetings, a brilliant presentation is necessary. Dynamic Software Development Method Dsdm Software Development Approaches Inspiration PDF can be your best option for delivering a presentation. Represent everything in detail using Dynamic Software Development Method Dsdm Software Development Approaches Inspiration PDF and make yourself stand out in meetings. The template is versatile and follows a structure that will cater to your requirements. All the templates prepared by Slidegeeks are easy to download and edit. Our research experts have taken care of the corporate themes as well. So, give it a try and see the results.

Business Assessment Ppt Chart Powerpoint Slides Show
This is a business assessment ppt chart powerpoint slides show. This is a six stage process. The stages in this process are mission, goals, objectives, outcomes, result analysis, action.
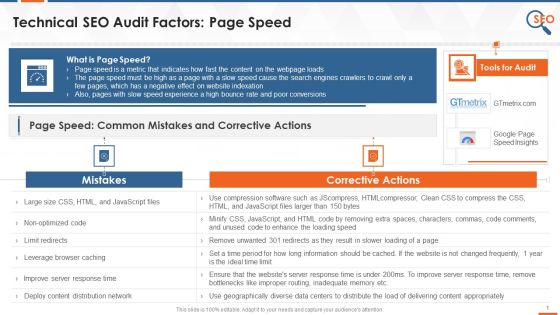
SEO Audit Inspection Factor Speed Issues Training Ppt
This slide provides an information regarding the page speed and major tools to audit it. It also includes details of major mistakes that result in slow page speed and corrective actions to improve it.
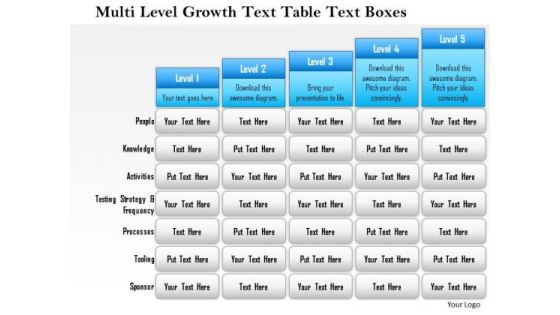
Business Framework Multi Level Growth Text Table Text Boxes 2 PowerPoint Presentation
Five staged text box style chart in bar graph design has been used to decorate this power point template slide. This diagram slide contains the multilevel growth concept. Use this PPT slide for financial growth and result analysis related topics.

Call Tracking Database Layout Powerpoint Show
This is a call tracking database layout powerpoint show. This is a six stage process. The stages in this process are google yahoo bing, off line advertising, social media, affiliates, customer calls, result reports.

Infinity Funnel For Cro Sample Diagram Sample Ppt Files
This is a infinity funnel for cro sample diagram sample ppt files. This is a eight stage process. The stages in this process are user research, result analysis, development, test archive, attract, upsell, support, convert, growth and insights.

Analysis Strategic Model Example Powerpoint Slides Design
This is a analysis strategic model example powerpoint slides design. This is a eight stage process. The stages in this process are mission, objectives, each outcome, action, goal, outcomes, result analysis, program improvement.

Core Competence Analysis Template Ppt Slides
This is a core competence analysis template ppt slides. This is a four stage process. The stages in this process are result outcome, personal split, communication, mission strategy, competency model.
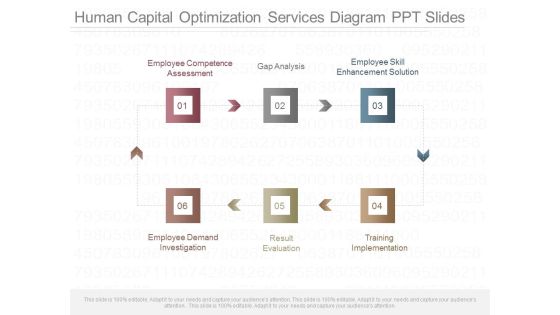
Human Capital Optimization Services Diagram Ppt Slides
This is a human capital optimization services diagram ppt slides. This is a six stage process. The stages in this process are employee competence assessment, gap analysis, employee skill enhancement solution, employee demand investigation, result evaluation, training implementation.
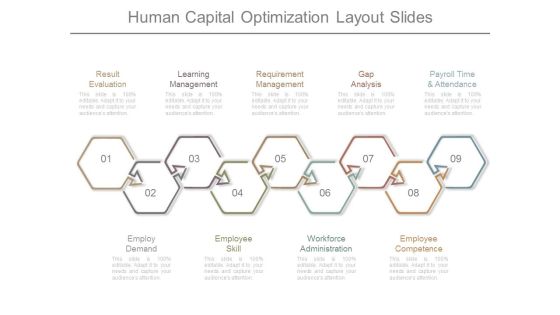
Human Capital Optimization Layout Slides
This is a human capital optimization layout slides. This is a nine stage process. The stages in this process are result evaluation, learning management, requirement management, gap analysis, payroll time and attendance, employ demand, employee skill, workforce administration, employee competence.
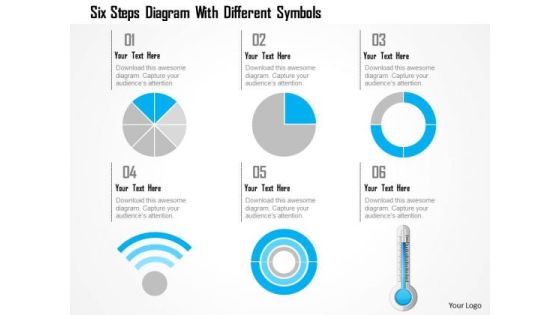
Business Diagram Six Steps Diagram With Different Symbols Presentation Template
This power point template has been crafted with graphic of 3d pie charts with Wi-Fi symbol and thermometer. This PPT contains the concept of calculation and result analysis. Use this PPT for your business and science related presentations.

Online Market For B2b Sample Diagram Slides
This is a online market for b2b sample diagram slides. This is a four stage process. The stages in this process are affordable, wider ta, result oriented, direct, online market for b2b.

Category Management Training Chart Ppt Slides Styles
This is a category management training chart ppt slides styles. This is a four stage process. The stages in this process are category prioritization and assessment, result tracking and reporting, category strategy development, supplier relationship.

Business Diagram Eight Staged Circular Puzzle Bar Graph Presentation Template
This Power Point template has been crafted with graphic of eight staged circular puzzle and bar graph. This PPT contains the financial result analysis related concept. Use this PPT for your business and success related presentations.
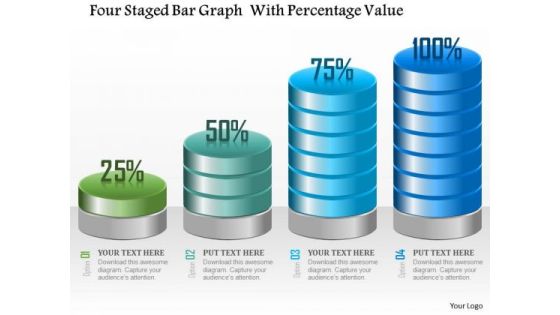
Business Diagram Four Staged Bar Graph With Percentage Value Presentation Template
Four staged bar graph with percentage value has been used to craft this power point template. This PPT contains the concept of making financial timeline and result analysis. This PPT can be used for business and finance related presentations.

3d Man On The Top Of Puzzle Bar Graph
This PPT has been designed with graphic of 3d man and puzzle are graph. This PPT displays the concept of result analysis and financial growth. Use this PPT for your business and finance related presentations.
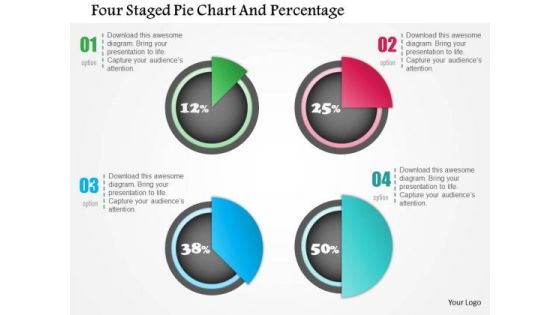
Business Diagram Four Staged Pie Chart And Percentage Presentation Template
Four staged pie chart and percentage values has been used to design this power point template. This PPT contains the concept of financial result analysis. Use this PPT for business and marketing related presentations.

Business Diagram Line Graph For Dollar Growth Presentation Template
Graphic of dollar symbol and growth arrow has been used to design this power point template. This diagram contains the concept of financial result analysis. Use this business diagram for finance related presentations
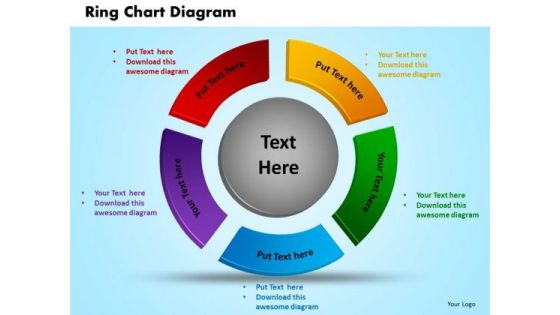
PowerPoint Presentation Ring Chart Diagram Business Ppt Slides
PowerPoint Presentation Ring Chart Diagram Business PPT Slides-This Business Oriented PowerPoint Diagram signifies the five approaches inter-related to each other and result in one issue. This Diagram will fit for Business Presentations.-PowerPoint Presentation Ring Chart Diagram Business PPT Slides

Strategy And Trade Evaluation Process Example Presentation Slides
This is a strategy and trade evaluation process example presentation slides. This is a eight stage process. The stages in this process are process association, business clarity, swot analysis, review and adjust, result orientation, operational expertise, review input, define strategies.
Three Steps Venn Diagram With Icons Powerpoint Slides
This power point template has been designed with graphic of Venn diagram. Use this Venn diagram for business result analysis. Illustrate your ideas and imprint them in the minds of your team with this template.
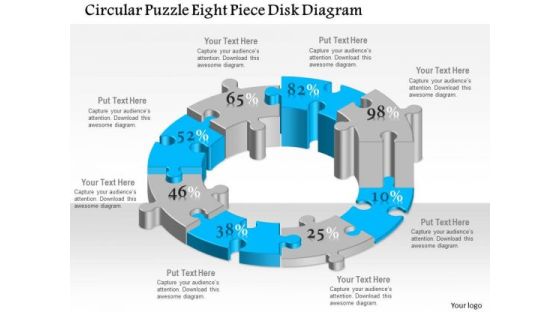
Business Diagram Circular Puzzle Eight Piece Disk Diagram Presentation Template
This business plan power point template has been designed with six staged circular puzzle diagram. This diagram template contains the concept of business process flow and result analysis representation. Use this diagram in your presentation and show these concepts.

Business Framework Merger And Acquisition Synergy PowerPoint Presentation
This Power Point template slide has been designed with graphic of semicircular design for result display on graph. This design can be used for merger and acquisition for synergy. Use this PPT slide for your business presentation.

Business Diagram Venn Diagram With Three Steps Presentation Template
This slide displays Venn diagram with three steps presentation template. This power point template has been designed with graphic of Venn diagram. Use this Venn diagram for business result analysis. Build business presentations with analysis practices with this Venn diagram.
Business Framework Business Brand Anchor PowerPoint Presentation
Explain the concept of new idea generation with this exclusive PPT slide. This PPT contain the graphic of two bulbs making a Venn diagram. This PPT can be used for any business presentation to representation result analysis.
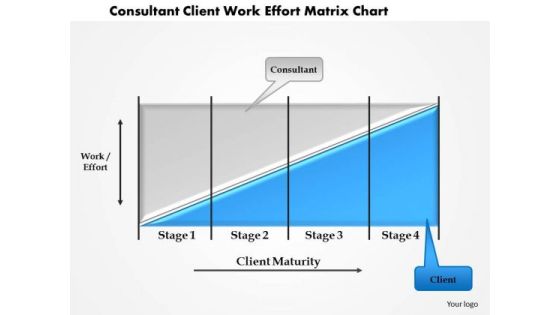
Business Framework Consultant Client Work Effort Matrix Chart PowerPoint Presentation
This business power point template slide has been crafted with graphic of bar graph. This bar graph is called as coase theorem. Use this professional diagram for your result analysis related presentation.

Business Framework 10 Percent To 90 Percent PowerPoint Presentation
This business diagram has been designed with graphic of multiple pie graphs. This diagram slide contains the concept of result analysis with percentage values. Use this diagram to present and compare data in an impressive manner

Business Diagram Business People Over Bar Chart PowerPoint Template
This Power Point template has been designed with graphic of business people and bar chart. This PPT contains the concept of result analysis and business data display. Use this PPT slide for your business and marketing related presentations.

Magnifying Glass On 3d Red Leader PowerPoint Templates
Graphic of persons with magnifier has been used to design this power point template. This 3d diagram contains the concept of right people selection. You have identified the key result areas. Focus on each through this slide.

Magnifying Glass On Blue Person PowerPoint Templates
Graphic of persons with magnifier has been used to design this power point template. This 3d diagram contains the concept of right people selection. You have identified the key result areas. Focus on each through this slide.
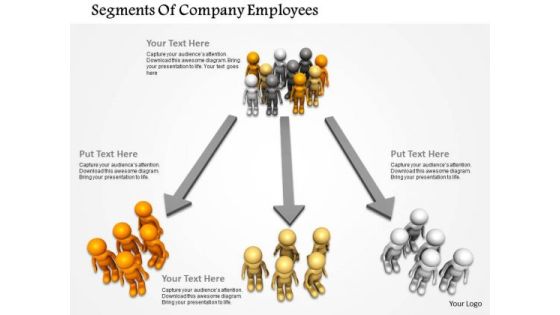
Segments Of Company Employees PowerPoint Templates
Concept of three way customer segmentation has been defined in this power point template. This 3d diagram contains the graphic of customers group and way. You have identified the key result areas. Focus on each through this slide.
Target And Acquire New Customers PowerPoint Templates
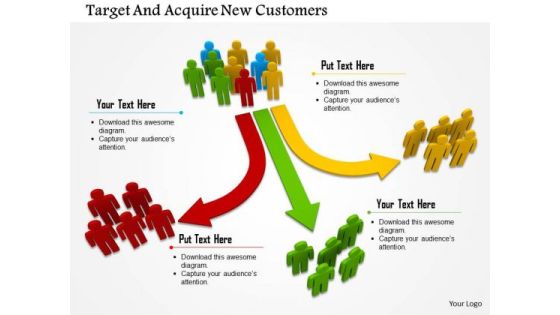
Concept of three way customer segmentation has been defined in this power point template. This 3d diagram contains the graphic of customers group and way. You have identified the key result areas. Focus on each through this slide.

Comparison Of Agile Change Approaches Ppt Portfolio Ideas PDF
Following slide exhibits comparison of lean transformation methodologies. It includes major parameters such as- data centric, financial accountability and sustainability result and so on. Showcasing this set of slides titled comparison of agile change approaches ppt portfolio ideas pdf. The topics addressed in these templates are methodology, benefits, implementation cost, financial accountability, sustainable results. All the content presented in this PPT design is completely editable. Download it and make adjustments in color, background, font etc. as per your unique business setting.
Product Launch Team Performance Dashboard Product Release Commencement Structure PDF
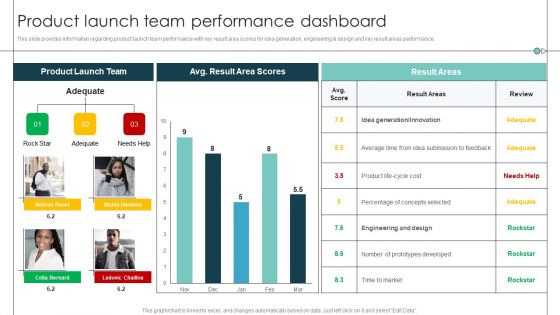
This slide provides information regarding product launch team performance with key result area scores for idea generation, engineering and design and key result areas performance. Deliver and pitch your topic in the best possible manner with this Product Launch Team Performance Dashboard Product Release Commencement Structure PDF. Use them to share invaluable insights on Average Time, Prototypes Developed, Percentage Concepts and impress your audience. This template can be altered and modified as per your expectations. So, grab it now.

New Product Launch Playbook Product Launch Team Performance Dashboard Elements PDF
This slide provides information regarding product launch team performance with key result area scores for idea generation, engineering and design and key result areas performance. Deliver an awe inspiring pitch with this creative new product launch playbook product launch team performance dashboard elements pdf bundle. Topics like product launch team performance dashboard can be discussed with this completely editable template. It is available for immediate download depending on the needs and requirements of the user.

KPI Dashboard Showcasing Product Management Guidelines PDF
This slide showcases dashboard providing product development team performance status with determined KPIs. It provides details such as product development team score, average result scores and result KPIs. Pitch your topic with ease and precision using this KPI Dashboard Showcasing Product Management Guidelines PDF. This layout presents information on Average Rating, Innovation, Design. It is also available for immediate download and adjustment. So, changes can be made in the color, design, graphics or any other component to create a unique layout.

Product Engineering Performance And Development Metrics Dashboard Topics PDF
This slide covers product engineering and development KPI dashboard to improve effectiveness. It involves data such as product development team, average result area scores and key result areas. Showcasing this set of slides titled Product Engineering Performance And Development Metrics Dashboard Topics PDF. The topics addressed in these templates are Product Development Team, Average, Cost. All the content presented in this PPT design is completely editable. Download it and make adjustments in color, background, font etc. as per your unique business setting.

Content Freelance Marketing Engagement Metrics Elements PDF
The following slide highlights the content freelance marketing engagement metrics illustrating metrics which includes shares, benchmark, target, result and variance to measure the result and variance with target. Showcasing this set of slides titled Content Freelance Marketing Engagement Metrics Elements PDF. The topics addressed in these templates are Metrics, Survey Completion Rate, Bounce Rate. All the content presented in this PPT design is completely editable. Download it and make adjustments in color, background, font etc. as per your unique business setting.

Business Impact Analysis Process Framework Ppt Gallery Graphics Template PDF
This slide represents business impact assessment process. It includes business inputs, organization identification, impact analysis, results analysis, resource prioritization and recover plan. Showcasing this set of slides titled Business Impact Analysis Process Framework Ppt Gallery Graphics Template PDF. The topics addressed in these templates are Organization Identification, Impact Analysis, Result Analysis, Recovery Plan. All the content presented in this PPT design is completely editable. Download it and make adjustments in color, background, font etc. as per your unique business setting.

Employee Key Performance Indicators With Scores Themes PDF
The following slide highlights the staff key performance Indicators with scores illustrating key headings which includes staff performance , average scores and team result areas Pitch your topic with ease and precision using this Employee Key Performance Indicators With Scores Themes PDF This layout presents information on Staff Performance, Average Scores, Team Result It is also available for immediate download and adjustment. So, changes can be made in the color, design, graphics or any other component to create a unique layout.

Product Overview Template 1 Ppt PowerPoint Presentation Model Visual Aids
This is a product overview template 1 ppt powerpoint presentation model visual aids. This is a four stage process. The stages in this process are problem statement, project description, project goals and objectives, assumptions, project scope, project inclusions, project exclusions, critical success factors.
Product Overview Template 1 Ppt PowerPoint Presentation Pictures Files
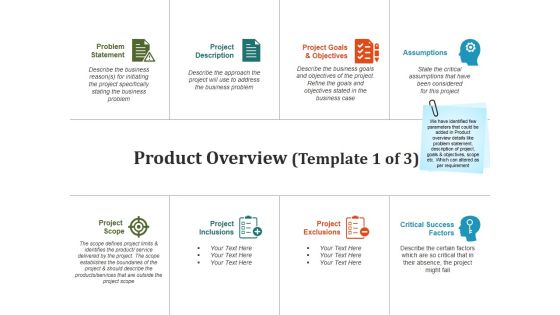
This is a product overview template 1 ppt powerpoint presentation pictures files. This is a four stage process. The stages in this process are problem statement, project description, project goals and objectives, assumptions, critical success factors, project exclusions, project inclusions, project scope.
Major Findings Of Mobile-Friendliness Test Mobile Search Engine Optimization Guide Introduction PDF
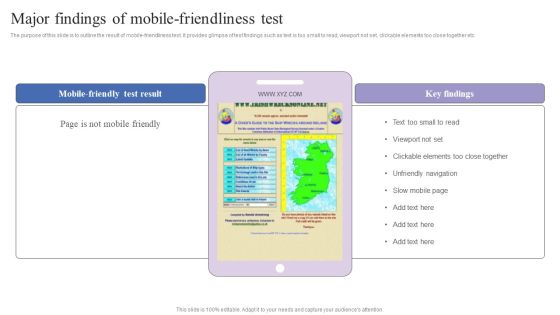
The purpose of this slide is to outline the result of mobile-friendliness test. It provides glimpse of test findings such as text is too small to read, viewport not set, clickable elements too close together etc. If your project calls for a presentation, then Slidegeeks is your go-to partner because we have professionally designed, easy-to-edit templates that are perfect for any presentation. After downloading, you can easily edit Major Findings Of Mobile-Friendliness Test Mobile Search Engine Optimization Guide Introduction PDF and make the changes accordingly. You can rearrange slides or fill them with different images. Check out all the handy templates.

Best Ways To Analyze Effectiveness Of Email Marketing Graphics PDF
This slide showcases best and effective ways to analyse the result of email marketing. It includes metrics such as check CTR, evaluate conversion rates, bounce rate, conduct A B testing and revenue generation. If your project calls for a presentation, then Slidegeeks is your go-to partner because we have professionally designed, easy-to-edit templates that are perfect for any presentation. After downloading, you can easily edit Best Ways To Analyze Effectiveness Of Email Marketing Graphics PDF and make the changes accordingly. You can rearrange slides or fill them with different images. Check out all the handy templates
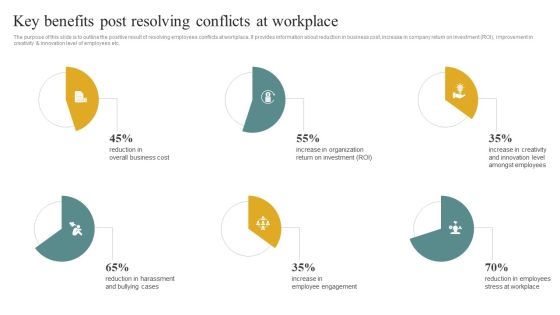
Key Benefits Post Resolving Conflicts At Workplace Managing Organizational Conflicts To Boost Sample PDF
The purpose of this slide is to outline the positive result of resolving employees conflicts at workplace. It provides information about reduction in business cost, increase in company return on investment ROI, improvement in creativity innovation level of employees etc. If your project calls for a presentation, then Slidegeeks is your go-to partner because we have professionally designed, easy-to-edit templates that are perfect for any presentation. After downloading, you can easily edit Key Benefits Post Resolving Conflicts At Workplace Managing Organizational Conflicts To Boost Sample PDF and make the changes accordingly. You can rearrange slides or fill them with different images. Check out all the handy templates.
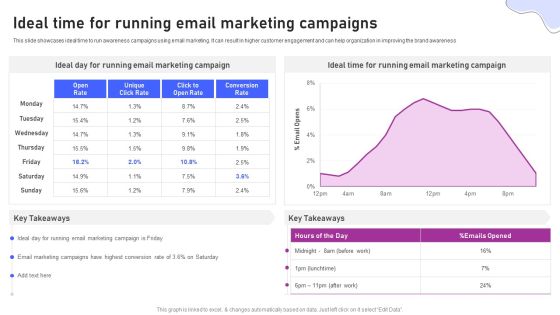
Strategies For Marketing Ideal Time For Running Email Marketing Campaigns Information PDF
This slide showcases ideal time to run awareness campaigns using email marketing. It can result in higher customer engagement and can help organization in improving the brand awareness. If your project calls for a presentation, then Slidegeeks is your go-to partner because we have professionally designed, easy-to-edit templates that are perfect for any presentation. After downloading, you can easily edit Strategies For Marketing Ideal Time For Running Email Marketing Campaigns Information PDF and make the changes accordingly. You can rearrange slides or fill them with different images. Check out all the handy templates
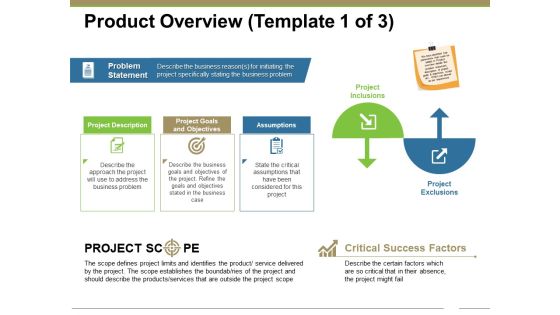
Product Overview Template 1 Ppt PowerPoint Presentation Portfolio Influencers
This is a product overview template 1 ppt powerpoint presentation portfolio influencers. This is a three stage process. The stages in this process are project description, assumptions, project inclusions, project exclusions, problem statement.
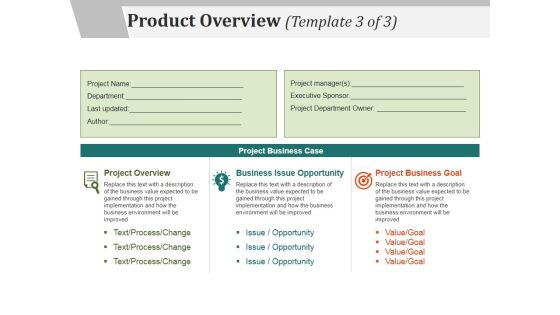
Product Overview Template 3 Ppt PowerPoint Presentation Show Templates
This is a product overview template 3 ppt powerpoint presentation show templates. This is a three stage process. The stages in this process are project overview, business issue opportunity, project business goal, project business case.
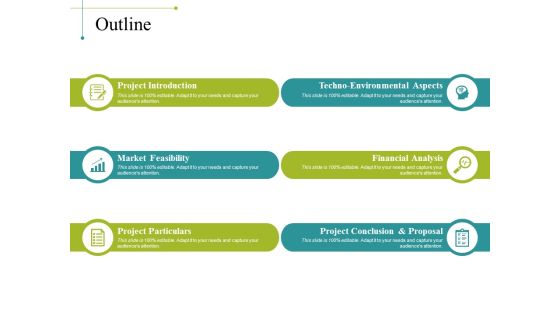
Outline Ppt PowerPoint Presentation Summary Graphics Example
This is a outline ppt powerpoint presentation summary graphics example. This is a six stage process. The stages in this process are project introduction, market feasibility, project particulars, financial analysis, project conclusion and proposal.
Product Overview Template 1 Ppt PowerPoint Presentation Icon Model
This is a product overview template 1 ppt powerpoint presentation icon model. This is a eight stage process. The stages in this process are problem statement, project scope, project exclusions, project inclusions.
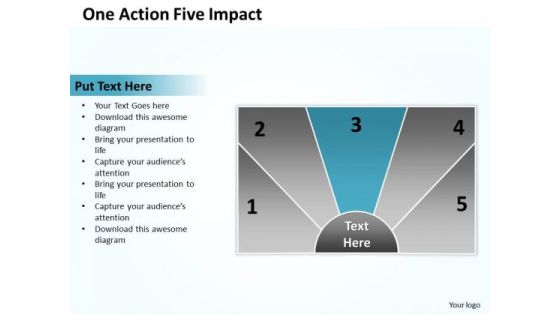
Sample Business Model Diagram One Action Five Impact PowerPoint Slides
We present our sample business model diagram one action five impact PowerPoint Slides.Download our Process and flows PowerPoint Templates because Our PowerPoint Templates and Slides are topically designed to provide an attractive backdrop to any subject. Use our Flow Charts PowerPoint Templates because It will get your audience in sync. Present our Business PowerPoint Templates because You can Be the star of the show with our PowerPoint Templates and Slides. Rock the stage with your ideas. Download our Marketing PowerPoint Templates because Your audience will believe you are the cats whiskers. Use our Shapes PowerPoint Templates because Our PowerPoint Templates and Slides will effectively help you save your valuable time. They are readymade to fit into any presentation structure. Use these PowerPoint slides for presentations relating to Business, chart, clipart, commerce, commitment, concept, conceptual, corporate, design, diagram, goals, guide, guidelines, hierarchy, icon, idea, illustration, manage, management, map, marketing, mind, mission, model, organization, performance, plans, principles, process, project, reliability, representation, resource, results, strategy, success. The prominent colors used in the PowerPoint template are Blue , Black, Gray. Professionals tell us our sample business model diagram one action five impact PowerPoint Slides are topically designed to provide an attractive backdrop to any subject. Presenters tell us our commitment PowerPoint templates and PPT Slides are designed by professionals The feedback we get is that our sample business model diagram one action five impact PowerPoint Slides provide great value for your money. Be assured of finding the best projection to highlight your words. Use our concept PowerPoint templates and PPT Slides are the best it can get when it comes to presenting. You can be sure our sample business model diagram one action five impact PowerPoint Slides will help them to explain complicated concepts. Customers tell us our conceptual PowerPoint templates and PPT Slides help you meet deadlines which are an element of today's workplace. Just browse and pick the slides that appeal to your intuitive senses.
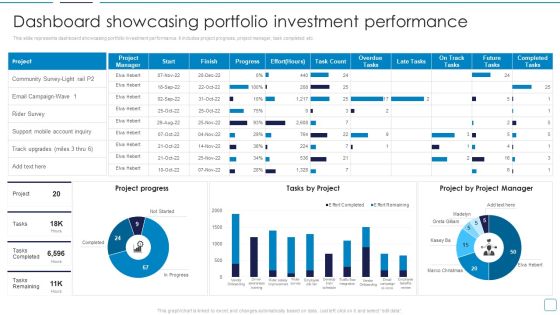
Portfolio Wealth Management Dashboard Showcasing Portfolio Investment Structure PDF
This slide represents dashboard showcasing portfolio investment performance. It includes project progress, project manager, task completed etc. Deliver an awe inspiring pitch with this creative Portfolio Wealth Management Dashboard Showcasing Portfolio Investment Structure PDF bundle. Topics like Tasks Project, Project Project Manager, Project Progress can be discussed with this completely editable template. It is available for immediate download depending on the needs and requirements of the user.

Team Building Activities For Educators Ppt Presentation
This is a team building activities for educators ppt presentation. This is a four stage process. The stages in this process are project goal, project roles, procedures, relations.

Compliance Testing IT Process Of Conducting Load Testing Diagrams PDF
This slide describes the process of conducting load testing, including test environment setup, load test scenarios, test scenario execution, test result analysis, and re-test. Presenting Compliance Testing IT Process Of Conducting Load Testing Diagrams PDF to provide visual cues and insights. Share and navigate important information on five stages that need your due attention. This template can be used to pitch topics like Test Scenario Execution, Test Result Analysis, Test Environment Setup. In addtion, this PPT design contains high resolution images, graphics, etc, that are easily editable and available for immediate download.
 Home
Home