Project Phases
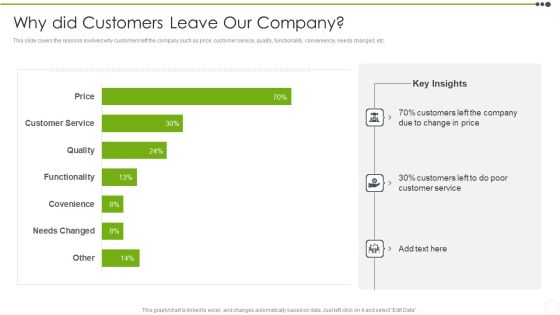
Estimating The Price Why Did Customers Leave Our Company Slides PDF
This slide covers the reasons involved why customers left the company such as price, customer service, quality, functionality, convenience, needs changed, etc. Deliver an awe inspiring pitch with this creative Estimating The Price Why Did Customers Leave Our Company Slides PDF bundle. Topics like Customers, Price, Service can be discussed with this completely editable template. It is available for immediate download depending on the needs and requirements of the user.

Brand Awareness Measuring Kpi Dashboard Brand Value Estimation Guide Formats PDF
Following slide illustrates KPI dashboard that can be used to track the awareness level of a specific brand. KPIs covered in the slide are traffic, attention, authority, inbound channel performance etc.There are so many reasons you need a Brand Awareness Measuring Kpi Dashboard Brand Value Estimation Guide Formats PDF. The first reason is you can not spend time making everything from scratch, Thus, Slidegeeks has made presentation templates for you too. You can easily download these templates from our website easily.

Procedure Land Estimation Examination Conclusion Related To The Real Estate Valuation Diagrams PDF
This slide shows the conclusion details related to the real estate valuation such as fulfillment of the requirement of the instructions, methodology, criteria outlined, etc. Deliver an awe-inspiring pitch with this creative procedure land estimation examination conclusion related to the real estate valuation diagrams pdf bundle. Topics like requirement, instructions, methodology, criteria outlined can be discussed with this completely editable template. It is available for immediate download depending on the needs and requirements of the user.
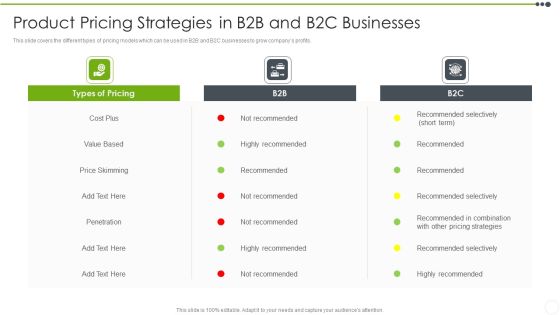
Estimating The Price Product Pricing Strategies In B2b And B2c Businesses Diagrams PDF
This slide covers the different types of pricing models which can be used in B2B and B2C businesses to grow companys profits. Deliver an awe inspiring pitch with this creative Estimating The Price Product Pricing Strategies In B2b And B2c Businesses Diagrams PDF bundle. Topics like Price, Cost, Strategies can be discussed with this completely editable template. It is available for immediate download depending on the needs and requirements of the user.

Circular Diagram Guide To Develop And Estimate Brand Value Pictures PDF
Slidegeeks is one of the best resources for PowerPoint templates. You can download easily and regulate Circular Diagram Guide To Develop And Estimate Brand Value Pictures PDF for your personal presentations from our wonderful collection. A few clicks is all it takes to discover and get the most relevant and appropriate templates. Use our Templates to add a unique zing and appeal to your presentation and meetings. All the slides are easy to edit and you can use them even for advertisement purposes.

Planning And Predicting Of Logistics Management Ppt PowerPoint Presentation Complete Deck With Slides
This complete deck acts as a great communication tool. It helps you in conveying your business message with personalized sets of graphics, icons etc. Comprising a set of sixty five slides, this complete deck can help you persuade your audience. It also induces strategic thinking as it has been thoroughly researched and put together by our experts. Not only is it easily downloadable but also editable. The color, graphics, theme any component can be altered to fit your individual needs. So grab it now.
Guide To Develop And Estimate Brand Value Brand Equity Analysis Using Interbrand Valuation Method Icons PDF
This slide displays information about interbrand valuation method which can be used by organizations to analyze brand equity. It also shows flow diagram of valuation method along with sample interbrand valuation.Slidegeeks is here to make your presentations a breeze with Guide To Develop And Estimate Brand Value Brand Equity Analysis Using Interbrand Valuation Method Icons PDF With our easy-to-use and customizable templates, you can focus on delivering your ideas rather than worrying about formatting. With a variety of designs to choose from, you are sure to find one that suits your needs. And with animations and unique photos, illustrations, and fonts, you can make your presentation pop. So whether you are giving a sales pitch or presenting to the board, make sure to check out Slidegeeks first.
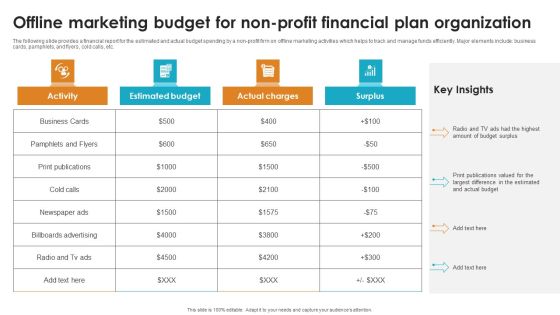
Offline Marketing Budget For Non Profit Financial Plan Organization Diagrams PDF
The following slide provides a financial report for the estimated and actual budget spending by a non profit firm on offline marketing activities which helps to track and manage funds efficiently. Major elements include business cards, pamphlets, and flyers, cold calls, etc.Showcasing this set of slides titled Offline Marketing Budget For Non Profit Financial Plan Organization Diagrams PDF. The topics addressed in these templates are unique. All the content presented in this PPT design is completely editable. Download it and make adjustments in color, background, font etc. as per your business setting.

CYBER Security Breache Response Strategy Budget Allocation For Cyber Incident Management Training Topics PDF
This slide represents the budget prepared to predict cash flows and allocate required resources for incident management training. It includes training budget of IT, HR, operations, and finance department etc. Create an editable CYBER Security Breache Response Strategy Budget Allocation For Cyber Incident Management Training Topics PDF that communicates your idea and engages your audience. Whether youre presenting a business or an educational presentation, pre designed presentation templates help save time. CYBER Security Breache Response Strategy Budget Allocation For Cyber Incident Management Training Topics PDF is highly customizable and very easy to edit, covering many different styles from creative to business presentations. Slidegeeks has creative team members who have crafted amazing templates. So, go and get them without any delay.
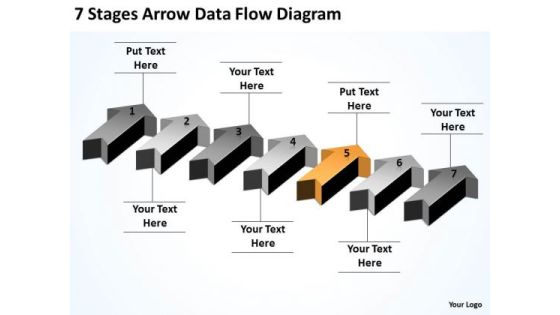
Example Of Parallel Processing 7 Stages Arrow Data Flow Diagram PowerPoint Slides
We present our example of parallel processing 7 stages arrow data flow diagram PowerPoint Slides.Download and present our Business PowerPoint Templates because Our PowerPoint Templates and Slides will let you Hit the target. Go the full distance with ease and elan. Download our Arrows PowerPoint Templates because You can Be the star of the show with our PowerPoint Templates and Slides. Rock the stage with your ideas. Use our Shapes PowerPoint Templates because It can Conjure up grand ideas with our magical PowerPoint Templates and Slides. Leave everyone awestruck by the end of your presentation. Present our Success PowerPoint Templates because Your ideas provide food for thought. Our PowerPoint Templates and Slides will help you create a dish to tickle the most discerning palate. Download and present our Signs PowerPoint Templates because They will Put your wonderful verbal artistry on display. Our PowerPoint Templates and Slides will provide you the necessary glam and glitter.Use these PowerPoint slides for presentations relating to 3d, achievement, aim, arrows, business, career, chart, competition,development, direction, education, financial, forecast, forward, glossy, graph,group, growth, higher, icon, increase, investment, leader, leadership, moving,onwards, outlook, path, plan, prediction, price, profit, progress, property, race,sales, series, success, target, team, teamwork, turn, up, upwards, vector, win,winner. The prominent colors used in the PowerPoint template are Orange, Gray, Black. We assure you our example of parallel processing 7 stages arrow data flow diagram PowerPoint Slides are the best it can get when it comes to presenting. PowerPoint presentation experts tell us our chart PowerPoint templates and PPT Slides look good visually. The feedback we get is that our example of parallel processing 7 stages arrow data flow diagram PowerPoint Slides are visually appealing. We assure you our competition PowerPoint templates and PPT Slides are visually appealing. PowerPoint presentation experts tell us our example of parallel processing 7 stages arrow data flow diagram PowerPoint Slides help you meet deadlines which are an element of today's workplace. Just browse and pick the slides that appeal to your intuitive senses. We assure you our business PowerPoint templates and PPT Slides will save the presenter time.
Steadybudget Capital Raising Elevator Various Services Offered By Steadybudget Icons PDF
This slide focuses on various services offered by budget management software such as automatic synchronization of data, email alerts and prediction, consolidates clients account data, etc. This is a Steadybudget Capital Raising Elevator Various Services Offered By Steadybudget Icons PDF template with various stages. Focus and dispense information on four stages using this creative set, that comes with editable features. It contains large content boxes to add your information on topics like Saves Time Analysts, Spend Tracking Forecasting, Ensures PPC Analysts. You can also showcase facts, figures, and other relevant content using this PPT layout. Grab it now.

Estimated Market Size For The Product Target Ppt Visual Aids Deck PDF
This slide shows the Total Addressable Market total market demand for the product, Served Available Market actual audience that can be reached and the Target Market basis on which the growth and marketing strategies are formulated. Deliver and pitch your topic in the best possible manner with this estimated market size for the product target ppt visual aids deck pdf. Use them to share invaluable insights on total available market, serviceable available market, target market and impress your audience. This template can be altered and modified as per your expectations. So, grab it now.
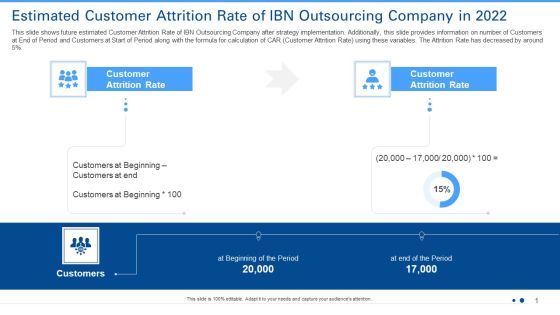
Estimated Customer Attrition Rate Of IBN Outsourcing Company In 2022 Ppt Outline Portfolio PDF
This slide shows a graph of declining Revenue of IBN Outsourcing Company for past 5 years 2017 to 2021. Additionally, this slide provides key reasons for the decline High Customer Attrition Rate, Outdated Software Technology, Low Quality and Delayed Customer Service etc.Deliver an awe-inspiring pitch with this creative estimated customer attrition rate of ibn outsourcing company in 2022 ppt outline portfolio pdf. bundle. Topics like beginning of the period, customer attrition rate can be discussed with this completely editable template. It is available for immediate download depending on the needs and requirements of the user.

Estimated User Statistics After Using Social Media Marketing Strategies Ppt Portfolio Visuals PDF
This slide shows user statistics related to retention and churn rate before the implementation of Social Media Marketing Strategies such as Facebook, Twitter, Instagram etc.. This data is for 3 months. Deliver and pitch your topic in the best possible manner with this estimated user statistics after using social media marketing strategies ppt portfolio visuals pdf. Use them to share invaluable insights on social media, advertising, customer, average and impress your audience. This template can be altered and modified as per your expectations. So, grab it now.

Future Estimated Patient Satisfaction Status At The Medical Facility Sample PDF
This slide shows the future Patient Satisfaction Status at the medical facility. This slide shows the percentage of patients that are satisfied and percentage that are dissatisfied at a medical facility after implementing patient satisfaction strategies.Deliver and pitch your topic in the best possible manner with this future estimated patient satisfaction status at the medical facility sample pdf. Use them to share invaluable insights on personalizing the patient, improve calling experience, simplifying billing processes and impress your audience. This template can be altered and modified as per your expectations. So, grab it now.

Patient Retention Approaches For Improving Brand Loyalty Future Estimated Patient Information PDF
This slide shows the future Patient Satisfaction Status at the medical facility. This slide shows the percentage of patients that are satisfied and percentage that are dissatisfied at a medical facility after implementing patient satisfaction strategies Deliver and pitch your topic in the best possible manner with this patient retention approaches for improving brand loyalty future estimated patient information pdf Use them to share invaluable insights on processes personalizing, experience simplifying, patient satisfaction and impress your audience. This template can be altered and modified as per your expectations. So, grab it now.

Consumer Retention Techniques Future Estimated Patient Satisfaction Status At The Medical Introduction PDF
This slide shows the future Patient Satisfaction Status at the medical facility. This slide shows the percentage of patients that are satisfied and percentage that are dissatisfied at a medical facility after implementing patient satisfaction strategies. Deliver and pitch your topic in the best possible manner with this consumer retention techniques future estimated patient satisfaction status at the medical introduction pdf. Use them to share invaluable insights on patient satisfaction rate, patient satisfaction strategies, patient experience and impress your audience. This template can be altered and modified as per your expectations. So, grab it now.

Brand Health Definition And Metrics To Track Brand Value Estimation Guide Mockup PDF
Following slide provides an overview about brand equity by covering its definition and key components such as brand loyalty, awareness, quality, association and experience.Present like a pro with Brand Health Definition And Metrics To Track Brand Value Estimation Guide Mockup PDF Create beautiful presentations together with your team, using our easy-to-use presentation slides. Share your ideas in real-time and make changes on the fly by downloading our templates. So whether you are in the office, on the go, or in a remote location, you can stay in sync with your team and present your ideas with confidence. With Slidegeeks presentation got a whole lot easier. Grab these presentations today.
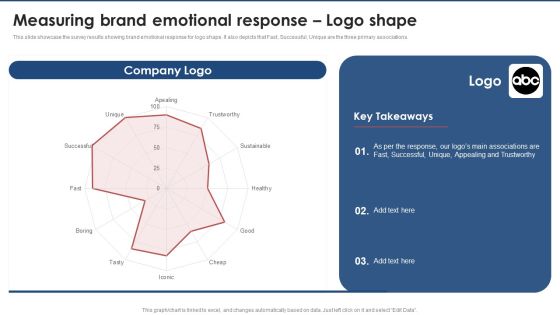
Measuring Brand Emotional Response Logo Shape Brand Value Estimation Guide Sample PDF
This slide showcase the survey results showing brand emotional response for logo shape. It also depicts that Fast, Successful, Unique are the three primary associations. The Measuring Brand Emotional Response Logo Shape Brand Value Estimation Guide Sample PDF is a compilation of the most recent design trends as a series of slides. It is suitable for any subject or industry presentation, containing attractive visuals and photo spots for businesses to clearly express their messages. This template contains a variety of slides for the user to input data, such as structures to contrast two elements, bullet points, and slides for written information. Slidegeeks is prepared to create an impression.

Guide To Develop And Estimate Brand Value Brand Awareness Measuring Kpi Dashboard Infographics PDF
Following slide illustrates KPI dashboard that can be used to track the awareness level of a specific brand. KPIs covered in the slide are traffic, attention, authority, inbound channel performance etc.From laying roadmaps to briefing everything in detail, our templates are perfect for you. You can set the stage with your presentation slides. All you have to do is download these easy-to-edit and customizable templates. Guide To Develop And Estimate Brand Value Brand Awareness Measuring Kpi Dashboard Infographics PDF will help you deliver an outstanding performance that everyone would remember and praise you for. Do download this presentation today.

Retail Store Inventory Safety Stock Assessment Retail Outlet Operations Performance Evaluation Graphics PDF
This slide shows the current performance of inventory operations providing information regarding customer and predicted demand, excess and deficit values, desired and actual safety stocks in days along with the forecast accuracy.Deliver and pitch your topic in the best possible manner with this Retail Store Inventory Safety Stock Assessment Retail Outlet Operations Performance Evaluation Graphics PDF. Use them to share invaluable insights on Predicted Demand, Customer Demand, Beginning and impress your audience. This template can be altered and modified as per your expectations. So, grab it now.

Budget Plan For Strategic Change Management Ppt PowerPoint Presentation Diagram Images PDF
This slide represents the budget prepared to predict cash flows and allocate required resources for implementing strategic changes in the organization. It includes activities such as staff cost, external trainers cost etc. Do you have to make sure that everyone on your team knows about any specific topic I yes, then you should give Budget Plan For Strategic Change Management Ppt PowerPoint Presentation Diagram Images PDF a try. Our experts have put a lot of knowledge and effort into creating this impeccable Budget Plan For Strategic Change Management Ppt PowerPoint Presentation Diagram Images PDF. You can use this template for your upcoming presentations, as the slides are perfect to represent even the tiniest detail. You can download these templates from the Slidegeeks website and these are easy to edit. So grab these today.

Procedure Land Estimation Examination Property Interests And Opinion To Be Valued Diagrams PDF
This slide shows the property details interests and opinion related to the clients property. The slide covers the detail on Interest to be valued and opinion of value. This is a procedure land estimation examination property interests and opinion to be valued diagrams pdf template with various stages. Focus and dispense information on four stages using this creative set, that comes with editable features. It contains large content boxes to add your information on topics like property interests and opinion to be valued. You can also showcase facts, figures, and other relevant content using this PPT layout. Grab it now.

Guide To Develop And Estimate Brand Value Sample Economic Value Added Valuation Method Diagrams PDF
Following slide portrays the example of economic value added EVA valuation method. Businesses can use this method for their asset valuation.Make sure to capture your audiences attention in your business displays with our gratis customizable Guide To Develop And Estimate Brand Value Sample Economic Value Added Valuation Method Diagrams PDF. These are great for business strategies, office conferences, capital raising or task suggestions. If you desire to acquire more customers for your tech business and ensure they stay satisfied, create your own sales presentation with these plain slides.

Table Of Contents Estimating Business Overall Health With Financial Planning And Assessment Diagrams PDF
This Table Of Contents Estimating Business Overall Health With Financial Planning And Assessment Diagrams PDF from Slidegeeks makes it easy to present information on your topic with precision. It provides customization options, so you can make changes to the colors, design, graphics, or any other component to create a unique layout. It is also available for immediate download, so you can begin using it right away. Slidegeeks has done good research to ensure that you have everything you need to make your presentation stand out. Make a name out there for a brilliant performance.

User Retention Rate Enhancement In Electronic Commerce Case Competition Table Of Content Elements PDF
Deliver and pitch your topic in the best possible manner with this user retention rate enhancement in electronic commerce case competition table of content elements pdf. Use them to share invaluable insights on cnn e commerce company swot analysis, cost estimation for strategy implementation and impress your audience. This template can be altered and modified as per your expectations. So, grab it now.

Tactics To Develop People Engagement In Organization Choosing The Right Training Program For Enhancing People Engagement Graphics PDF
Deliver and pitch your topic in the best possible manner with this tactics to develop people engagement in organization choosing the right training program for enhancing people engagement graphics pdf. Use them to share invaluable insights on training programs, program efficiency, estimated implementation costs and impress your audience. This template can be altered and modified as per your expectations. So, grab it now.
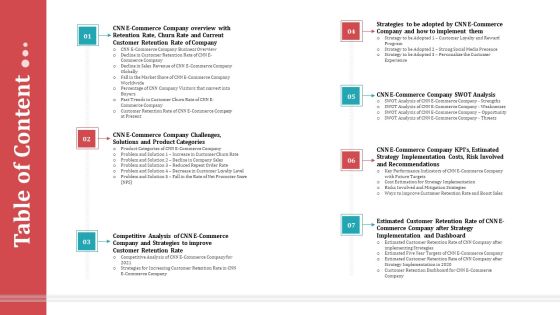
Strategies To Increase Consumer Retention Rate Electronic Commerce Table Of Content Topics PDF
Deliver and pitch your topic in the best possible manner with this strategies to increase consumer retention rate electronic commerce table of content topics pdf. Use them to share invaluable insights on problem and solution, product categories, cost estimation for strategy implementation and impress your audience. This template can be altered and modified as per your expectations. So, grab it now.

Data Maturity Framework With Predictive Operational Excellence Ppt PowerPoint Presentation Gallery Pictures PDF
Presenting data maturity framework with predictive operational excellence ppt powerpoint presentation gallery pictures pdf to dispense important information. This template comprises five stages. It also presents valuable insights into the topics including producing, improving, learning. This is a completely customizable PowerPoint theme that can be put to use immediately. So, download it and address the topic impactfully.
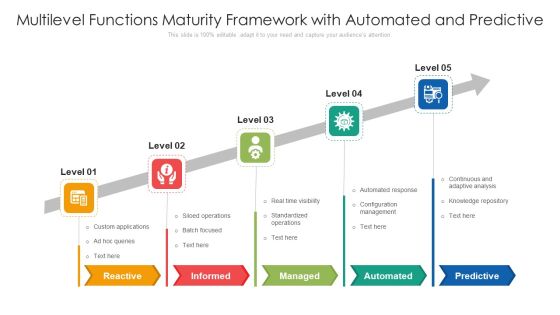
Multilevel Functions Maturity Framework With Automated And Predictive Ppt PowerPoint Presentation File Samples PDF
Presenting multilevel functions maturity framework with automated and predictive ppt powerpoint presentation file samples pdf to dispense important information. This template comprises five stages. It also presents valuable insights into the topics including reactive, informed, managed. This is a completely customizable PowerPoint theme that can be put to use immediately. So, download it and address the topic impactfully.
Cost Variance Cv Planned Budget Vs Actual Budget Ppt PowerPoint Presentation Icon Ideas
This is a cost variance cv planned budget vs actual budget ppt powerpoint presentation icon ideas. This is a five stage process. The stages in this process are cost variance, planned budget, actual budget, indirect labor, plant and infrastructure.

Performing Brand Performance Test Using Distinctive Asset Grid Brand Value Estimation Guide Microsoft PDF
Mentioned slide showcases distinctive asset grid that can be used to measure the brand performance. Here the logo performance is measured based on two elements namely fame and uniqueness. Presenting this PowerPoint presentation, titled Performing Brand Performance Test Using Distinctive Asset Grid Brand Value Estimation Guide Microsoft PDF, with topics curated by our researchers after extensive research. This editable presentation is available for immediate download and provides attractive features when used. Download now and captivate your audience. Presenting this Performing Brand Performance Test Using Distinctive Asset Grid Brand Value Estimation Guide Microsoft PDF. Our researchers have carefully researched and created these slides with all aspects taken into consideration. This is a completely customizable Performing Brand Performance Test Using Distinctive Asset Grid Brand Value Estimation Guide Microsoft PDF that is available for immediate downloading. Download now and make an impact on your audience. Highlight the attractive features available with our PPTs.

Sample Business Asset Valuation Dashboard Guide To Asset Cost Estimation Professional PDF
Following slide displays KPI dashboard for business asset valuation. KPIs covered are number of assets across production line, expected development cost and productivity index.Are you in need of a template that can accommodate all of your creative concepts This one is crafted professionally and can be altered to fit any style. Use it with Google Slides or PowerPoint. Include striking photographs, symbols, depictions, and other visuals. Fill, move around, or remove text boxes as desired. Test out color palettes and font mixtures. Edit and save your work, or work with colleagues. Download Sample Business Asset Valuation Dashboard Guide To Asset Cost Estimation Professional PDF and observe how to make your presentation outstanding. Give an impeccable presentation to your group and make your presentation unforgettable.

Financial Kpi Dashboard To Measure Brand Performance Brand Value Estimation Guide Inspiration PDF
Mentioned slide showcases KPI dashboard that can be used to check the financial performance of a brand. Metrics covered in the dashboard are return on assets, working capital ratio, return on equity etc.Are you in need of a template that can accommodate all of your creative concepts This one is crafted professionally and can be altered to fit any style. Use it with Google Slides or PowerPoint. Include striking photographs, symbols, depictions, and other visuals. Fill, move around, or remove text boxes as desired. Test out color palettes and font mixtures. Edit and save your work, or work with colleagues. Download Financial Kpi Dashboard To Measure Brand Performance Brand Value Estimation Guide Inspiration PDF and observe how to make your presentation outstanding. Give an impeccable presentation to your group and make your presentation unforgettable.

Guide To Develop And Estimate Brand Value Financial KPI Dashboard To Measure Brand Performance Formats PDF
Mentioned slide showcases KPI dashboard that can be used to check the financial performance of a brand. Metrics covered in the dashboard are return on assets, working capital ratio, return on equity etc.Coming up with a presentation necessitates that the majority of the effort goes into the content and the message you intend to convey. The visuals of a PowerPoint presentation can only be effective if it supplements and supports the story that is being told. Keeping this in mind our experts created Guide To Develop And Estimate Brand Value Financial KPI Dashboard To Measure Brand Performance Formats PDF to reduce the time that goes into designing the presentation. This way, you can concentrate on the message while our designers take care of providing you with the right template for the situation.

Estimating Business Overall Activity Ratios To Determine Organization Efficiency In Utilizing Topics PDF
The following slide outlines efficiency ratios which can be used to indicate the company efficiency in utilizing the assets. Information covered in this slide is related to inventory and total assets turnover ratio. Are you in need of a template that can accommodate all of your creative concepts This one is crafted professionally and can be altered to fit any style. Use it with Google Slides or PowerPoint. Include striking photographs, symbols, depictions, and other visuals. Fill, move around, or remove text boxes as desired. Test out color palettes and font mixtures. Edit and save your work, or work with colleagues. Download Estimating Business Overall Activity Ratios To Determine Organization Efficiency In Utilizing Topics PDF and observe how to make your presentation outstanding. Give an impeccable presentation to your group and make your presentation unforgettable.
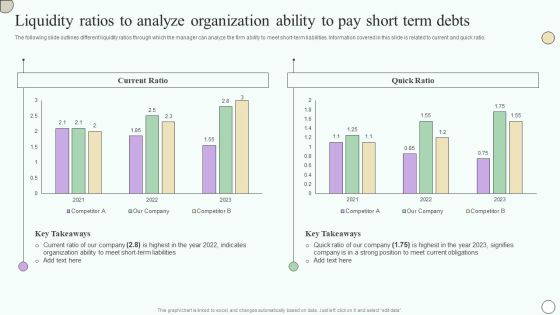
Estimating Business Overall Liquidity Ratios To Analyze Organization Ability To Pay Short Introduction PDF
The following slide outlines different liquidity ratios through which the manager can analyze the firm ability to meet short-term liabilities. Information covered in this slide is related to current and quick ratio. Coming up with a presentation necessitates that the majority of the effort goes into the content and the message you intend to convey. The visuals of a PowerPoint presentation can only be effective if it supplements and supports the story that is being told. Keeping this in mind our experts created Estimating Business Overall Liquidity Ratios To Analyze Organization Ability To Pay Short Introduction PDF to reduce the time that goes into designing the presentation. This way, you can concentrate on the message while our designers take care of providing you with the right template for the situation.
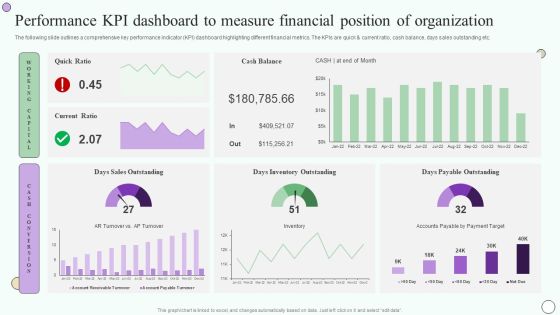
Estimating Business Overall Performance Kpi Dashboard To Measure Financial Position Inspiration PDF
The following slide outlines a comprehensive key performance indicator KPI dashboard highlighting different financial metrics. The KPIs are quick and current ratio, cash balance, days sales outstanding etc. Welcome to our selection of the Estimating Business Overall Performance Kpi Dashboard To Measure Financial Position Inspiration PDF. These are designed to help you showcase your creativity and bring your sphere to life. Planning and Innovation are essential for any business that is just starting out. This collection contains the designs that you need for your everyday presentations. All of our PowerPoints are 100 percent editable, so you can customize them to suit your needs. This multi-purpose template can be used in various situations. Grab these presentation templates today.

Improving Business Procedures Enterprise Resource Planning System Estimating Cost Savings From Cloud Formats PDF
The following slide showcases the cost savings derived from cloud usage as per industry specialists to evaluate return on investment ROI. It mainly includes percentage of cost benefits and respondents along with key insights etc. Coming up with a presentation necessitates that the majority of the effort goes into the content and the message you intend to convey. The visuals of a PowerPoint presentation can only be effective if it supplements and supports the story that is being told. Keeping this in mind our experts created Improving Business Procedures Enterprise Resource Planning System Estimating Cost Savings From Cloud Formats PDF to reduce the time that goes into designing the presentation. This way, you can concentrate on the message while our designers take care of providing you with the right template for the situation.
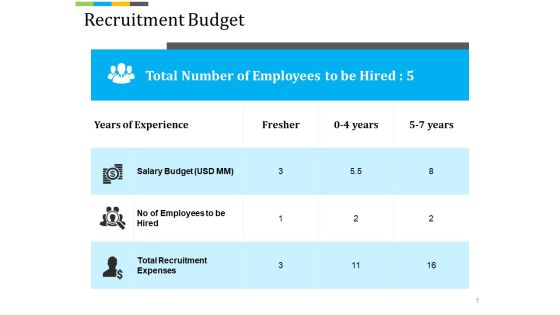
Recruitment Budget Ppt PowerPoint Presentation Visual Aids Diagrams
This is a recruitment budget ppt powerpoint presentation visual aids diagrams. This is a three stage process. The stages in this process are years of experience, fresher, salary budget, total recruitment.

Company Budget Restructure With Personnel And Contractual Costs Diagrams PDF
This slide displays the budget for the company who is dealing on the contractual basis with the approved budget , the adjustments that are requested and the final budget after all the revisions done. Showcasing this set of slides titled Company Budget Restructure With Personnel And Contractual Costs Diagrams PDF. The topics addressed in these templates are Budget Category, Approved Budget, Revised Budgets. All the content presented in this PPT design is completely editable. Download it and make adjustments in color, background, font etc. as per your unique business setting.
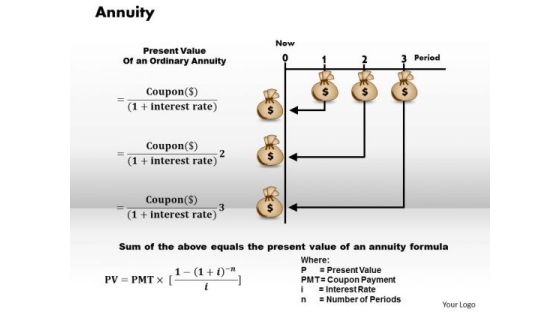
Business Framework Annuity PowerPoint Presentation
This diagram displays calculations of annuity. Use this annuity diagram in business and finance related topic. Annuity is return on investment fund.
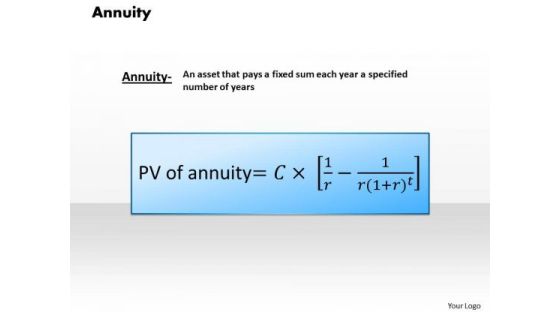
Business Framework Annuity PowerPoint Presentation 2
Thia diagram displays calculations of annuity. Use this annuity diagram in business and finance related topic. Annuity is return on investment fund.
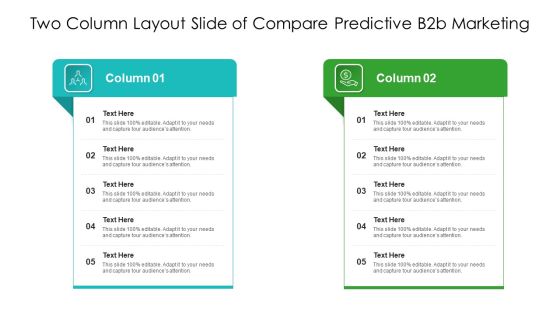
Two Column Layout Slide Of Compare Predictive B2b Marketing Ppt PowerPoint Presentation Slides Design Inspiration PDF
Presenting two column layout slide of compare predictive b2b marketing ppt powerpoint presentation slides design inspiration pdf to dispense important information. This template comprises two stages. It also presents valuable insights into the topics including two column layout slide of compare predictive b2b marketing. This is a completely customizable PowerPoint theme that can be put to use immediately. So, download it and address the topic impactfully.
Market Dynamics Ppt PowerPoint Presentation Icon Slideshow
This is a market dynamics ppt powerpoint presentation icon slideshow. This is a five stage process. The stages in this process are competitive landscape, market dynamics, market opportunity description, economic outlook, contingency plan.

Business Arrows PowerPoint Templates Marketing Wealth Planning Process Ppt Slides
Business Arrows PowerPoint Templates Marketing Wealth Planning Process PPT Slides-This PowerPoint slide has multicolor arrows that serve to show growth or progress-Business Arrows PowerPoint Templates Marketing Wealth Planning Process PPT Slides-This template can be used for presentations relating to Accounting, Amount, Arrow, Bank, Bar, Benefit, Business, Calculate, Calculation, Capitalist, Cash, Chart, Communication, Company, Concern, Connection, Corporate, Data, Diagram, Digital, Drawing, Earnings, Economic, Economy, Enterprise, Figures, Finance, Financial, Flow, Forecast, Gain, Goal, Graph, Growth, Illustration, Increase, Information, Interest, Investing, Investment, Investor, Management, Market, Money, Move, Network, Objective, Plan
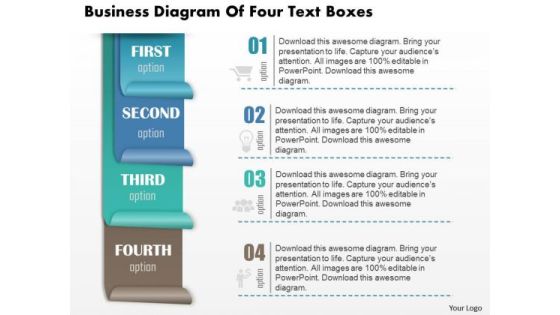
Business Diagram Of Four Text Boxes Presentation Slide Template
This business diagram power point slide has been crafted with four text boxes. Explain business data and calculation with this innovative diagram slide. Use this diagram slide for business and marketing presentations.
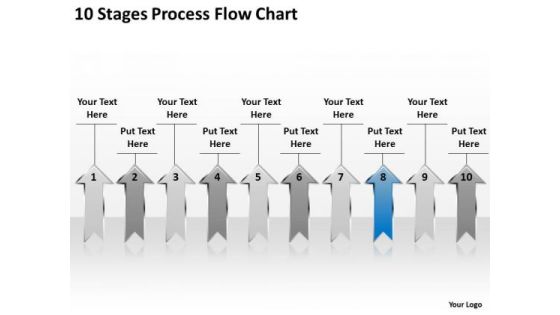
Example Of Parallel Processing 10 Stages Flow Chart PowerPoint Templates
We present our example of parallel processing 10 stages flow chart PowerPoint templates.Use our Business PowerPoint Templates because It can Conjure up grand ideas with our magical PowerPoint Templates and Slides. Leave everyone awestruck by the end of your presentation. Use our Arrows PowerPoint Templates because Our PowerPoint Templates and Slides will let you Hit the right notes. Watch your audience start singing to your tune. Download and present our Shapes PowerPoint Templates because You can Stir your ideas in the cauldron of our PowerPoint Templates and Slides. Cast a magic spell on your audience. Download and present our Success PowerPoint Templates because You can Create a matrix with our PowerPoint Templates and Slides. Feel the strength of your ideas click into place. Use our Signs PowerPoint Templates because Our PowerPoint Templates and Slides are the chords of your song. String them along and provide the lilt to your views.Use these PowerPoint slides for presentations relating to 3d, achievement, aim, arrows, business, career, chart, competition,development, direction, education, financial, forecast, forward, glossy, graph,group, growth, higher, icon, increase, investment, leader, leadership, moving,onwards, outlook, path, plan, prediction, price, profit, progress, property, race,sales, series, success, target, team, teamwork, turn, up, upwards, vector, win,winner. The prominent colors used in the PowerPoint template are Blue, Gray, White. We assure you our example of parallel processing 10 stages flow chart PowerPoint templates are the best it can get when it comes to presenting. PowerPoint presentation experts tell us our aim PowerPoint templates and PPT Slides look good visually. The feedback we get is that our example of parallel processing 10 stages flow chart PowerPoint templates will make the presenter look like a pro even if they are not computer savvy. We assure you our career PowerPoint templates and PPT Slides are designed by professionals PowerPoint presentation experts tell us our example of parallel processing 10 stages flow chart PowerPoint templates effectively help you save your valuable time. We assure you our competition PowerPoint templates and PPT Slides are specially created by a professional team with vast experience. They diligently strive to come up with the right vehicle for your brilliant Ideas.

Operational Innovation In Banking Estimated Market Share And Ranking Of Bank Products Diagrams PDF
This slide highlights the bank products and services market share which includes savings accounts, debit cards, mobile banking, credit cards, point of terminals and forex cards. Slidegeeks is here to make your presentations a breeze with Operational Innovation In Banking Estimated Market Share And Ranking Of Bank Products Diagrams PDF With our easy-to-use and customizable templates, you can focus on delivering your ideas rather than worrying about formatting. With a variety of designs to choose from, youre sure to find one that suits your needs. And with animations and unique photos, illustrations, and fonts, you can make your presentation pop. So whether youre giving a sales pitch or presenting to the board, make sure to check out Slidegeeks first.

Nielsen Business Profile Financial Performance Estimation Fy22 Ppt PowerPoint Presentation File Diagrams PDF
This slide highlights the Nielsen financial performance guidance which includes the EBITDA, free cash flow, organic CC growth, interest expense, tax rate, depreciation and amortization, and average diluted shares. Coming up with a presentation necessitates that the majority of the effort goes into the content and the message you intend to convey. The visuals of a PowerPoint presentation can only be effective if it supplements and supports the story that is being told. Keeping this in mind our experts created Nielsen Business Profile Financial Performance Estimation Fy22 Ppt PowerPoint Presentation File Diagrams PDF to reduce the time that goes into designing the presentation. This way, you can concentrate on the message while our designers take care of providing you with the right template for the situation.

Using Ai For Predictive Maintenance Of Manufacturing Process Deployment Ideas PDF
Retrieve professionally designed Using Ai For Predictive Maintenance Of Manufacturing Process Deployment Ideas PDF to effectively convey your message and captivate your listeners. Save time by selecting pre-made slideshows that are appropriate for various topics, from business to educational purposes. These themes come in many different styles, from creative to corporate, and all of them are easily adjustable and can be edited quickly. Access them as PowerPoint templates or as Google Slides themes. You do not have to go on a hunt for the perfect presentation because Slidegeeks got you covered from everywhere.

Dashboards Related To The Zoo Financials And Operations Diagrams PDF
This slide shows the dashboard or KPI related to the ABC Zoo which includes the forecasted revenue, competitors details, visitors attractions, capital expenditure and many kore. Deliver and pitch your topic in the best possible manner with this dashboards related to the zoo financials and operations diagrams pdf. Use them to share invaluable insights on capital expenditure, revenue and impress your audience. This template can be altered and modified as per your expectations. So, grab it now.
Monthly Business Budget Report Summary For Software Firm Icons PDF
The following slide highlights the monthly business budget report for software firm. It depicts budget for month and upcoming expenses with key sub headings which includes particulars, quantity, monthly expenses, monthly budget and budget performance. Presenting Monthly Business Budget Report Summary For Software Firm Icons PDF to dispense important information. This template comprises one stage. It also presents valuable insights into the topics including Upcoming Expenses, Budget Performance, Quantity This is a completely customizable PowerPoint theme that can be put to use immediately. So, download it and address the topic impactfully.
IOT Industry Assessment Global Market Revenues Opportunity By Segment Ppt Icon Summary PDF
Mentioned slide illustrates statistics of global IoT connections forecast and market revenue by 2025. It also shows region wise connections forecast and share of IoT revenue in platforms, services and connectivity by 2025. Deliver an awe inspiring pitch with this creative iot industry assessment global market revenues opportunity by segment ppt icon summary pdf bundle. Topics like global, revenue, market, connections, region can be discussed with this completely editable template. It is available for immediate download depending on the needs and requirements of the user.

Eco Friendly Technology And Sustainability Market Distribution By Application Icons PDF
The following slide showcases current and forecasted market distribution of green technology and sustainability industry revenue based on application. It includes elements such as green building, carbon footprint management, weather monitoring and forecasting, air and water pollution monitoring, forest monitoring, etc..Find a pre-designed and impeccable Eco Friendly Technology And Sustainability Market Distribution By Application Icons PDF. The templates can ace your presentation without additional effort. You can download these easy-to-edit presentation templates to make your presentation stand out from others. So, what are you waiting for Download the template from Slidegeeks today and give a unique touch to your presentation.
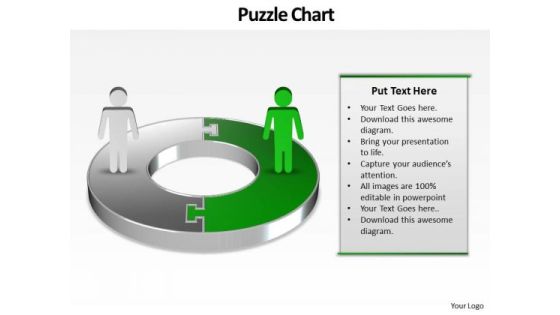
Ppt Green PowerPoint Slide Man On Circular Gantt Chart Template Templates
PPT green powerpoint slide man on circular gantt chart template Templates-This PowerPoint Diagram shows you the Circular way to represent Business components or losses in Business related Activities. This PowerPoint Diagram can be use in Investor presentations for Initial Public Offerings, Annual general meetings and financial seminars.-PPT green powerpoint slide man on circular gantt chart template Templates-abstract, accounting, background, business, businessman, chart, company, connection, corporate, diagram, earnings, finance, forecast, graph, growth, investment, management, network, people, profit, progress, puzzle, shapes, team, technology, vector, wealth

Management Techniques Scheduling Strategies In Construction Management Professional PDF
This slide shows the various scheduling strategies that can help in construction management and provide a structured approach to planning, problem identification, cash flow forecasting and resource requirements. The scheduling strategies in construction management are Gantt Charts, critical path scheduling, line of balance and Q-scheduling. Presenting Management Techniques Scheduling Strategies In Construction Management Professional PDF to provide visual cues and insights. Share and navigate important information on six stages that need your due attention. This template can be used to pitch topics like Gantt Chart, Critical Path Scheduling, Line Balance, Strategy. In addtion, this PPT design contains high resolution images, graphics, etc, that are easily editable and available for immediate download.
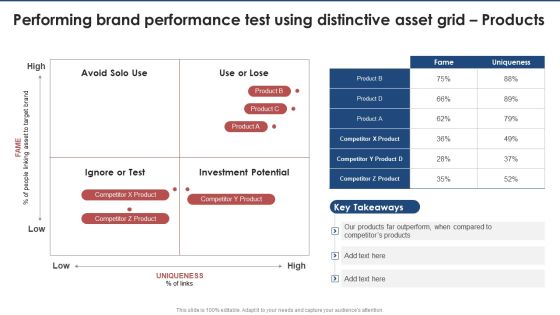
Performing Brand Performance Test Using Distinctive Asset Grid Products Brand Value Estimation Guide Portrait PDF
Here you can discover an assortment of the finest PowerPoint and Google Slides templates. With these templates, you can create presentations for a variety of purposes while simultaneously providing your audience with an eye-catching visual experience. Download Performing Brand Performance Test Using Distinctive Asset Grid Products Brand Value Estimation Guide Portrait PDF to deliver an impeccable presentation. These templates will make your job of preparing presentations much quicker, yet still, maintain a high level of quality. Slidegeeks has experienced researchers who prepare these templates and write high-quality content for you. Later on, you can personalize the content by editing the Performing Brand Performance Test Using Distinctive Asset Grid Products Brand Value Estimation Guide Portrait PDF.
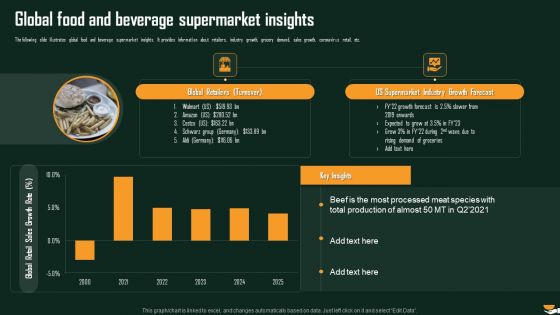
Global Food And Beverage Supermarket Insights International Food And Beverages Sector Analysis Themes PDF
The following slide illustrates global food and beverage supermarket insights. It provides information about retailers, industry growth, grocery demand, sales growth, coronavirus retail, etc. Deliver an awe inspiring pitch with this creative Global Food And Beverage Supermarket Insights International Food And Beverages Sector Analysis Themes PDF bundle. Topics like Supermarket Industry, Growth Forecast, Expected Grow can be discussed with this completely editable template. It is available for immediate download depending on the needs and requirements of the user.

Key Responsibilities Analysis For Treasury Risk Management Professional PDF
This slide lists downs various tasks performed by treasury department in organization to ensure risk administration and control. It includes information such as cash flow and budget forecasting, liabilities, etc. Presenting Key Responsibilities Analysis For Treasury Risk Management Professional PDF to dispense important information. This template comprises six stages. It also presents valuable insights into the topics including Liquidity Management, Operational Risk Management, Liabilities Management, Asset Management. This is a completely customizable PowerPoint theme that can be put to use immediately. So, download it and address the topic impactfully.
 Home
Home