Project Metrics
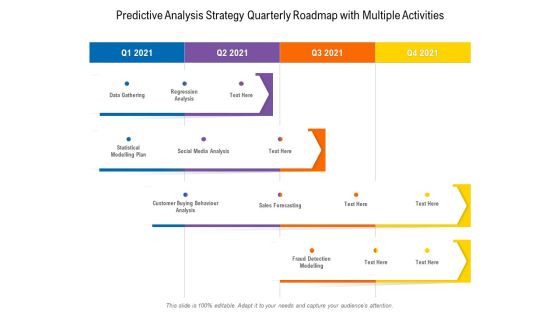
Predictive Analysis Strategy Quarterly Roadmap With Multiple Activities Clipart
Presenting our innovatively-structured predictive analysis strategy quarterly roadmap with multiple activities clipart Template. Showcase your roadmap process in different formats like PDF, PNG, and JPG by clicking the download button below. This PPT design is available in both Standard Screen and Widescreen aspect ratios. It can also be easily personalized and presented with modified font size, font type, color, and shapes to measure your progress in a clear way.

Predictive Analysis Strategy Six Months Roadmap For Business Success Rules
Introducing our predictive analysis strategy six months roadmap for business success rules. This PPT presentation is Google Slides compatible, therefore, you can share it easily with the collaborators for measuring the progress. Also, the presentation is available in both standard screen and widescreen aspect ratios. So edit the template design by modifying the font size, font type, color, and shapes as per your requirements. As this PPT design is fully editable it can be presented in PDF, JPG and PNG formats.

Predictive Analysis Strategy Three Months Roadmap With Multiple Activities Template
Presenting our innovatively-structured predictive analysis strategy three months roadmap with multiple activities template Template. Showcase your roadmap process in different formats like PDF, PNG, and JPG by clicking the download button below. This PPT design is available in both Standard Screen and Widescreen aspect ratios. It can also be easily personalized and presented with modified font size, font type, color, and shapes to measure your progress in a clear way.
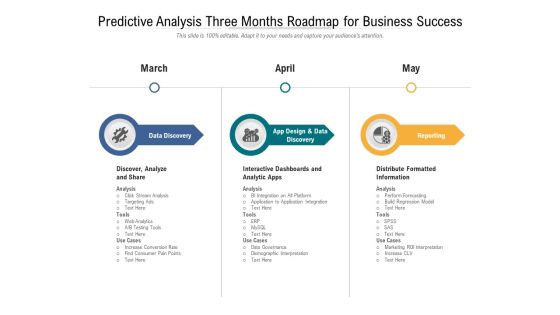
Predictive Analysis Three Months Roadmap For Business Success Infographics
Introducing our predictive analysis three months roadmap for business success infographics. This PPT presentation is Google Slides compatible, therefore, you can share it easily with the collaborators for measuring the progress. Also, the presentation is available in both standard screen and widescreen aspect ratios. So edit the template design by modifying the font size, font type, color, and shapes as per your requirements. As this PPT design is fully editable it can be presented in PDF, JPG and PNG formats.
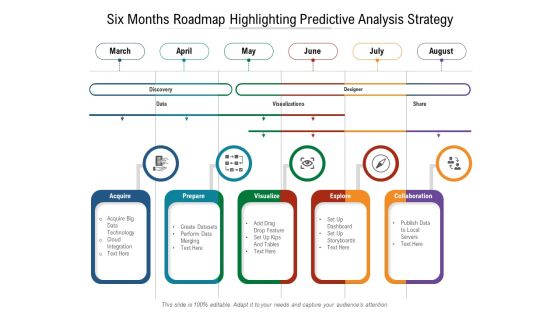
Six Months Roadmap Highlighting Predictive Analysis Strategy Brochure
Presenting our innovatively-structured six months roadmap highlighting predictive analysis strategy brochure Template. Showcase your roadmap process in different formats like PDF, PNG, and JPG by clicking the download button below. This PPT design is available in both Standard Screen and Widescreen aspect ratios. It can also be easily personalized and presented with modified font size, font type, color, and shapes to measure your progress in a clear way.
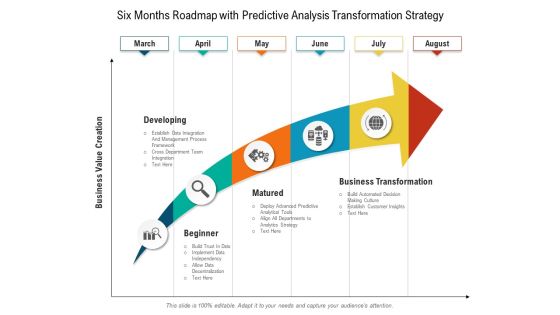
Six Months Roadmap With Predictive Analysis Transformation Strategy Summary
Introducing our six months roadmap with predictive analysis transformation strategy summary. This PPT presentation is Google Slides compatible, therefore, you can share it easily with the collaborators for measuring the progress. Also, the presentation is available in both standard screen and widescreen aspect ratios. So edit the template design by modifying the font size, font type, color, and shapes as per your requirements. As this PPT design is fully editable it can be presented in PDF, JPG and PNG formats.

Predictive Analytics Five Years Roadmap With Multiple Activities Ideas
Introducing our predictive analytics five years roadmap with multiple activities ideas. This PPT presentation is Google Slides compatible, therefore, you can share it easily with the collaborators for measuring the progress. Also, the presentation is available in both standard screen and widescreen aspect ratios. So edit the template design by modifying the font size, font type, color, and shapes as per your requirements. As this PPT design is fully editable it can be presented in PDF, JPG and PNG formats.

Predictive Analytics Half Yearly Roadmap With Multiple Activities Formats
Introducing our predictive analytics half yearly roadmap with multiple activities formats. This PPT presentation is Google Slides compatible, therefore, you can share it easily with the collaborators for measuring the progress. Also, the presentation is available in both standard screen and widescreen aspect ratios. So edit the template design by modifying the font size, font type, color, and shapes as per your requirements. As this PPT design is fully editable it can be presented in PDF, JPG and PNG formats.
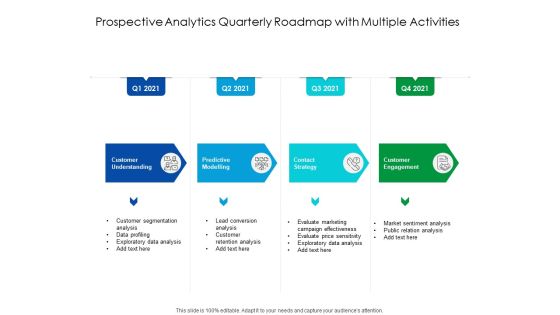
Predictive Analytics Quarterly Roadmap With Multiple Activities Ideas
Introducing our predictive analytics quarterly roadmap with multiple activities ideas. This PPT presentation is Google Slides compatible, therefore, you can share it easily with the collaborators for measuring the progress. Also, the presentation is available in both standard screen and widescreen aspect ratios. So edit the template design by modifying the font size, font type, color, and shapes as per your requirements. As this PPT design is fully editable it can be presented in PDF, JPG and PNG formats.

Predictive Analytics Six Months Roadmap With Multiple Activities Topics
Introducing our predictive analytics six months roadmap with multiple activities topics. This PPT presentation is Google Slides compatible, therefore, you can share it easily with the collaborators for measuring the progress. Also, the presentation is available in both standard screen and widescreen aspect ratios. So edit the template design by modifying the font size, font type, color, and shapes as per your requirements. As this PPT design is fully editable it can be presented in PDF, JPG and PNG formats.

Predictive Analytics Three Months Roadmap With Multiple Activities Elements
Introducing our predictive analytics three months roadmap with multiple activities elements. This PPT presentation is Google Slides compatible, therefore, you can share it easily with the collaborators for measuring the progress. Also, the presentation is available in both standard screen and widescreen aspect ratios. So edit the template design by modifying the font size, font type, color, and shapes as per your requirements. As this PPT design is fully editable it can be presented in PDF, JPG and PNG formats.
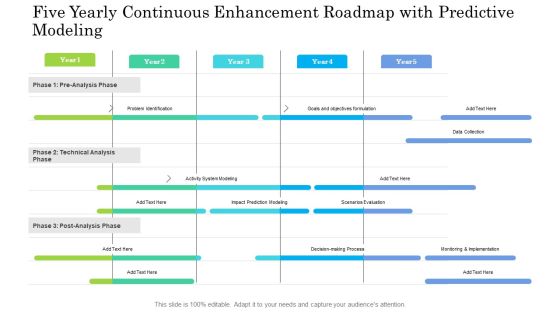
Five Yearly Continuous Enhancement Roadmap With Predictive Modeling Infographics
Presenting our innovatively structured five yearly continuous enhancement roadmap with predictive modeling infographics Template. Showcase your roadmap process in different formats like PDF, PNG, and JPG by clicking the download button below. This PPT design is available in both Standard Screen and Widescreen aspect ratios. It can also be easily personalized and presented with modified font size, font type, color, and shapes to measure your progress in a clear way.

Half Yearly Continuous Enhancement Roadmap With Predictive Modeling Mockup
Presenting our innovatively structured half yearly continuous enhancement roadmap with predictive modeling mockup Template. Showcase your roadmap process in different formats like PDF, PNG, and JPG by clicking the download button below. This PPT design is available in both Standard Screen and Widescreen aspect ratios. It can also be easily personalized and presented with modified font size, font type, color, and shapes to measure your progress in a clear way.

Quarterly Continuous Enhancement Roadmap With Predictive Modeling Ideas
Presenting our innovatively structured quarterly continuous enhancement roadmap with predictive modeling ideas Template. Showcase your roadmap process in different formats like PDF, PNG, and JPG by clicking the download button below. This PPT design is available in both Standard Screen and Widescreen aspect ratios. It can also be easily personalized and presented with modified font size, font type, color, and shapes to measure your progress in a clear way.
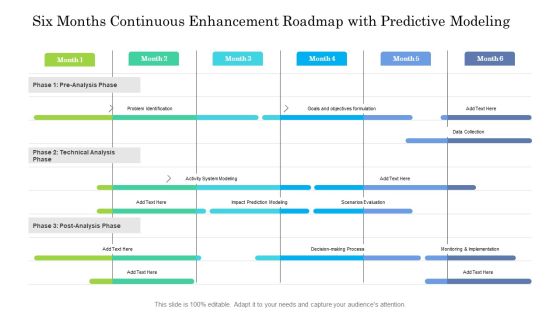
Six Months Continuous Enhancement Roadmap With Predictive Modeling Mockup
Presenting our innovatively structured six months continuous enhancement roadmap with predictive modeling mockup Template. Showcase your roadmap process in different formats like PDF, PNG, and JPG by clicking the download button below. This PPT design is available in both Standard Screen and Widescreen aspect ratios. It can also be easily personalized and presented with modified font size, font type, color, and shapes to measure your progress in a clear way.

Three Months Continuous Enhancement Roadmap With Predictive Modeling Graphics
Presenting our innovatively structured three months continuous enhancement roadmap with predictive modeling graphics Template. Showcase your roadmap process in different formats like PDF, PNG, and JPG by clicking the download button below. This PPT design is available in both Standard Screen and Widescreen aspect ratios. It can also be easily personalized and presented with modified font size, font type, color, and shapes to measure your progress in a clear way.
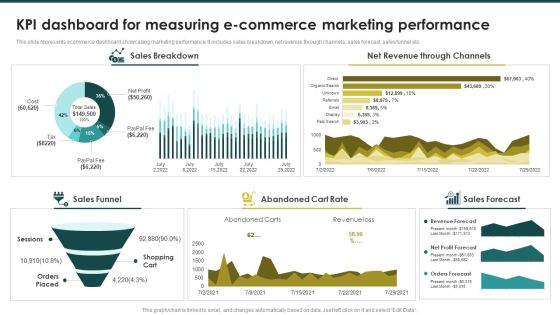
KPI Dashboard For Measuring Ecommerce Marketing Ecommerce Marketing Plan To Enhance Brochure PDF
This slide represents ecommerce dashboard showcasing marketing performance. It includes sales breakdown, net revenue through channels, sales forecast, sales funnel etc.Find highly impressive KPI Dashboard For Measuring Ecommerce Marketing Ecommerce Marketing Plan To Enhance Brochure PDF on Slidegeeks to deliver a meaningful presentation. You can save an ample amount of time using these presentation templates. No need to worry to prepare everything from scratch because Slidegeeks experts have already done a huge research and work for you. You need to download KPI Dashboard For Measuring Ecommerce Marketing Ecommerce Marketing Plan To Enhance Brochure PDF for your upcoming presentation. All the presentation templates are 100precent editable and you can change the color and personalize the content accordingly. Download now.
Eight Steps To Measure And Analyze Employee Productivity With Icons Ppt PowerPoint Presentation Gallery Vector PDF
Persuade your audience using this eight steps to measure and analyze employee productivity with icons ppt powerpoint presentation gallery vector pdf. This PPT design covers eight stages, thus making it a great tool to use. It also caters to a variety of topics including use employee satisfaction index, calculating employee net promoter score, conducting regular meetings. Download this PPT design now to present a convincing pitch that not only emphasizes the topic but also showcases your presentation skills.

Talent Acquisition Marketing Our Marketing Milestones And Calculating The Return On Lead Generation Inspiration PDF
This slide covers methods of lead generation such as website, advertising, print, TV, local radio, monthly bulletins, referrals, online pay per click etc. along with KPIs such as leads generation per year, average close rate, average selling price, avg. commission etc.Deliver an awe inspiring pitch with this creative Talent Acquisition Marketing Our Marketing Milestones And Calculating The Return On Lead Generation Inspiration PDF bundle. Topics like Advertising Broadcast, Lender Partnerships, Referrals Personal can be discussed with this completely editable template. It is available for immediate download depending on the needs and requirements of the user.

Our Marketing Milestones And Calculating The Return On Lead Generation Brochure PDF
This slide covers methods of lead generation such as website, advertising, print, TV, local radio, monthly bulletins, referrals, online pay per click etc. along with KPIs such as leads generation per year, average close rate, average selling price, avg. commission etc.Deliver an awe inspiring pitch with this creative Our Marketing Milestones And Calculating The Return On Lead Generation Brochure PDF bundle. Topics like Average Commission, Average Close, Average Selling can be discussed with this completely editable template. It is available for immediate download depending on the needs and requirements of the user.
Inbound Recruiting Methodology Our Marketing Milestones And Calculating The Return On Lead Generation Icons PDF
This slide covers methods of lead generation such as website, advertising, print, TV, local radio, monthly bulletins, referrals, online pay per click etc. along with KPIs such as leads generation per year, average close rate, average selling price, avg. commission etc. Deliver and pitch your topic in the best possible manner with this Inbound Recruiting Methodology Our Marketing Milestones And Calculating The Return On Lead Generation Icons PDF. Use them to share invaluable insights on Average Commission, Advertising, Resource and impress your audience. This template can be altered and modified as per your expectations. So, grab it now.

Our Marketing Milestones And Calculating The Return On Lead Generation Microsoft PDF
This slide covers methods of lead generation such as website, advertising, print, TV, local radio, monthly bulletins, referrals, online pay per click etc. along with KPIs such as leads generation per year, average close rate, average selling price, avg. commission etc.Deliver and pitch your topic in the best possible manner with this Our Marketing Milestones And Calculating The Return On Lead Generation Microsoft PDF. Use them to share invaluable insights on Generates Leads, Average Close, Average Selling and impress your audience. This template can be altered and modified as per your expectations. So, grab it now.

And Converging Circular Arrows Process Success Motion PowerPoint Templates
We present our and converging circular arrows process success Motion PowerPoint templates.Present our Arrow PowerPoint Templates because this diagram helps you to discuss each step slowly but surely move up the pyramid narrowing down to the best and most success oriented project. Use our Marketing PowerPoint Templates because this PPt slide helps you to measure key aspects of the current process and collect relevant data. Present our Process and Flows PowerPoint Templates because this is a good example of the strength of teamwork. Download and present our Ring Charts PowerPoint Templates because your quicksilver ideas are the arrows in your quiver. Use our Shapes PowerPoint Templates because you can Lead your flock steadily to greater heights. Look around at the vast potential of achievement around you.Use these PowerPoint slides for presentations relating to Arrow, chart, chromatic, circle,circular, circulation, collection, color,concept, connection, continuity, cursor,cycle, cyclic, diagram, direction, dynamic,element, flow, flowchart, graph, graphic,group, icon, loop, motion, movement,multicolored, paint, palette, pantone,process, progress, rainbow, recycle,recycling, repetition, ring, rotation, round,set, sign, six, spectrum, spin, symbol,. The prominent colors used in the PowerPoint template are Green, Black, White. You can be sure our and converging circular arrows process success Motion PowerPoint templates are Sparkling. Professionals tell us our collection PowerPoint templates and PPT Slides are Awesome. PowerPoint presentation experts tell us our and converging circular arrows process success Motion PowerPoint templates are Appealing. You can be sure our concept PowerPoint templates and PPT Slides are Elegant. You can be sure our and converging circular arrows process success Motion PowerPoint templates will make you look like a winner. The feedback we get is that our circular PowerPoint templates and PPT Slides are Excellent.

Analysis Of Retail Store Inventory Product Lines Holding Cost Retail Outlet Performance Assessment Ideas PDF
This slide indicates the inventory holding cost of multiple product lines providing details regarding revenue, cost of goods sold, gross profit, the average number of days inventory held, etc.Deliver an awe inspiring pitch with this creative Analysis Of Retail Store Inventory Product Lines Holding Cost Retail Outlet Performance Assessment Ideas PDF bundle. Topics like Cost Goods, Estimated Inventory, Inventory Held can be discussed with this completely editable template. It is available for immediate download depending on the needs and requirements of the user.

Budget Implementation Process Powerpoint Layout
This is a budget implementation process powerpoint layout. This is a four stage process. The stages in this process are budget exaction process, procurement process, audit and legislative oversight process, impact measurement process, budget implementation process.
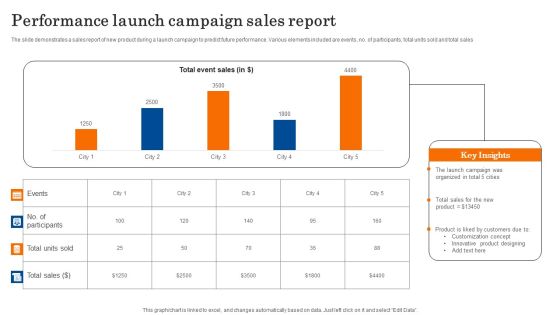
Performance Launch Campaign Sales Report Demonstration PDF
The slide demonstrates a sales report of new product during a launch campaign to predict future performance. Various elements included are events, no. of participants, total units sold and total sales. Pitch your topic with ease and precision using this Performance Launch Campaign Sales Report Demonstration PDF. This layout presents information on Sales, Product, Customization Concept. It is also available for immediate download and adjustment. So, changes can be made in the color, design, graphics or any other component to create a unique layout.

Agile Group For Product Development Parameters To Measure Impact Of Product Leadership Practices Pictures PDF
This slide shows parameters to measure impact of product leadership practices that focuses on product stickiness, net promoter score, feature adoption and retention, etc. Deliver an awe inspiring pitch with this creative agile group for product development parameters to measure impact of product leadership practices pictures pdf bundle. Topics like net promoter score, product delivery predictable, product usage can be discussed with this completely editable template. It is available for immediate download depending on the needs and requirements of the user.
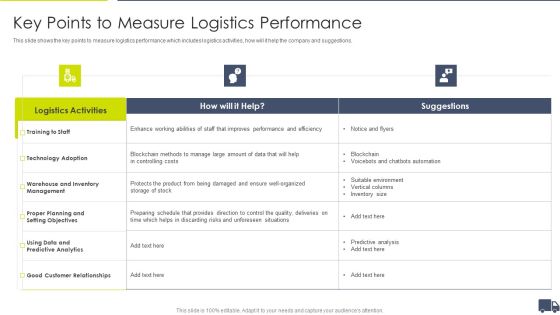
Enhancing Logistics Customer Service Key Points To Measure Logistics Performance Clipart PDF
This slide shows the key points to measure logistics performance which includes logistics activities, how will it help the company and suggestions. Deliver an awe inspiring pitch with this creative Enhancing Logistics Customer Service Key Points To Measure Logistics Performance Clipart PDF bundle. Topics like Logistics Activities Help, Technology Adoption Data, Predictive Analytics Data can be discussed with this completely editable template. It is available for immediate download depending on the needs and requirements of the user.
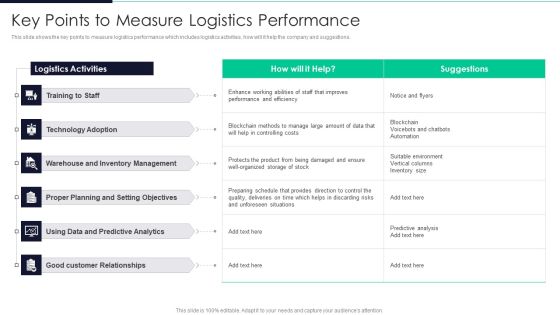
Developing Excellence In Logistics Operations Key Points To Measure Logistics Performance Demonstration PDF
This slide shows the key points to measure logistics performance which includes logistics activities, how will it help the company and suggestions.Deliver an awe inspiring pitch with this creative Developing Excellence In Logistics Operations Key Points To Measure Logistics Performance Demonstration PDF bundle. Topics like Technology Adoption, Inventory Management, Predictive Analytics can be discussed with this completely editable template. It is available for immediate download depending on the needs and requirements of the user.

Deploying AI To Enhance Predictive Maintenance Equipment Condition Summary PDF
This slide represents the predictive maintenance and equipment condition monitoring with the internet of things, including its working and impact on the industry. In this method, a sensor is mounted on the piece of equipment to gather information about its health and performance. This Deploying AI To Enhance Predictive Maintenance Equipment Condition Summary PDF is perfect for any presentation, be it in front of clients or colleagues. It is a versatile and stylish solution for organizing your meetings. The Deploying AI To Enhance Predictive Maintenance Equipment Condition Summary PDF features a modern design for your presentation meetings. The adjustable and customizable slides provide unlimited possibilities for acing up your presentation. Slidegeeks has done all the homework before launching the product for you. So, dont wait, grab the presentation templates today
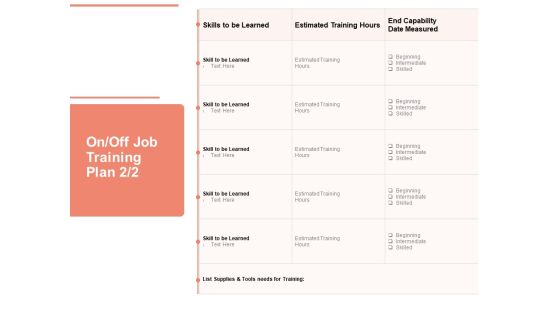
Workforce Planning System On Off Job Training Plan Measured Ppt PowerPoint Presentation Infographics Gridlines PDF
Deliver an awe-inspiring pitch with this creative workforce planning system on off job training plan measured ppt powerpoint presentation infographics gridlines pdf bundle. Topics like skills estimated, training hour learned, end capability, date measured, beginning intermediate skilled can be discussed with this completely editable template. It is available for immediate download depending on the needs and requirements of the user.

Three Step Process To Measure Organizational Business Operational Expenditure Microsoft PDF
This slide delineates various steps to measure organizational operating expenses opex which can be beneficial for companies in calculating business expenditures in advance. Steps covered in the slide are recognize, adding expenditure and categorize. Persuade your audience using this Three Step Process To Measure Organizational Business Operational Expenditure Microsoft PDF. This PPT design covers three stages, thus making it a great tool to use. It also caters to a variety of topics including Recognize, Adding Expenditure, Categorize. Download this PPT design now to present a convincing pitch that not only emphasizes the topic but also showcases your presentation skills.

Strategies To Measure Training Return On Investment Ppt Infographic Template Graphics PDF
The following slide showcases effective strategies to measure training ROI. The strategies covered are be moderate while calculating ROI, continuous monitoring and dont skimp on the details. Presenting Strategies To Measure Training Return On Investment Ppt Infographic Template Graphics PDF to dispense important information. This template comprises three stages. It also presents valuable insights into the topics including Continuous Monitoring, Obtain Feedback, Managers And Supervisors. This is a completely customizable PowerPoint theme that can be put to use immediately. So, download it and address the topic impactfully.
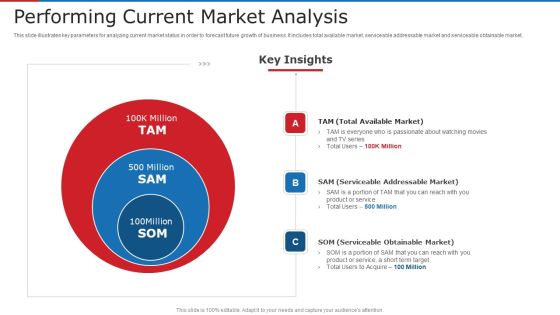
Performing Current Market Analysis Ppt Pictures Outfit PDF
This slide illustrates key parameters for analyzing current market status in order to forecast future growth of business. It includes total available market, serviceable addressable market and serviceable obtainable market. This is a performing current market analysis ppt pictures outfit pdf template with various stages. Focus and dispense information on three stages using this creative set, that comes with editable features. It contains large content boxes to add your information on topics like service, target, product, market. You can also showcase facts, figures, and other relevant content using this PPT layout. Grab it now.
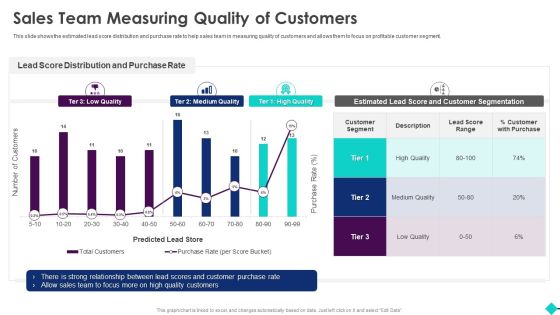
Sales Process Automation For Revenue Growth Sales Team Measuring Quality Of Customers Rules PDF
This slide shows the estimated lead score distribution and purchase rate to help sales team in measuring quality of customers and allows them to focus on profitable customer segment.Deliver an awe inspiring pitch with this creative Sales Process Automation For Revenue Growth Sales Team Measuring Quality Of Customers Rules PDF bundle. Topics like Distribution And Purchase, Customer Segmentation, Quality Customers can be discussed with this completely editable template. It is available for immediate download depending on the needs and requirements of the user.

Sales Automation Procedure Sales Team Measuring Quality Of Customers Ideas PDF
This slide shows the estimated lead score distribution and purchase rate to help sales team in measuring quality of customers and allows them to focus on profitable customer segment. Deliver an awe inspiring pitch with this creative Sales Automation Procedure Sales Team Measuring Quality Of Customers Ideas PDF bundle. Topics like Low Quality, Medium Quality, High Quality, Customer Segment can be discussed with this completely editable template. It is available for immediate download depending on the needs and requirements of the user.

Sales Team Measuring Quality Of Customers Digitally Streamline Automation Sales Operations Pictures PDF
This slide shows the estimated lead score distribution and purchase rate to help sales team in measuring quality of customers and allows them to focus on profitable customer segment. Deliver an awe inspiring pitch with this creative Sales Team Measuring Quality Of Customers Digitally Streamline Automation Sales Operations Pictures PDF bundle. Topics like High Quality, Medium Quality, Low Quality can be discussed with this completely editable template. It is available for immediate download depending on the needs and requirements of the user.

Sales Procedure Automation To Enhance Sales Sales Team Measuring Quality Of Customers Summary PDF
This slide shows the estimated lead score distribution and purchase rate to help sales team in measuring quality of customers and allows them to focus on profitable customer segment.Deliver an awe inspiring pitch with this creative Sales Procedure Automation To Enhance Sales Sales Team Measuring Quality Of Customers Summary PDF bundle. Topics like Score Distribution, Customer Purchase, Customer Segment can be discussed with this completely editable template. It is available for immediate download depending on the needs and requirements of the user.

Market Share By Category Calculating Brand Wallet Share After Ppt Outline Aids PDF
The purpose of this slide is to provide information regarding the measurement of wallet share of a particular brand for various customers. Deliver an awe inspiring pitch with this creative market share by category calculating brand wallet share after ppt outline aids pdf bundle. Topics like calculating brand wallet share can be discussed with this completely editable template. It is available for immediate download depending on the needs and requirements of the user.
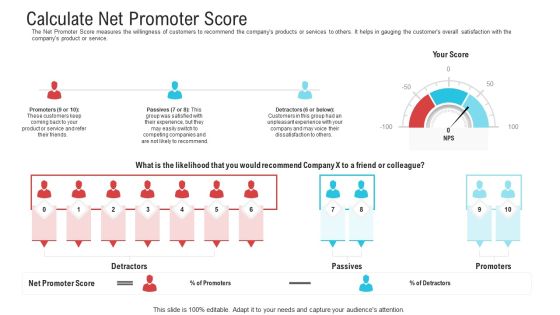
Objective To Improve Customer Experience Calculate Net Promoter Score Slides PDF
The Net Promoter Score measures the willingness of customers to recommend the companys products or services to others. It helps in gauging the customers overall satisfaction with the companys product or service.Deliver an awe-inspiring pitch with this creative objective to improve customer experience calculate net promoter score slides pdf. bundle. Topics like calculate net promoter score can be discussed with this completely editable template. It is available for immediate download depending on the needs and requirements of the user.
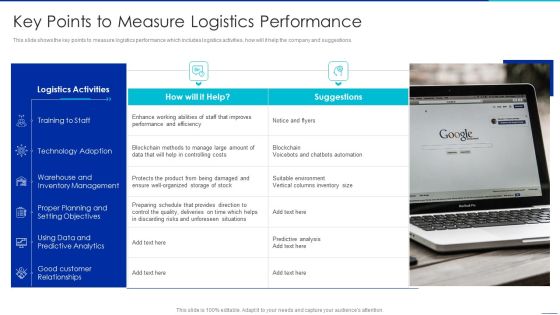
Optimizing Logistics Management Process Key Points To Measure Logistics Performance Formats PDF
This slide shows the key points to measure logistics performance which includes logistics activities, how will it help the company and suggestions. Presenting optimizing logistics management process key points to measure logistics performance formats pdf to provide visual cues and insights. Share and navigate important information on two stages that need your due attention. This template can be used to pitch topics like training to staff, technology adoption, inventory management, data and predictive analytics. In addtion, this PPT design contains high resolution images, graphics, etc, that are easily editable and available for immediate download.

6 Step Approach To Measure Brand Strength Guide To Brand Value Rules PDF
This slide shows six stage process that will help the organization in measuring its brand strength. Here the process starts from developing business goals and end at calculating brand strength score.Find highly impressive 6 Step Approach To Measure Brand Strength Guide To Brand Value Rules PDF on Slidegeeks to deliver a meaningful presentation. You can save an ample amount of time using these presentation templates. No need to worry to prepare everything from scratch because Slidegeeks experts have already done a huge research and work for you. You need to download 6 Step Approach To Measure Brand Strength Guide To Brand Value Rules PDF for your upcoming presentation. All the presentation templates are 100precent editable and you can change the color and personalize the content accordingly. Download now.

Measuring Business Earnings With Profitability Ratios Effective Planning For Monetary Strategy Elements PDF
This slide provides glimpse about profitability ratio analysis for calculating our firms business earnings and net profit margin. It includes quarterly gross profit margin, quarterly net profit margin, key insights, etc.If you are looking for a format to display your unique thoughts, then the professionally designed Measuring Business Earnings With Profitability Ratios Effective Planning For Monetary Strategy Elements PDF is the one for you. You can use it as a Google Slides template or a PowerPoint template. Incorporate impressive visuals, symbols, images, and other charts. Modify or reorganize the text boxes as you desire. Experiment with shade schemes and font pairings. Alter, share or cooperate with other people on your work. Download Measuring Business Earnings With Profitability Ratios Effective Planning For Monetary Strategy Elements PDF and find out how to give a successful presentation. Present a perfect display to your team and make your presentation unforgettable.

Business Development Program Measuring The Roi Of Training Program Structure PDF
The following slide showcases the technique to calculate return on investment of a training program based on the comparison of change in employee productivity rate, value of time saved with increased efficiency and the expected benefit on the organizational level. Explore a selection of the finest Business Development Program Measuring The Roi Of Training Program Structure PDF here. With a plethora of professionally designed and pre-made slide templates, you can quickly and easily find the right one for your upcoming presentation. You can use our Business Development Program Measuring The Roi Of Training Program Structure PDF to effectively convey your message to a wider audience. Slidegeeks has done a lot of research before preparing these presentation templates. The content can be personalized and the slides are highly editable. Grab templates today from Slidegeeks.

Comprehensive Guide To Strengthen Brand Equity 6 Step Approach To Measure Brand Strength Download PDF
This slide shows six stage process that will help the organization in measuring its brand strength. Here the process starts from developing business goals and end at calculating brand strength score. Coming up with a presentation necessitates that the majority of the effort goes into the content and the message you intend to convey. The visuals of a PowerPoint presentation can only be effective if it supplements and supports the story that is being told. Keeping this in mind our experts created Comprehensive Guide To Strengthen Brand Equity 6 Step Approach To Measure Brand Strength Download PDF to reduce the time that goes into designing the presentation. This way, you can concentrate on the message while our designers take care of providing you with the right template for the situation.

Share Of Wallet Calculating Brand Wallet Share Ppt File Grid PDF
The purpose of this slide is to provide information regarding the measurement of wallet share of a particular brand for various customers. Deliver an awe-inspiring pitch with this creative share of wallet calculating brand wallet share ppt file grid pdf bundle. Topics like customers, brand, satisfaction scores can be discussed with this completely editable template. It is available for immediate download depending on the needs and requirements of the user.

Building Customer Experience Strategy For Business Calculate Net Promoter Score Professional PDF
The Net Promoter Score measures the willingness of customers to recommend the companys products or services to others. It helps in gauging the customers overall satisfaction with the companys product or service. Deliver an awe inspiring pitch with this creative building customer experience strategy for business calculate net promoter score professional pdf bundle. Topics like customers, company, product can be discussed with this completely editable template. It is available for immediate download depending on the needs and requirements of the user.
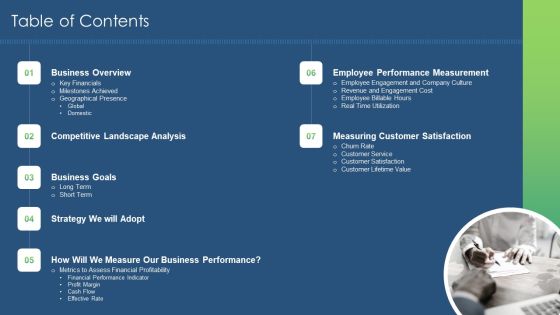
Sustainability Calculation With KPI Table Of Contents Ppt PowerPoint Presentation File Ideas PDF
This is a sustainability calculation with kpi table of contents ppt powerpoint presentation file ideas pdf template with various stages. Focus and dispense information on seven stages using this creative set, that comes with editable features. It contains large content boxes to add your information on topics like business overview, business goals, customer satisfaction, employee performance measurement. You can also showcase facts, figures, and other relevant content using this PPT layout. Grab it now.
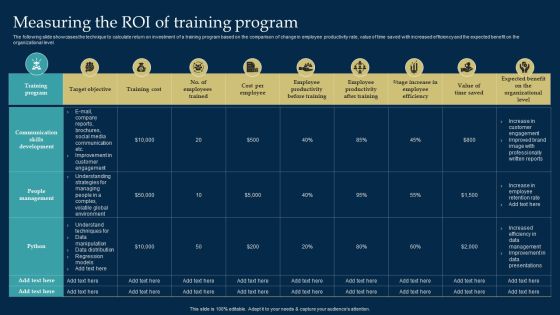
Employee Training And Development Strategy Measuring The ROI Of Training Program Designs PDF
The following slide showcases the technique to calculate return on investment of a training program based on the comparison of change in employee productivity rate, value of time saved with increased efficiency and the expected benefit on the organizational level. Are you in need of a template that can accommodate all of your creative concepts This one is crafted professionally and can be altered to fit any style. Use it with Google Slides or PowerPoint. Include striking photographs, symbols, depictions, and other visuals. Fill, move around, or remove text boxes as desired. Test out color palettes and font mixtures. Edit and save your work, or work with colleagues. Download Employee Training And Development Strategy Measuring The ROI Of Training Program Designs PDF and observe how to make your presentation outstanding. Give an impeccable presentation to your group and make your presentation unforgettable.

Adjusting Financial Strategies And Planning Measuring Business Earnings With Profitability Ratios Download PDF
This slide provides glimpse about profitability ratio analysis for calculating our firms business earnings and net profit margin. It includes quarterly gross profit margin, quarterly net profit margin, key insights, etc. The Adjusting Financial Strategies And Planning Measuring Business Earnings With Profitability Ratios Download PDF is a compilation of the most recent design trends as a series of slides. It is suitable for any subject or industry presentation, containing attractive visuals and photo spots for businesses to clearly express their messages. This template contains a variety of slides for the user to input data, such as structures to contrast two elements, bullet points, and slides for written information. Slidegeeks is prepared to create an impression.

Skill Enhancement Plan Measuring The Roi Of Training Program Introduction PDF
The following slide showcases the technique to calculate return on investment of a training program based on the comparison of change in employee productivity rate, value of time saved with increased efficiency and the expected benefit on the organizational level. The Skill Enhancement Plan Measuring The Roi Of Training Program Introduction PDF is a compilation of the most recent design trends as a series of slides. It is suitable for any subject or industry presentation, containing attractive visuals and photo spots for businesses to clearly express their messages. This template contains a variety of slides for the user to input data, such as structures to contrast two elements, bullet points, and slides for written information. Slidegeeks is prepared to create an impression.

Product Marketing Management To Enforce Business Performance Major Marketing Challenges Brochure PDF
This slide shows the major marketing challenges faced by the company. Key challenges in this slide are generating new traffic and leads, providing ROI for marketing activities, deliver account based marketing strategy, securing budget, managing marketing activities etc. Find a pre designed and impeccable Product Marketing Management To Enforce Business Performance Major Marketing Challenges Brochure PDF. The templates can ace your presentation without additional effort. You can download these easy to edit presentation templates to make your presentation stand out from others. So, what are you waiting for Download the template from Slidegeeks today and give a unique touch to your presentation.
Product Marketing Management To Enforce Business Performance Strategy 1 Manage Icons PDF
This slide shows the challenge and various strategic initiatives taken by the company under the Manage and Optimize Teams and Budgets strategy. Want to ace your presentation in front of a live audience Our Product Marketing Management To Enforce Business Performance Strategy 1 Manage Icons PDF can help you do that by engaging all the users towards you. Slidegeeks experts have put their efforts and expertise into creating these impeccable powerpoint presentations so that you can communicate your ideas clearly. Moreover, all the templates are customizable, and easy to edit and downloadable. Use these for both personal and commercial use.

Pros And Cons Of Leading And Lagging Indicators Inspiration PDF
This slide showcase the advantages and disadvantages of leading and lagging indicators. It showcases the difference on the basis of predictability, Performance measurement, outcomes etc. Showcasing this set of slides titled Pros And Cons Of Leading And Lagging Indicators Inspiration PDF. The topics addressed in these templates are Strategies Forecasting Future, Accurate Measure, Predict Business. All the content presented in this PPT design is completely editable. Download it and make adjustments in color, background, font etc. as per your unique business setting.
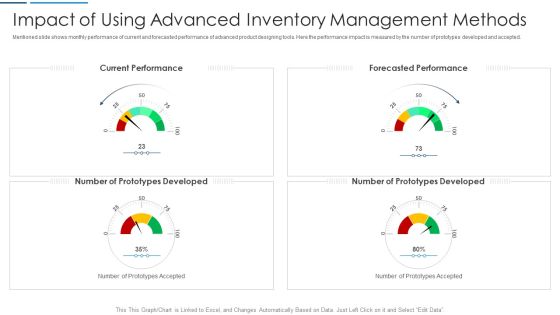
Information Technology Transformation Impact Of Using Advanced Inventory Management Methods Background PDF
Mentioned slide shows monthly performance of current and forecasted performance of advanced product designing tools. Here the performance impact is measured by the number of prototypes developed and accepted. Presenting information technology transformation impact of using advanced inventory management methods background pdf to provide visual cues and insights. Share and navigate important information on four stages that need your due attention. This template can be used to pitch topics like current performance, forecasted performance, developed. In addtion, this PPT design contains high resolution images, graphics, etc, that are easily editable and available for immediate download.

Information Technology Transformation Impact Of Using Advanced Manufacturing Machines Diagrams PDF
Mentioned slide shows daily performance of current and forecasted performance of advanced manufacturing machines. Here the performance impact is measured on average runtime of machine with product output and maintenance cost. This is a information technology transformation impact of using advanced manufacturing machines diagrams pdf template with various stages. Focus and dispense information on two stages using this creative set, that comes with editable features. It contains large content boxes to add your information on topics like forecasted performance, current performance, maintenance cost. You can also showcase facts, figures, and other relevant content using this PPT layout. Grab it now.

Budget Funds And Time Presentation Background Images
This is a budget funds and time presentation background images. This is a six stage process. The stages in this process are required by customer relative to competitors market growth, corporate, performance, budget funds and time, cost to achieve responsibilities, performance by product market segment, turnover profit and shareholders value.

Corporate Training Program Measuring The ROI Of Training Program Diagrams PDF
The following slide showcases the technique to calculate return on investment of a training program based on the comparison of change in employee productivity rate, value of time saved with increased efficiency and the expected benefit on the organizational level. Boost your pitch with our creative Corporate Training Program Leadership Skill Matrix Of Managers Infographics PDF. Deliver an awe-inspiring pitch that will mesmerize everyone. Using these presentation templates you will surely catch everyones attention. You can browse the ppts collection on our website. We have researchers who are experts at creating the right content for the templates. So you do not have to invest time in any additional work. Just grab the template now and use them.

Market Share By Category Calculating Brand Wallet Share Several Ppt Layouts Objects PDF
The purpose of this slide is to provide information regarding the measurement of wallet share of a particular brand for various customers. Presenting market share by category calculating brand wallet share several ppt layouts objects pdf to provide visual cues and insights. Share and navigate important information on four stages that need your due attention. This template can be used to pitch topics like calculating brand wallet share. In addtion, this PPT design contains high resolution images, graphics, etc, that are easily editable and available for immediate download.
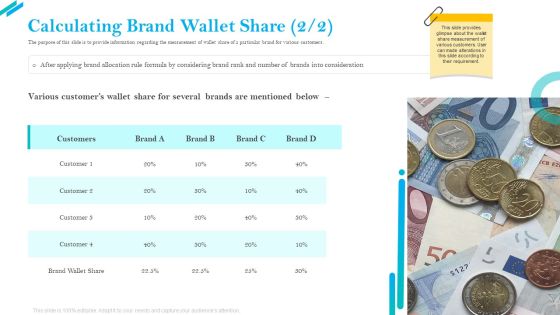
SCR For Market Calculating Brand Wallet Share Several Ppt Portfolio Template PDF
The purpose of this slide is to provide information regarding the measurement of wallet share of a particular brand for various customers. This is a SCR for market calculating brand wallet share several ppt portfolio template pdf template with various stages. Focus and dispense information on one stage using this creative set, that comes with editable features. It contains large content boxes to add your information on topics like calculating brand wallet share, various customers wallet share for several brands are mentioned. You can also showcase facts, figures, and other relevant content using this PPT layout. Grab it now.

 Home
Home