Project Management Dashboard

Corporate Digital Transformation Roadmap Team Members For Delivering Digital Transformation Topics PDF
Purpose of the following slide is to show the key team members responsible for delivering the digital transformation project, the following slide displays the team structure and the key roles and responsibilities of the team members. This is a Corporate Digital Transformation Roadmap Team Members For Delivering Digital Transformation Topics PDF template with various stages. Focus and dispense information on two stages using this creative set, that comes with editable features. It contains large content boxes to add your information on topics like Operational Leader Team, Vendor Management Team, Data And Analytics Leader And Team You can also showcase facts, figures, and other relevant content using this PPT layout. Grab it now.

Gantt Chart For Digital Marketing Proposal For Increasing Website Traffic Summary PDF
Your complex projects can be managed and organized simultaneously using this detailed gantt chart for digital marketing proposal for increasing website traffic summary pdf template. Track the milestones, tasks, phases, activities, and subtasks to get an updated visual of your project. Share your planning horizon and release plan with this well crafted presentation template. This exemplary template can be used to plot various dependencies to distinguish the tasks in the pipeline and their impact on the schedules and deadlines of the project. Apart from this, you can also share this visual presentation with your team members and stakeholders. It a resourceful tool that can be incorporated into your business structure. Therefore, download and edit it conveniently to add the data and statistics as per your requirement.
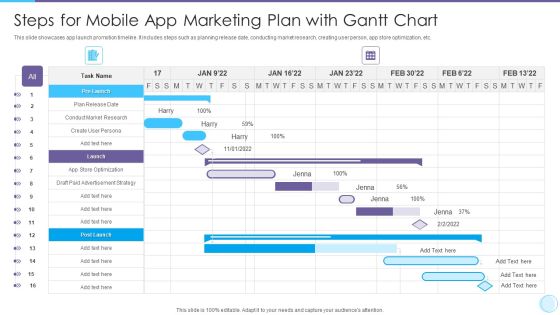
Steps For Mobile App Marketing Plan With Gantt Chart Rules PDF
Your complex projects can be managed and organized simultaneously using this detailed Steps For Mobile App Marketing Plan With Gantt Chart Rules PDF template. Track the milestones, tasks, phases, activities, and subtasks to get an updated visual of your project. Share your planning horizon and release plan with this well crafted presentation template. This exemplary template can be used to plot various dependencies to distinguish the tasks in the pipeline and their impact on the schedules and deadlines of the project. Apart from this, you can also share this visual presentation with your team members and stakeholders. It a resourceful tool that can be incorporated into your business structure. Therefore, download and edit it conveniently to add the data and statistics as per your requirement

Three Dimensional Games Proposal Gantt Chart For Game Development Services Inspiration PDF
Manage your complex projects and organize them simultaneously with this detailed Gantt Chart PowerPoint Template. Track your milestones, tasks, phases, activities, subtasks amongst other constituents that will give you an updated visual of your project. Reflect your planning horizon and capture your release plan in one view with this Gantt Chart PowerPoint presentation template. You can plot various dependencies directly on this Timeline PowerPoint Presentation Layout to see which tasks are still in the pipeline and how the delays in them are impacting the schedules and deadlines of the project. Apart from this, you can also share this updated visual with your team members and stakeholders, thus making it a resourceful tool to be incorporated in your business structure. Not only this but also the editable layout of this slide helps you to add your data and statistics at your convenience.

Conversion Rate Optimization Gantt Chart For Conversion Rate Enhancement Proposal Ppt Icon Example PDF
Manage your complex projects and organize them simultaneously with this detailed Gantt Chart PowerPoint Template. Track your milestones, tasks, phases, activities, subtasks amongst other constituents that will give you an updated visual of your project. Reflect your planning horizon and capture your release plan in one view with this Gantt Chart PowerPoint presentation template. You can plot various dependencies directly on this Timeline PowerPoint Presentation Layout to see which tasks are still in the pipeline and how the delays in them are impacting the schedules and deadlines of the project. Apart from this, you can also share this updated visual with your team members and stakeholders, thus making it a resourceful tool to be incorporated in your business structure. Not only this but also the editable layout of this slide helps you to add your data and statistics at your convenience.

Supply Chain Data Interpretation And Vulnerability Evaluation Report Pictures PDF
This slide shows the assessment report prepared through data analytics showing the weaknesses identified in management of supply chain risks. It includes details related to vulnerability comparison to industry benchmark and financial resiliency scores Showcasing this set of slides titled Supply Chain Data Interpretation And Vulnerability Evaluation Report Pictures PDF. The topics addressed in these templates are Planning And Supplier Network, Transportation And Logistics, Financial Flexibility. All the content presented in this PPT design is completely editable. Download it and make adjustments in color, background, font etc. as per your unique business setting.

Benefits Of Implementing Big Data Analytics Procedure In Organization Introduction PDF
This slide illustrate various benefits of big data analysis process implementation in an organization. It includes benefits such as cost reduction, product development, customer experience and risk management Presenting Benefits Of Implementing Big Data Analytics Procedure In Organization Introduction PDF to dispense important information. This template comprises three stages. It also presents valuable insights into the topics including Cost Reduction, Product Development, Customer Experience. This is a completely customizable PowerPoint theme that can be put to use immediately. So, download it and address the topic impactfully.

3d Two Stages Of Process Analysis Flowchart Application PowerPoint Templates
We present our 3d two stages of process analysis flowchart application PowerPoint templates.Use our Business PowerPoint Templates because it helps you to project your enthusiasm and single mindedness to your colleagues. Use our Competition PowerPoint Templates because brilliant ideas are your forte. Present our Marketing PowerPoint Templates because our PowerPoint templates designed for your ideas to sell. Use our Design PowerPoint Templates because they are Gauranteed to focus the minds of your team. Download our Metaphor PowerPoint Templates because this diagram depicts the essence of this chain reaction like sequence of events.Use these PowerPoint slides for presentations relating to analysis, analyze, background, business, chart, competition, conceptual, corporation, create, data, decision, design, direction, economic, enterprise, future, graph, idea, illustration, information, innovate, layout, management, marketing, paper, plan, process, product, project, science, social, . The prominent colors used in the PowerPoint template are Blue, Gray, Black. Professionals tell us our 3d two stages of process analysis flowchart application PowerPoint templates are Glamorous. The feedback we get is that our create PowerPoint templates and PPT Slides are Vintage. We assure you our 3d two stages of process analysis flowchart application PowerPoint templates will help them to explain complicated concepts. Customers tell us our conceptual PowerPoint templates and PPT Slides will get their audience's attention. Presenters tell us our 3d two stages of process analysis flowchart application PowerPoint templates will generate and maintain the level of interest you desire. They will create the impression you want to imprint on your audience. People tell us our chart PowerPoint templates and PPT Slides are Functional.
Statistical Data For Identity Fraud Reports Icons PDF
This slide showcases identity thefts and frauds complaints in various years. This template focuses on providing layers of protection to customers digital identities and reduce risk of financial loss. It includes information related to consumer complainants, etc. Showcasing this set of slides titled Statistical Data For Identity Fraud Reports Icons PDF. The topics addressed in these templates are Poor Management Information, Lack Of Transparency, Protected Accounts. All the content presented in this PPT design is completely editable. Download it and make adjustments in color, background, font etc. as per your unique business setting.

5 Types Of Data Analytics Required In Insurance Sector Background PDF
This slide showcases need of data analytics for insurance personnels. Key requirements areas highlighted here are customer acquisition, product pricing, risk analysis, claim management and operations. Presenting 5 Types Of Data Analytics Required In Insurance Sector Background PDF to dispense important information. This template comprises five stages. It also presents valuable insights into the topics including Risk Analysis, Product Pricing, Customer Acquisition. This is a completely customizable PowerPoint theme that can be put to use immediately. So, download it and address the topic impactfully.

Best Practices For Progress Summary Creation Ideas PDF
Following slide showcases best practices for creating progress report which help to manage projects and secure businesses. It presents information related to data usage, transparency, etc. Presenting Best Practices For Progress Summary Creation Ideas PDF to dispense important information. This template comprises six stages. It also presents valuable insights into the topics including Use Data, Be Transparent, Include Company Department Goals. This is a completely customizable PowerPoint theme that can be put to use immediately. So, download it and address the topic impactfully.

Toolkit For Data Science And Analytics Transition Value Stream Data Analytics Process Background PDF
This slide shows the step by step approach of data analytics project focusing on data gathering, consolidation and data analysis to build business insights for effective decision making. Find highly impressive Toolkit For Data Science And Analytics Transition Value Stream Data Analytics Process Background PDF on Slidegeeks to deliver a meaningful presentation. You can save an ample amount of time using these presentation templates. No need to worry to prepare everything from scratch because Slidegeeks experts have already done a huge research and work for you. You need to download Toolkit For Data Science And Analytics Transition Value Stream Data Analytics Process Background PDF for your upcoming presentation. All the presentation templates are 100 percent editable and you can change the color and personalize the content accordingly. Download now.

Innovative Technologies For Improving Economic Functions Ppt PowerPoint Presentation File Graphics Example PDF
This slide showcase key digital technologies for improving financials functions. It includes major steps such as-Make user friendly dashboards for internal customer demands, Develop predictive models for every warning etc. Persuade your audience using this innovative technologies for improving economic functions ppt powerpoint presentation file graphics example pdf. This PPT design covers four stages, thus making it a great tool to use. It also caters to a variety of topics including automation and robotics, data visualization, advanced analytics for finance. Download this PPT design now to present a convincing pitch that not only emphasizes the topic but also showcases your presentation skills.
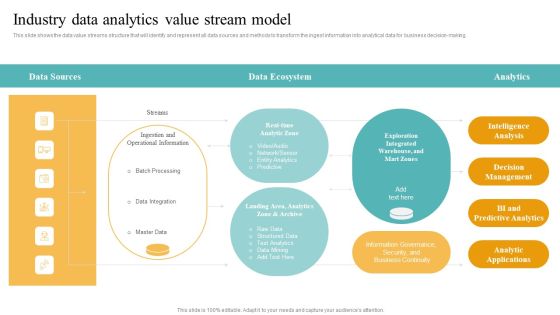
Transformation Toolkit Competitive Intelligence Information Analysis Industry Data Analytics Value Stream Model Raw Mockup PDF
This slide illustrates the workflow related to performing the data analytics project along with key responsible owners to accomplish the activities. If you are looking for a format to display your unique thoughts, then the professionally designed Transformation Toolkit Competitive Intelligence Information Analysis Industry Data Analytics Value Stream Model Raw Mockup PDF is the one for you. You can use it as a Google Slides template or a PowerPoint template. Incorporate impressive visuals, symbols, images, and other charts. Modify or reorganize the text boxes as you desire. Experiment with shade schemes and font pairings. Alter, share or cooperate with other people on your work. Download Transformation Toolkit Competitive Intelligence Information Analysis Industry Data Analytics Value Stream Model Raw Mockup PDF and find out how to give a successful presentation. Present a perfect display to your team and make your presentation unforgettable.

Data Evaluation And Processing Toolkit Value Stream Data Analytics Process Demonstration PDF
This slide shows the step by step approach of data analytics project focusing on data gathering, consolidation and data analysis to build business insights for effective decision making. Coming up with a presentation necessitates that the majority of the effort goes into the content and the message you intend to convey. The visuals of a PowerPoint presentation can only be effective if it supplements and supports the story that is being told. Keeping this in mind our experts created Data Evaluation And Processing Toolkit Value Stream Data Analytics Process Demonstration PDF to reduce the time that goes into designing the presentation. This way, you can concentrate on the message while our designers take care of providing you with the right template for the situation.
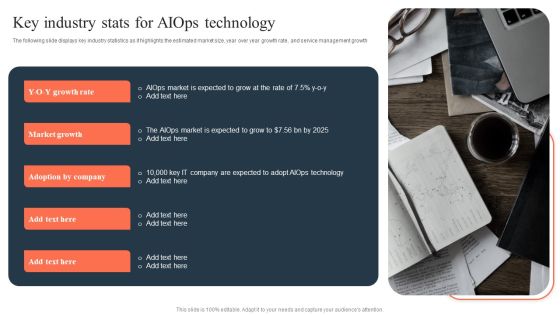
Ml And Big Data In Information Technology Processes Key Industry Stats For Aiops Technology Background PDF
The following slide displays key industry statistics as it highlights the estimated market size, year over year growth rate, and service management growth The best PPT templates are a great way to save time, energy, and resources. Slidegeeks have 100 percent editable powerpoint slides making them incredibly versatile. With these quality presentation templates, you can create a captivating and memorable presentation by combining visually appealing slides and effectively communicating your message. Download Ml And Big Data In Information Technology Processes Key Industry Stats For Aiops Technology Background PDF from Slidegeeks and deliver a wonderful presentation.

Major Types Of Data Analytics For Medical Administration Summary PDF
The following slide highlights the various types of data analytics for medical and healthcare management to evaluate and predict future trends. It constitutes of descriptive, predictive, prescriptive, discovery analytics.Presenting Major Types Of Data Analytics For Medical Administration Summary PDF to dispense important information. This template comprises four stages. It also presents valuable insights into the topics including Descriptive Analytics, Predictive Analytics, Discovery Analytics. This is a completely customizable PowerPoint theme that can be put to use immediately. So, download it and address the topic impactfully.

Developing Significant Business Maintaining Upcoming Product Sales Forecasting Professional PDF
This slide provides information regarding management of new products sales that are to be launched in the market. The product sales data that needs to be tracked include unit price, unit cost, market size, operating income, etc. Deliver an awe inspiring pitch with this creative Developing Significant Business Maintaining Upcoming Product Sales Forecasting Professional PDF bundle. Topics like Product Sales Data, Target Operating Income, Target Market Share can be discussed with this completely editable template. It is available for immediate download depending on the needs and requirements of the user.

5 Key Considerations To Initiate Data Centralization Introduction PDF
This slide showcases important points to consider while initiating for data centralization in the organization. Key five points highlighted here are data alignment, budget allocation, data security, cross-functionality and data monitoring. Presenting 5 Key Considerations To Initiate Data Centralization Introduction PDF to dispense important information. This template comprises five stages. It also presents valuable insights into the topics including Data Monitoring, Data Security, Management System. This is a completely customizable PowerPoint theme that can be put to use immediately. So, download it and address the topic impactfully.

Defining Key Metrics To Analyse Current Sales Performance Background PDF
The following slide showcases some metrics to evaluate existing sales performance due to execute effective risk management strategies. It includes elements such as opportunities, win rate, average time to win, average value per win, sales velocity etc. Want to ace your presentation in front of a live audience Our Defining Key Metrics To Analyse Current Sales Performance Background PDF can help you do that by engaging all the users towards you. Slidegeeks experts have put their efforts and expertise into creating these impeccable powerpoint presentations so that you can communicate your ideas clearly. Moreover, all the templates are customizable, and easy to edit and downloadable. Use these for both personal and commercial use.

11 Stages Representing Diverging Circular Flow Chart Cycle Layout Diagram PowerPoint Slides
We present our 11 stages representing diverging circular flow chart Cycle Layout Diagram PowerPoint Slides.Download our Arrows PowerPoint Templates because this diagram helps you to explain your strategy to co-ordinate activities of these seperate groups. Use our Flow charts PowerPoint Templates because this template helps you to put your finger on the pulse of your business and sense the need to re-align a bit. Download and present our Business PowerPoint Templates because it helps you to project your enthusiasm and single mindedness to your colleagues. Download and present our Process and Flows PowerPoint Templates because your brain is always churning out ideas like cogs in a wheel. Present our Circle charts PowerPoint Templates because it shows you the vision of a desired destination and the best road to take to reach that goal.Use these PowerPoint slides for presentations relating to Business, chart, circle, colors, concept, corporate, cycle, data, design, detail, development, diagram, engineering, graphic, ideas, illustration, image, implement, implementation, life, lifecycle, management, model, objects, organization, plan, process, product, professional, project, quality, schema, shape, stack, stage, steps, strategy, structure, success, symbol. The prominent colors used in the PowerPoint template are Blue, Gray, Black. You can be sure our 11 stages representing diverging circular flow chart Cycle Layout Diagram PowerPoint Slides are designed by a team of presentation professionals. Presenters tell us our circle PowerPoint templates and PPT Slides are Precious. We assure you our 11 stages representing diverging circular flow chart Cycle Layout Diagram PowerPoint Slides are Clever. Customers tell us our data PowerPoint templates and PPT Slides are Dazzling. Presenters tell us our 11 stages representing diverging circular flow chart Cycle Layout Diagram PowerPoint Slides are Amazing. You can be sure our data PowerPoint templates and PPT Slides are incredible easy to use.

Key Benefits Post Implementing Risk Mitigation Strategies Topics PDF
The following slide exhibits the positive impact of implementing risk management strategies in real estate business. Customer satisfaction, improved data security, operational process improvement and reduced catastrophic events are some of the major benefits which are outlined in the slide. Deliver and pitch your topic in the best possible manner with this Key Benefits Post Implementing Risk Mitigation Strategies Topics PDF. Use them to share invaluable insights on Customer Satisfaction, Data Security, Process Improvement and impress your audience. This template can be altered and modified as per your expectations. So, grab it now.

Key Components Of Healthcare Risk Administration Plan Diagrams PDF
This slide outline fundamental components that must be incorporated into healthcare risk management plans to communicate the purpose behind the plan. It includes training and education, purpose goals and metrics, communication plan, reporting protocols, and response plan. Presenting Key Components Of Healthcare Risk Administration Plan Diagrams PDF to dispense important information. This template comprises five stages. It also presents valuable insights into the topics including Training And Education, Communication Plan, Reporting Protocols. This is a completely customizable PowerPoint theme that can be put to use immediately. So, download it and address the topic impactfully.

Kpis To Measure Success For Financing Hotel Business Opportunities Professional PDF
This slide exhibits KPIs for hotel revenue management that helps to assess current position and revenue of business. It includes performance metrics occupancy, average daily rate, GOPPAR, EBIT with calculation method. Presenting Kpis To Measure Success For Financing Hotel Business Opportunities Professional PDF to dispense important information. This template comprises Four stages. It also presents valuable insights into the topics including Occupancy, Average Dailyrate, Gross Operating. This is a completely customizable PowerPoint theme that can be put to use immediately. So, download it and address the topic impactfully.

New Website Launch Strategy Raci Matrix For Allocating Responsibilities Template PDF
Mentioned slide demonstrates assignment of roles and responsibilities to launch and marketing team members for better reporting structure. It includes key team members such as project manager, UI or UX designer, web developer, QA engineer, marketing strategist, SEO specialist, etc. Slidegeeks is one of the best resources for PowerPoint templates. You can download easily and regulate New Website Launch Strategy Raci Matrix For Allocating Responsibilities Template PDF for your personal presentations from our wonderful collection. A few clicks is all it takes to discover and get the most relevant and appropriate templates. Use our Templates to add a unique zing and appeal to your presentation and meetings. All the slides are easy to edit and you can use them even for advertisement purposes.

Comprehensive Analysis Of Different Data Lineage Classification Steps To Implement Data Lineage Designs PDF
This slide represents the steps to implement data lineage in business, and it includes finding key business drivers, onboarding the senior management on the project, scoping the project, and defining the scope. Find highly impressive Comprehensive Analysis Of Different Data Lineage Classification Steps To Implement Data Lineage Designs PDF on Slidegeeks to deliver a meaningful presentation. You can save an ample amount of time using these presentation templates. No need to worry to prepare everything from scratch because Slidegeeks experts have already done a huge research and work for you. You need to download Comprehensive Analysis Of Different Data Lineage Classification Steps To Implement Data Lineage Designs PDF for your upcoming presentation. All the presentation templates are 100 percent editable and you can change the color and personalize the content accordingly. Download now
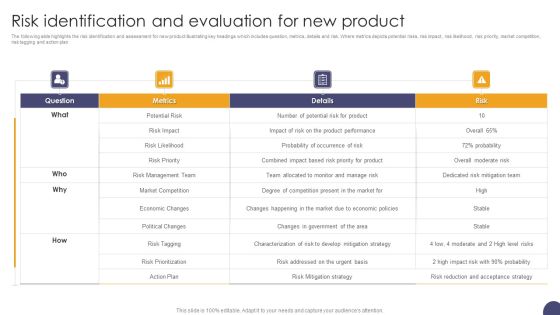
Risk Identification And Evaluation For New Product Ppt Styles Portfolio PDF
The following slide highlights the risk identification and assessment for new product illustrating key headings which includes question, metrics, details and risk. Where metrics depicts potential risks, risk impact, risk likelihood, risk priority, market competition, risk tagging and action plan. Pitch your topic with ease and precision using this Risk Identification And Evaluation For New Product Ppt Styles Portfolio PDF. This layout presents information on Metrics, Risk, Risk Priority, Risk Management Team. It is also available for immediate download and adjustment. So, changes can be made in the color, design, graphics or any other component to create a unique layout.
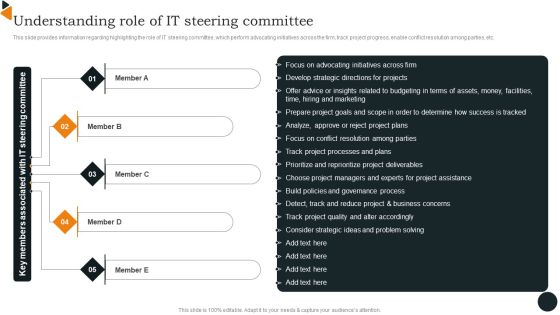
Chief Information Officers Guide On Technology Plan Understanding Role Of IT Infographics PDF
This slide provides information regarding highlighting the role of IT steering committee, which perform advocating initiatives across the firm, track project progress, enable conflict resolution among parties, etc. Do you have an important presentation coming up Are you looking for something that will make your presentation stand out from the rest Look no further than Chief Information Officers Guide On Technology Plan Understanding Role Of IT Infographics PDF. With our professional designs, you can trust that your presentation will pop and make delivering it a smooth process. And with Slidegeeks, you can trust that your presentation will be unique and memorable. So why wait Grab Chief Information Officers Guide On Technology Plan Understanding Role Of IT Infographics PDF today and make your presentation stand out from the rest.

Online Payment Service Digital Payment System Deployment Services Ppt Slides Brochure PDF
Listed Solutions provides centralized, secure storage of analytical assets, and advanced capabilities for management and control of predictive analytic processes. This is a online payment service digital payment system deployment services ppt slides brochure pdf template with various stages. Focus and dispense information on four stages using this creative set, that comes with editable features. It contains large content boxes to add your information on topics like automate processes, share analytical across, infrastructure, secure your data. You can also showcase facts, figures, and other relevant content using this PPT layout. Grab it now.
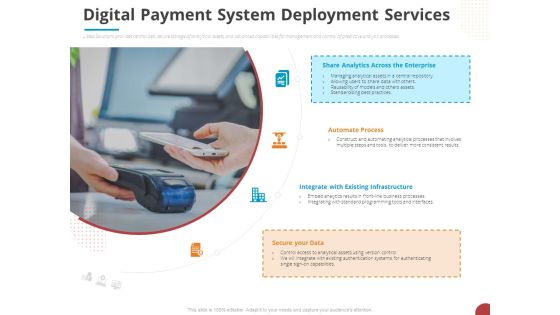
Online Settlement Revolution Digital Payment System Deployment Services Summary PDF
Listed Solutions provides centralized, secure storage of analytical assets, and advanced capabilities for management and control of predictive analytic processes. Presenting online settlement revolution digital payment system deployment services summary pdf to provide visual cues and insights. Share and navigate important information on four stages that need your due attention. This template can be used to pitch topics like automate process, analytics, infrastructure, data. In addtion, this PPT design contains high resolution images, graphics, etc, that are easily editable and available for immediate download.

Potential Benefits Effect On Business After Implementation Of Cost Allocation Inspiration PDF
This slide covers the benefits to firm after implementation of cost allocation methods such as increase in ability to allocate model based on cost pool, increase in accuracy via automated calculation and many more. Deliver an awe inspiring pitch with this creative Potential Benefits Effect On Business After Implementation Of Cost Allocation Inspiration PDF bundle. Topics like Methodology, Management Analysis, Driver Data can be discussed with this completely editable template. It is available for immediate download depending on the needs and requirements of the user.
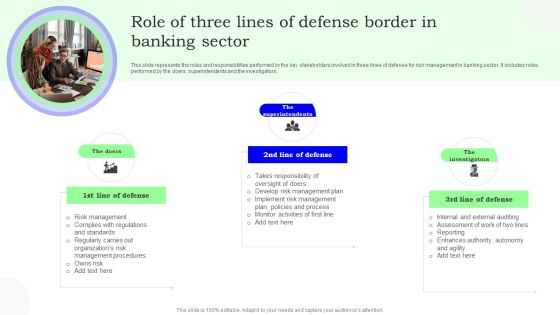
Role Of Three Lines Of Defense Border In Banking Sector Infographics PDF
This slide represents the roles and responsibilities performed by the key stakeholders involved in three lines of defense for risk management in banking sector. It includes roles performed by the doers, superintendents and the investigators. Persuade your audience using this Role Of Three Lines Of Defense Border In Banking Sector Infographics PDF. This PPT design covers three stages, thus making it a great tool to use. It also caters to a variety of topics including Banking Sector, Superintendents, Defense. Download this PPT design now to present a convincing pitch that not only emphasizes the topic but also showcases your presentation skills.
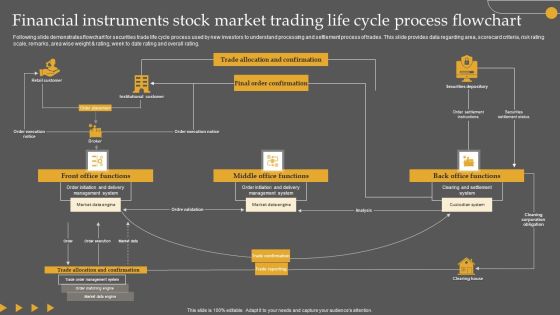
Financial Instruments Stock Market Trading Life Cycle Process Flowchart Designs PDF
Following slide demonstrates flowchart for securities trade life cycle process used by new investors to understand processing and settlement process of trades. This slide provides data regarding area, scorecard criteria, risk rating scale, remarks, area wise weight and rating, week to date rating and overall rating. Pitch your topic with ease and precision using this Financial Instruments Stock Market Trading Life Cycle Process Flowchart Designs PDF. This layout presents information on Management System, Market Data Engine, Execution. It is also available for immediate download and adjustment. So, changes can be made in the color, design, graphics or any other component to create a unique layout.

Business Objectives Of Risk Framework Ppt Powerpoint Layout
This is a business objectives of risk framework ppt powerpoint layout. This is a four stage process. The stages in this process are risk management, identify risk and opportunity, value management, it process management, analyses risk, manage risk, collect data, risk evaluation.

Identifying Direct And Indirect Role Of Predictive Analytics On Data In Preventing Summary PDF
The firm will use advanced technology such as predictive analytics in order to project the probability of future outcomes, events based on current and historical data. It utilizes different statistical techniques such as machine learning, pattern recognition through data mining, etc. Are you searching for a Identifying Direct And Indirect Role Of Predictive Analytics On Data In Preventing Summary PDF that is uncluttered, straightforward, and original Its easy to edit, and you can change the colors to suit your personal or business branding. For a presentation that expresses how much effort youve put in, this template is ideal With all of its features, including tables, diagrams, statistics, and lists, its perfect for a business plan presentation. Make your ideas more appealing with these professional slides. Download Identifying Direct And Indirect Role Of Predictive Analytics On Data In Preventing Summary PDF from Slidegeeks today.

Market Trends Market Size And Demand Forecasts Ppt PowerPoint Presentation Topics
This is a market trends market size and demand forecasts ppt powerpoint presentation topics. This is a two stage process. The stages in this process are market projected to reach, asia pacific, the largest market.

Financial Market Plan Internal Reporting Ppt Example
This is a financial market plan internal reporting ppt example. This is a five stage process. The stages in this process are internal reporting, maintaining projects capital expenditures, financial market plan, content manufacturers, supplier oriented exchanges.
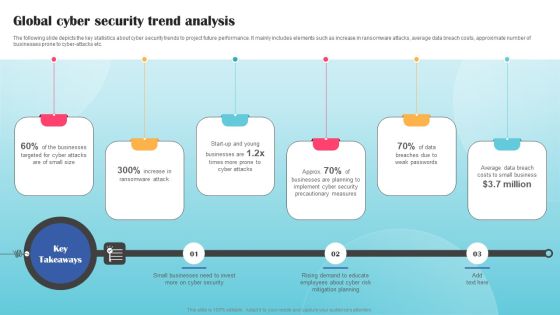
Global Cyber Security Trend Analysis Ppt PowerPoint Presentation File Styles PDF
The following slide depicts the key statistics about cyber security trends to project future performance. It mainly includes elements such as increase in ransomware attacks, average data breach costs, approximate number of businesses prone to cyber-attacks etc. The Global Cyber Security Trend Analysis Ppt PowerPoint Presentation File Styles PDF is a compilation of the most recent design trends as a series of slides. It is suitable for any subject or industry presentation, containing attractive visuals and photo spots for businesses to clearly express their messages. This template contains a variety of slides for the user to input data, such as structures to contrast two elements, bullet points, and slides for written information. Slidegeeks is prepared to create an impression.
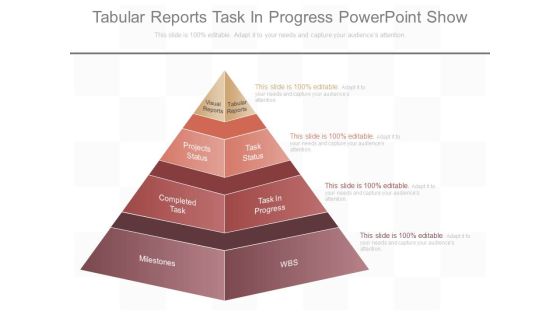
Tabular Reports Task In Progress Powerpoint Show
This is a tabular reports task in progress powerpoint show. This is a four stage process. The stages in this process are visual reports, projects status, completed task, milestones, tabular reports, task status, task in progress, wbs.

Deploying Corporate Aligned IT Strategy Major Statistics Associated With Ongoing Strategic IT Trends Professional PDF
This slide provides information regarding statistics associated with ongoing IT trends in terms of market size of digital transformation segment, project contribution of AI, amount of global crime damage, etc. Do you have an important presentation coming up Are you looking for something that will make your presentation stand out from the rest Look no further than Deploying Corporate Aligned IT Strategy Major Statistics Associated With Ongoing Strategic IT Trends Professional PDF. With our professional designs, you can trust that your presentation will pop and make delivering it a smooth process. And with Slidegeeks, you can trust that your presentation will be unique and memorable. So why wait Grab Deploying Corporate Aligned IT Strategy Major Statistics Associated With Ongoing Strategic IT Trends Professional PDF today and make your presentation stand out from the rest.
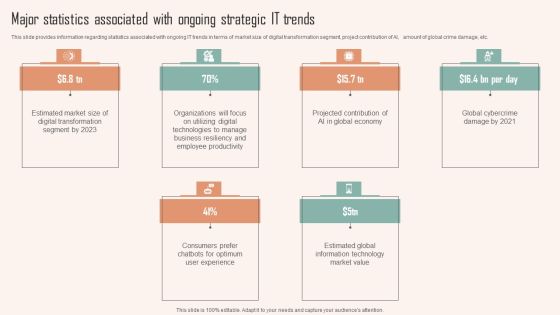
Major Statistics Associated With Ongoing Strategic IT Trends Ppt PowerPoint Presentation File Professional PDF
This slide provides information regarding statistics associated with ongoing IT trends in terms of market size of digital transformation segment, project contribution of AI, amount of global crime damage, etc. Here you can discover an assortment of the finest PowerPoint and Google Slides templates. With these templates, you can create presentations for a variety of purposes while simultaneously providing your audience with an eye catching visual experience. Download Major Statistics Associated With Ongoing Strategic IT Trends Ppt PowerPoint Presentation File Professional PDF to deliver an impeccable presentation. These templates will make your job of preparing presentations much quicker, yet still, maintain a high level of quality. Slidegeeks has experienced researchers who prepare these templates and write high quality content for you. Later on, you can personalize the content by editing the Major Statistics Associated With Ongoing Strategic IT Trends Ppt PowerPoint Presentation File Professional PDF.

Global Construction Sector Industry Report Key Construction Industry Market Challenges Mockup PDF
This slide represents market challenges for construction industry. It includes poor productivity, rising material cost, poor project performance, shortage for skilled labor and sustainability. Get a simple yet stunning designed Global Construction Sector Industry Report Key Construction Industry Market Challenges Mockup PDF. It is the best one to establish the tone in your meetings. It is an excellent way to make your presentations highly effective. So, download this PPT today from Slidegeeks and see the positive impacts. Our easy to edit Global Construction Sector Industry Report Key Construction Industry Market Challenges Mockup PDF can be your go to option for all upcoming conferences and meetings. So, what are you waiting for Grab this template today.

Data Stewardship Program For Healthcare Industry Sample PDF
This slide depicts the overview of data stewardship in the healthcare industry. As the medical industry becomes digital, it generates massive amounts of data and to manage this data, stewards are required. It also contains the roles and responsibilities of healthcare data stewards, such as maintaining data quality, etc. Take your projects to the next level with our ultimate collection of Data Stewardship Program For Healthcare Industry Sample PDF. Slidegeeks has designed a range of layouts that are perfect for representing task or activity duration, keeping track of all your deadlines at a glance. Tailor these designs to your exact needs and give them a truly corporate look with your own brand colors they will make your projects stand out from the rest.

Digital Marketing Toolkit Marketing Transformation Business Case And Key Deliverables Diagrams PDF
This slide covers the market transformation business case and roadmap starting from project initiation, baseline, opportunity matrix and ending at reports and presentation. Here you can discover an assortment of the finest PowerPoint and Google Slides templates. With these templates, you can create presentations for a variety of purposes while simultaneously providing your audience with an eye-catching visual experience. Download Digital Marketing Toolkit Marketing Transformation Business Case And Key Deliverables Diagrams PDF to deliver an impeccable presentation. These templates will make your job of preparing presentations much quicker, yet still, maintain a high level of quality. Slidegeeks has experienced researchers who prepare these templates and write high-quality content for you. Later on, you can personalize the content by editing the Digital Marketing Toolkit Marketing Transformation Business Case And Key Deliverables Diagrams PDF.

IT Alignment Phases In Business Roadmap For Business And IT Alignment Template PDF
This slide depicts the roadmap for business and IT alignment in the company, including the various steps to be taken such as planning, capacity planning, service level agreement check ups, business process observation, mapping, resource allocation, project methods, status reporting, and so on. The IT Alignment Phases In Business Roadmap For Business And IT Alignment Template PDF is a compilation of the most recent design trends as a series of slides. It is suitable for any subject or industry presentation, containing attractive visuals and photo spots for businesses to clearly express their messages. This template contains a variety of slides for the user to input data, such as structures to contrast two elements, bullet points, and slides for written information. Slidegeeks is prepared to create an impression.

30 60 90 Days Plan For Implementing Data Lineage Themes PDF
This slide depicts the 30 60 90 days plan for implementing data lineage in the organization, including the steps to be taken such as finding key business drivers, onboarding senior management on the project, scoping the project, defining the scope and so on.Presenting this PowerPoint presentation, titled 30 60 90 Days Plan For Implementing Data Lineage Themes PDF, with topics curated by our researchers after extensive research. This editable presentation is available for immediate download and provides attractive features when used. Download now and captivate your audience. Presenting this 30 60 90 Days Plan For Implementing Data Lineage Themes PDF. Our researchers have carefully researched and created these slides with all aspects taken into consideration. This is a completely customizable 30 60 90 Days Plan For Implementing Data Lineage Themes PDF that is available for immediate downloading. Download now and make an impact on your audience. Highlight the attractive features available with our PPTs.
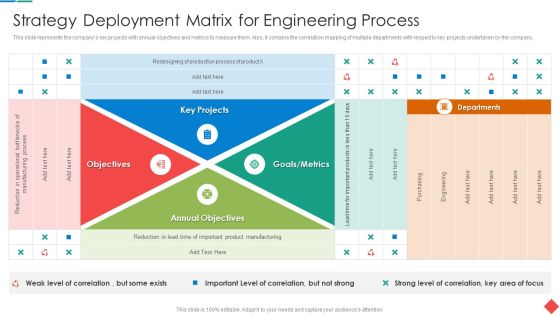
Strategy Deployment Matrix For Engineering Process Portrait PDF
This slide represents the companys key projects with annual objectives and metrics to measure them. Also, it contains the correlation mapping of multiple departments with respect to key projects undertaken by the company.Deliver and pitch your topic in the best possible manner with this Strategy Deployment Matrix For Engineering Process Portrait PDF Use them to share invaluable insights on Objectives, Annual Objectives, Goals Metrics and impress your audience. This template can be altered and modified as per your expectations. So, grab it now.
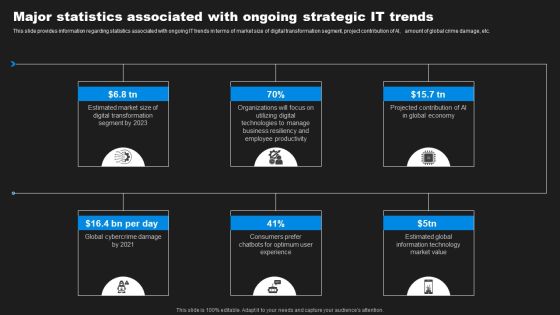
Enhancing Information Technology With Strategic Major Statistics Associated With Ongoing Sample PDF
This slide provides information regarding statistics associated with ongoing IT trends in terms of market size of digital transformation segment, project contribution of AI, amount of global crime damage, etc. This modern and well arranged Enhancing Information Technology With Strategic Major Statistics Associated With Ongoing Sample PDF provides lots of creative possibilities. It is very simple to customize and edit with the Powerpoint Software. Just drag and drop your pictures into the shapes. All facets of this template can be edited with Powerpoint no extra software is necessary. Add your own material, put your images in the places assigned for them, adjust the colors, and then you can show your slides to the world, with an animated slide included.
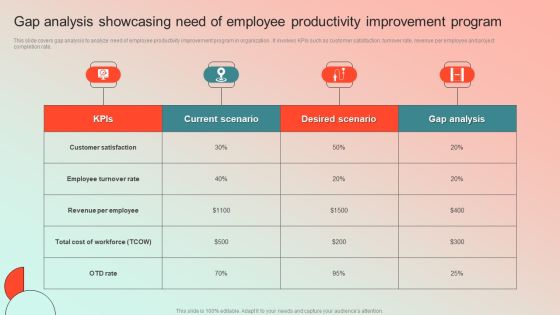
Gap Analysis Showcasing Need Of Employee Productivity Improvement Program Professional PDF
This slide covers gap analysis to analyze need of employee productivity improvement program in organization . It involves KPIs such as customer satisfaction, turnover rate, revenue per employee and project completion rate. Here you can discover an assortment of the finest PowerPoint and Google Slides templates. With these templates, you can create presentations for a variety of purposes while simultaneously providing your audience with an eye catching visual experience. Download Gap Analysis Showcasing Need Of Employee Productivity Improvement Program Professional PDF to deliver an impeccable presentation. These templates will make your job of preparing presentations much quicker, yet still, maintain a high level of quality. Slidegeeks has experienced researchers who prepare these templates and write high quality content for you. Later on, you can personalize the content by editing the Gap Analysis Showcasing Need Of Employee Productivity Improvement Program Professional PDF.

6 Stages Flow Diverging Process Arrows Relative Cycle Chart PowerPoint Slides
We present our 6 stages flow diverging process arrows Relative Cycle Chart PowerPoint Slides.Download and present our Boxes PowerPoint Templates because you understand the ailment and how to fight it. Download our Business PowerPoint Templates because this template can project the path to sucess that you have charted. Download our Arrows PowerPoint Templates because so that you can Lead the way to spread good cheer to one and all. Download and present our Circle Charts PowerPoint Templates because Our PowerPoint Templates and Slides offer you the widest possible range of options. Download our Flow Charts PowerPoint Templates because your group can behave steady in the top bracket.Use these PowerPoint slides for presentations relating to 3d, abstract, arrow, art, background, blank, business, chart, circle, concept, connection, cycle, development, diagram, direction, element, environment, exchange, finance, financial, flow, graph, graphic, graphic presentation, group, icon, illustration, investment, isolated, isometric, market, motion, movement, organization, passive income, perspective, process, process chart, recycle, report, ring, sign, step, stock, success, symbol, teamwork, text, vector. The prominent colors used in the PowerPoint template are Blue, Red, Yellow. Presenters tell us our 6 stages flow diverging process arrows Relative Cycle Chart PowerPoint Slides will save the presenter time. You can be sure our arrow PowerPoint templates and PPT Slides are Excellent. Professionals tell us our 6 stages flow diverging process arrows Relative Cycle Chart PowerPoint Slides are Handsome. People tell us our art PowerPoint templates and PPT Slides are Youthful. People tell us our 6 stages flow diverging process arrows Relative Cycle Chart PowerPoint Slides will make the presenter look like a pro even if they are not computer savvy. Professionals tell us our arrow PowerPoint templates and PPT Slides provide great value for your money. Be assured of finding the best projection to highlight your words.

Data Analytics IT Timeline For Data Science Implementation In The Organization Ppt Portfolio Icons PDF
This slide represents the timeline for the data science projects and a list of tasks performed each month, from training to work on projects. This is a data analytics it timeline for data science implementation in the organization ppt portfolio icons pdf template with various stages. Focus and dispense information on four stages using this creative set, that comes with editable features. It contains large content boxes to add your information on topics like exploratory analysis, final analysis, data cleaning, conditioning and transformation, data gathering from different resources. You can also showcase facts, figures, and other relevant content using this PPT layout. Grab it now.

Initiatives To Enhance Environmental Compliance Plan Introduction PDF
The slide showcases suggestions to help EH and S managers enhance their environmental efforts in organizational projects and re-invent companys environmental compliance strategy. It covers aspects such as strategic tips, initiatives and associated benefits. Persuade your audience using this Initiatives To Enhance Environmental Compliance Plan Introduction PDF. This PPT design covers three stages, thus making it a great tool to use. It also caters to a variety of topics including Routine Internal Audits, Organizations, Consistent Data. Download this PPT design now to present a convincing pitch that not only emphasizes the topic but also showcases your presentation skills.

Maintaining Upcoming Product Sales Forecasting Demonstration PDF
This slide provides information regarding management of new products sales that are to be launched in the market. The product sales data that needs to be tracked include unit price, unit cost, market size, operating income, etc. Coming up with a presentation necessitates that the majority of the effort goes into the content and the message you intend to convey. The visuals of a PowerPoint presentation can only be effective if it supplements and supports the story that is being told. Keeping this in mind our experts created Maintaining Upcoming Product Sales Forecasting Demonstration PDF to reduce the time that goes into designing the presentation. This way, you can concentrate on the message while our designers take care of providing you with the right template for the situation.
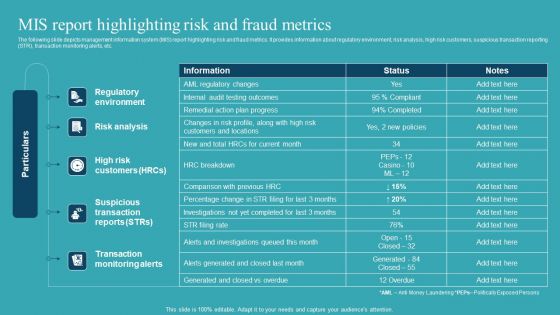
Integrating AML And Transaction Mis Report Highlighting Risk And Fraud Metrics Professional PDF
The following slide depicts management information system MIS report highlighting risk and fraud metrics. It provides information about regulatory environment, risk analysis, high risk customers, suspicious transaction reporting STR, transaction monitoring alerts, etc. The Integrating AML And Transaction Mis Report Highlighting Risk And Fraud Metrics Professional PDF is a compilation of the most recent design trends as a series of slides. It is suitable for any subject or industry presentation, containing attractive visuals and photo spots for businesses to clearly express their messages. This template contains a variety of slides for the user to input data, such as structures to contrast two elements, bullet points, and slides for written information. Slidegeeks is prepared to create an impression.

Comprehensive Customer Data Platform Guide Optimizing Promotional Initiatives Perform Comparative Analysis Vendor Background PDF
The following slide showcases the comparative assessment of various vendors to gain better value and support. It includes elements such as predictive analysis, real time behavior, supports digital marketing, personalization, recommendations, loyalty management etc. Slidegeeks is one of the best resources for PowerPoint templates. You can download easily and regulate Comprehensive Customer Data Platform Guide Optimizing Promotional Initiatives Perform Comparative Analysis Vendor Background PDF for your personal presentations from our wonderful collection. A few clicks is all it takes to discover and get the most relevant and appropriate templates. Use our Templates to add a unique zing and appeal to your presentation and meetings. All the slides are easy to edit and you can use them even for advertisement purposes.

Iot Applications For Manufacturing Industry Iot Manufacturing AI Big Data And Predictive Analytics Mockup PDF
This slide highlights the IoT components of manufacturing which includes artificial intelligence AI, big data and predictive analysis with the importance to businesses. Take your projects to the next level with our ultimate collection of Iot Applications For Manufacturing Industry Iot Manufacturing AI Big Data And Predictive Analytics Mockup PDF. Slidegeeks has designed a range of layouts that are perfect for representing task or activity duration, keeping track of all your deadlines at a glance. Tailor these designs to your exact needs and give them a truly corporate look with your own brand colors they will make your projects stand out from the rest.

Information Studies Timeline For Data Science Implementation In The Organization Infographics PDF
This slide represents the timeline for the data science projects and a list of tasks performed each month, from training to work on projects. Presenting Information Studies Timeline For Data Science Implementation In The Organization Infographics PDF to provide visual cues and insights. Share and navigate important information on six stages that need your due attention. This template can be used to pitch topics like Different Resources, Exploratory Analysis, Final Analysis. In addtion, this PPT design contains high resolution images, graphics, etc, that are easily editable and available for immediate download.

Maintaining Upcoming Product Sales Forecasting Rules PDF
This slide provides information regarding management of new products sales that are to be launched in the market. The product sales data that needs to be tracked include unit price, unit cost, market size, operating income, etc. Slidegeeks is here to make your presentations a breeze with Maintaining Upcoming Product Sales Forecasting Rules PDF With our easy to use and customizable templates, you can focus on delivering your ideas rather than worrying about formatting. With a variety of designs to choose from, you are sure to find one that suits your needs. And with animations and unique photos, illustrations, and fonts, you can make your presentation pop. So whether you are giving a sales pitch or presenting to the board, make sure to check out Slidegeeks first.

Data Mining Implementation Timeline For Data Mining Implementation In The Organization Icons PDF
This slide represents the timeline for the data science projects and a list of tasks performed each month, from training to work on projects.This is a data mining implementation timeline for data mining implementation in the organization icons pdf template with various stages. Focus and dispense information on six stages using this creative set, that comes with editable features. It contains large content boxes to add your information on topics like conditioning and transformation, exploratory analysis, final analysis You can also showcase facts, figures, and other relevant content using this PPT layout. Grab it now.

Defining Key Metrics To Analyse Current Sales Performance Ppt Infographics Ideas PDF
The following slide showcases some metrics to evaluate existing sales performance due to execute effective risk management strategies. It includes elements such as opportunities, win rate, average time to win, average value per win, sales velocity etc. Welcome to our selection of the Defining Key Metrics To Analyse Current Sales Performance Ppt Infographics Ideas PDF. These are designed to help you showcase your creativity and bring your sphere to life. Planning and Innovation are essential for any business that is just starting out. This collection contains the designs that you need for your everyday presentations. All of our PowerPoints are 100 percent editable, so you can customize them to suit your needs. This multi purpose template can be used in various situations. Grab these presentation templates today.

 Home
Home