Project Management Dashboard

Dashboard For Risk Reporting Of Plan Effectiveness Download PDF
This slide depicts a dashboard for communication of hazard plan effectiveness to effectively manage the major incidents and take action accordingly. The key performing indicators are days since hazard incident, number of incidents in a year, risk assessments, etc. Showcasing this set of slides titled Dashboard For Risk Reporting Of Plan Effectiveness Download PDF. The topics addressed in these templates are Risk Assessments, Awaiting Submission, Awaiting Submission. All the content presented in this PPT design is completely editable. Download it and make adjustments in color, background, font etc. as per your unique business setting.
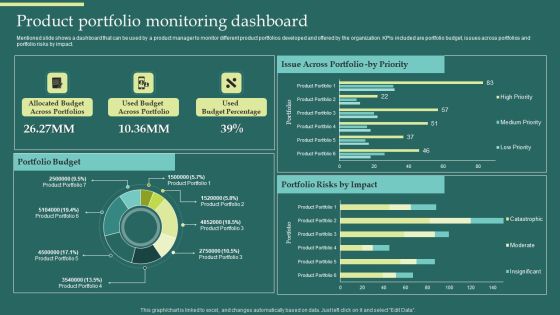
Product Portfolios And Strategic Product Portfolio Monitoring Dashboard Introduction PDF
Mentioned slide shows a dashboard that can be used by a product manager to monitor different product portfolios developed and offered by the organization. KPIs included are portfolio budget, issues across portfolios and portfolio risks by impact. Explore a selection of the finest Product Portfolios And Strategic Product Portfolio Monitoring Dashboard Introduction PDF here. With a plethora of professionally designed and pre-made slide templates, you can quickly and easily find the right one for your upcoming presentation. You can use our Product Portfolios And Strategic Product Portfolio Monitoring Dashboard Introduction PDF to effectively convey your message to a wider audience. Slidegeeks has done a lot of research before preparing these presentation templates. The content can be personalized and the slides are highly editable. Grab templates today from Slidegeeks.
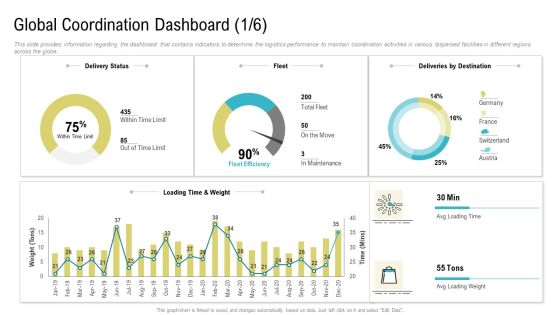
Global Coordination Dashboard Ppt Styles Graphics Download PDF
This slide provides information regarding the dashboard that contains indicators to determine the coordination activities in various dispersed facilities in different regions across the globe. Deliver and pitch your topic in the best possible manner with this global coordination dashboard ppt styles graphics download pdf. Use them to share invaluable insights on project, global coordination dashboard and impress your audience. This template can be altered and modified as per your expectations. So, grab it now.
Sales Activities Dashboard Ppt PowerPoint Presentation Icon Graphics
This is a sales activities dashboard ppt powerpoint presentation icon graphics. This is a two stage process. The stages in this process are business, finance, management, analysis, budget, actual.

Call Center Process Key Performance Indicator Dashboard Mockup PDF
This slide showcases call center process measurements and key performance indicators so managers and teams can keep track of and improve performance . It includes received calls, calculating speed of answering calls , ended calls before starting conversations , average calls per minute etc. Showcasing this set of slides titled Call Center Process Key Performance Indicator Dashboard Mockup PDF. The topics addressed in these templates are Received Calls, Conversation, Abandon Rate. All the content presented in this PPT design is completely editable. Download it and make adjustments in color, background, font etc. as per your unique business setting.

Healthcare Big Data Assessment Dashboard Slide2 Introduction PDF
This slide covers the records about the patients used to describe massive volumes of information created by the adoption of digital technologies that collect patients records and help in managing hospital performance. Showcasing this set of slides titled Healthcare Big Data Assessment Dashboard Slide2 Introduction PDF. The topics addressed in these templates are Forecasted Patient Turnover, Service Indicators, Occupancy. All the content presented in this PPT design is completely editable. Download it and make adjustments in color, background, font etc. as per your unique business setting.

Reshaping Business In Digital Digital Finance Dashboard Topics PDF
This slide covers transformation dashboard covering various stages of a business along with the budget and risks involved at every stage. Deliver and pitch your topic in the best possible manner with this Reshaping Business In Digital Digital Finance Dashboard Topics PDF. Use them to share invaluable insights on Digital Finance Management, Total Digital, Sales Revenues and impress your audience. This template can be altered and modified as per your expectations. So, grab it now.
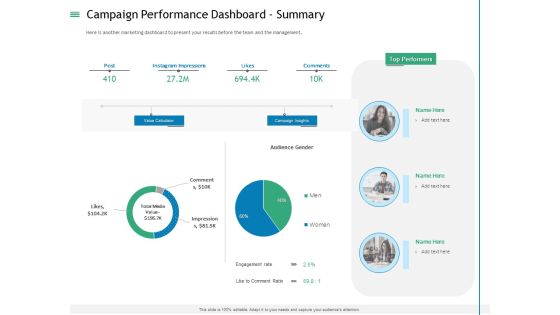
Measuring Influencer Marketing ROI Campaign Performance Dashboard Summary Topics PDF
Here is another marketing dashboard to present your results before the team and the management. Deliver and pitch your topic in the best possible manner with this measuring influencer marketing roi campaign performance dashboard summary topics pdf. Use them to share invaluable insights on value calculator, campaign insights, top performers, comments, instagram impressions and impress your audience. This template can be altered and modified as per your expectations. So, grab it now.
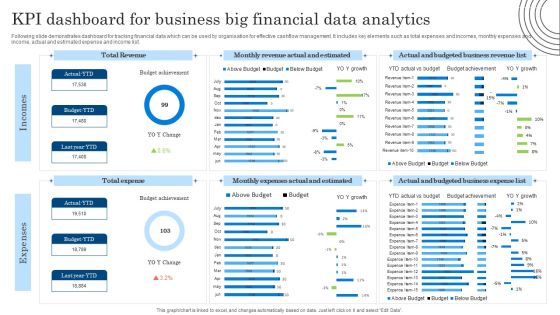
KPI Dashboard For Business Big Financial Data Analytics Diagrams PDF
Following slide demonstrates dashboard for tracking financial data which can be used by organisation for effective cashflow management. It includes key elements such as total expenses and incomes, monthly expenses and income, actual and estimated expense and income list. Showcasing this set of slides titled KPI Dashboard For Business Big Financial Data Analytics Diagrams PDF. The topics addressed in these templates are KPI Dashboard, Business Big Financial, Data Analytics. All the content presented in this PPT design is completely editable. Download it and make adjustments in color, background, font etc. as per your unique business setting.

Corporate Compliance Risk And Kpis Dashboard Slides PDF
This slide illustrates graphical representation of top 5 vulnerabilities, compliance risk graph, risk heat map. It also includes risk action plan and audit check ratio. Showcasing this set of slides titled Corporate Compliance Risk And Kpis Dashboard Slides PDF. The topics addressed in these templates are Corporate Compliance Risk And Kpis Dashboard. All the content presented in this PPT design is completely editable. Download it and make adjustments in color, background, font etc. as per your unique business setting.
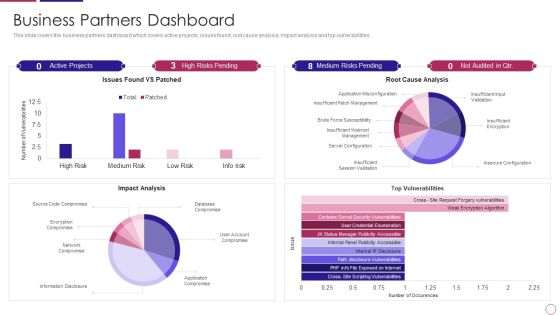
PRM To Streamline Business Processes Business Partners Dashboard Introduction PDF
This slide covers the business partners dashboard which covers active projects, issues found, root cause analysis, impact analysis and top vulnerabilities. Deliver and pitch your topic in the best possible manner with this prm to streamline business processes business partners dashboard introduction pdf. Use them to share invaluable insights on impact analysis, top vulnerabilities, server configuration, network compromise, issues found vs patched and impress your audience. This template can be altered and modified as per your expectations. So, grab it now.
Solution Development Process Performance Tracking Dashboard For SDLC Ideas PDF
This slide represents the software development life cycle dashboard, including summary, tasks, workloads, time spent on projects, new vs. finished, and team cost breakdown.Deliver an awe inspiring pitch with this creative Solution Development Process Performance Tracking Dashboard For SDLC Ideas PDF bundle. Topics like Summary, Workload, Cost Backdown can be discussed with this completely editable template. It is available for immediate download depending on the needs and requirements of the user.

Data Assimilation Business Intelligence KPI Dashboard Score Ppt Graphics PDF
Deliver and pitch your topic in the best possible manner with this data assimilation business intelligence kpi dashboard score ppt graphics pdf. Use them to share invaluable insights on revenue, projections, locations, growth, sales and impress your audience. This template can be altered and modified as per your expectations. So, grab it now.

Cyber Protection And Precaution Tracking Dashboard Designs PDF
This slide shows the dashboard of cyber safety and security of an organization. It includes risk level, compliance status, tracking and security budget. Showcasing this set of slides titled Cyber Protection And Precaution Tracking Dashboard Designs PDF. The topics addressed in these templates are Risk, Compliance Status, Risk Level. All the content presented in this PPT design is completely editable. Download it and make adjustments in color, background, font etc. as per your unique business setting.

Corporate Loan Operations Dashboard For Banks Introduction PDF
This slide displays the dashboard for corporate loan operations management. It include KPIs such as open cases with service level agreements, average open cases by agents, open cases by age, proposed exposure by risk rating, etc. Pitch your topic with ease and precision using this Corporate Loan Operations Dashboard For Banks Introduction PDF. This layout presents information on Proposed Exposure By Risk Rating, Open Cases By Age, Application Pipeline. It is also available for immediate download and adjustment. So, changes can be made in the color, design, graphics or any other component to create a unique layout.
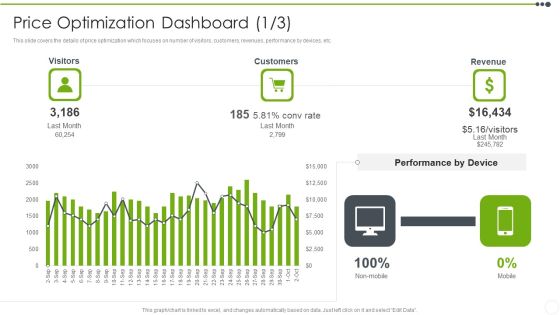
Estimating The Price Price Optimization Dashboard Portrait PDF
This slide covers the details of price optimization which focuses on price changes, leader, distribution, and benchmark. Deliver an awe inspiring pitch with this creative Estimating The Price Price Optimization Dashboard Portrait PDF bundle. Topics like Price Optimization Dashboard can be discussed with this completely editable template. It is available for immediate download depending on the needs and requirements of the user.

Key Performance Measure Dashboard Template Example Of Ppt
This is a key performance measure dashboard template example of ppt. This is a three stage process. The stages in this process are resources and tasks, sales, budget.

Business Opportunity Dashboard With Customer Metrics Information PDF
This Slide illustrates market opportunity dashboard with customer metrics which contains favorable net promoter score NPS, standard customers, growth rate, cumulative average of customer location, net income vs projection, customer distribution, sales by representatives, etc. Pitch your topic with ease and precision using this Business Opportunity Dashboard With Customer Metrics Information PDF. This layout presents information on Customer Distribution, Growth Rate, Top Customers Locations. It is also available for immediate download and adjustment. So, changes can be made in the color, design, graphics or any other component to create a unique layout.

Building Quality Inspection Dashboard With Customer Satisfaction Ratio Icons PDF
The following slide showcases dashboard of construction company exhibiting quality KPIs regarding safety, workmanship and customer satisfaction. Key indicators covered are site inspection success level, CSR, defect count, net promoter score, promotors, passives, defectors, total rework cost, safety meetings and average time taken to fix defects. Showcasing this set of slides titled Building Quality Inspection Dashboard With Customer Satisfaction Ratio Icons PDF. The topics addressed in these templates are Construction Project, Customer Satisfaction Ratio, Promoters. All the content presented in this PPT design is completely editable. Download it and make adjustments in color, background, font etc. as per your unique business setting.

Organization Corporate Sustainability Dashboard With Sourced Technologies Pictures PDF
The following slide showcases green business model for multiple activities. It provides information about growth, return on capital, risk management, innovation, operational risks, etc.Showcasing this set of slides titled Organization Corporate Sustainability Dashboard With Sourced Technologies Pictures PDF. The topics addressed in these templates are Electricity Consumed, Renewable Energy, Committees Covered. All the content presented in this PPT design is completely editable. Download it and make adjustments in color, background, font etc. as per your unique business setting.

Actual Vs Budgeted Earning Breakup Dashboard Inspiration PDF
This style showcases revenue breakdown dashboard that can help organization to compare the actual vs budgeted amount and calculate the variance in target achievements. Its key components are product revenue, services revenue and total revenues. Showcasing this set of slides titled Actual Vs Budgeted Earning Breakup Dashboard Inspiration PDF. The topics addressed in these templates are Actual Vs Budgeted, Earning Breakup Dashboard. All the content presented in this PPT design is completely editable. Download it and make adjustments in color, background, font etc. as per your unique business setting.
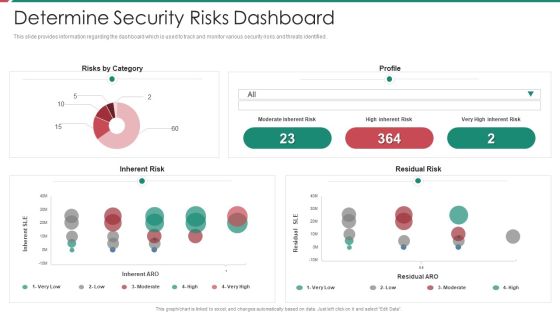
Security And Process Integration Determine Security Risks Dashboard Rules PDF
This slide provides information regarding the dashboard which is used to track and monitor various security risks and threats identified. Deliver and pitch your topic in the best possible manner with this security and process integration determine security risks dashboard rules pdf. Use them to share invaluable insights on moderate inherent risk, high inherent risk, very high inherent risk and impress your audience. This template can be altered and modified as per your expectations. So, grab it now.

Business Operational Expenditure Monitoring Dashboard With Budget Analysis Icons PDF
This slide shows operating expenses OPEX monitoring dashboard with budget analysis assisting companies in evaluating funds useful until end of the year. It visually present the organizations operating expenses by time period and sector. Showcasing this set of slides titled Business Operational Expenditure Monitoring Dashboard With Budget Analysis Icons PDF. The topics addressed in these templates are Business Operational, Budget Analysis, Monitoring Dashboard. All the content presented in this PPT design is completely editable. Download it and make adjustments in color, background, font etc. as per your unique business setting.
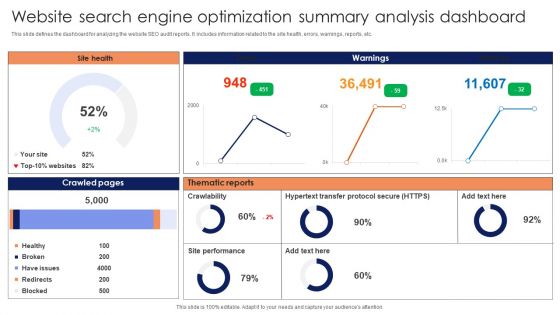
Website Search Engine Optimization Summary Analysis Dashboard Infographics PDF
This slide defines the dashboard for analyzing the website SEO audit reports. It includes information related to the site health, errors, warnings, reports, etc. Showcasing this set of slides titled Website Search Engine Optimization Summary Analysis Dashboard Infographics PDF. The topics addressed in these templates are Crawled Pages, Thematic Reports, Site Health, Warnings. All the content presented in this PPT design is completely editable. Download it and make adjustments in color, background, font etc. as per your unique business setting.

Organizational Security Solutions Determine Security Risks Dashboard Template PDF
This slide provides information regarding the dashboard which is used to track and monitor various security risks and threats identified. Deliver and pitch your topic in the best possible manner with this organizational security solutions determine security risks dashboard template pdf. Use them to share invaluable insights on moderate inherent risk, high inherent risk, very high inherent risk and impress your audience. This template can be altered and modified as per your expectations. So, grab it now.
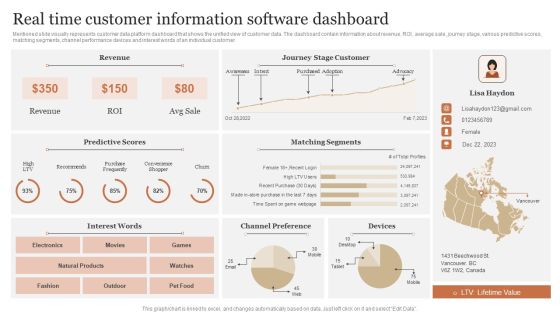
Real Time Customer Information Software Dashboard Portrait PDF
Mentioned slide visually represents customer data platform dashboard that shows the unified view of customer data. The dashboard contain information about revenue, ROI, average sale, journey stage, various predictive scores, matching segments, channel performance devices and interest words of an individual customer. Showcasing this set of slides titled Real Time Customer Information Software Dashboard Portrait PDF. The topics addressed in these templates are Predictive Scores, Matching Segments, Channel Preference. All the content presented in this PPT design is completely editable. Download it and make adjustments in color, background, font etc. as per your unique business setting.
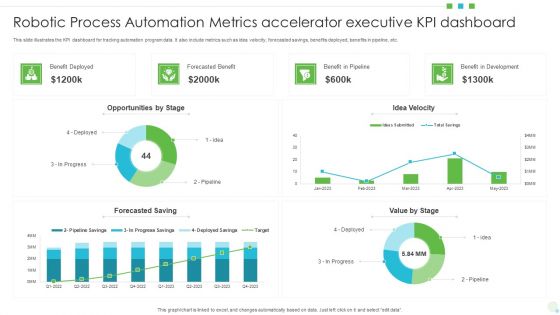
Robotic Process Automation Metrics Accelerator Executive KPI Dashboard Formats PDF
This slide illustrates the KPI dashboard for tracking automation program data. It also include metrics such as idea velocity, forecasted savings, benefits deployed, benefits in pipeline, etc. Showcasing this set of slides titled Robotic Process Automation Metrics Accelerator Executive KPI Dashboard Formats PDF. The topics addressed in these templates are Opportunities, Benefit In Development, Value. All the content presented in this PPT design is completely editable. Download it and make adjustments in color, background, font etc. as per your unique business setting.

KPI Dashboard To Measure Talent Performance Slides PDF
This slide represents dashboard to measure talent performance in organization. It includes talent applicant status, team training methods, talented candidate status, risk for loss of potential talent pool etc. Get a simple yet stunning designed KPI Dashboard To Measure Talent Performance Slides PDF. It is the best one to establish the tone in your meetings. It is an excellent way to make your presentations highly effective. So, download this PPT today from Slidegeeks and see the positive impacts. Our easy to edit KPI Dashboard To Measure Talent Performance Slides PDF can be your go-to option for all upcoming conferences and meetings. So, what are you waiting for Grab this template today.

Hoshin Kanri Pitch Deck Lean Production Process Dashboard Guidelines PDF
This template covers lean manufacturing process dashboard including key performance indicators such as lead production, utilization of machines , OEE and AMO for different processes Deliver and pitch your topic in the best possible manner with this hoshin kanri pitch deck lean production process dashboard guidelines pdf Use them to share invaluable insights on utilization of machines, combined oee of machines, production lead time distribution and impress your audience. This template can be altered and modified as per your expectations. So, grab it now.

Key Company Financials Business Intelligence Dashboard Graphics PDF
This slide showcases business intelligence dashboard to analyze key financial metrics for the organization. It includes information such as current working capital, vendor payment error rate, quick stats, budget variance, etc. Showcasing this set of slides titled Key Company Financials Business Intelligence Dashboard Graphics PDF. The topics addressed in these templates are Key Company Financials, Business Intelligence Dashboard. All the content presented in this PPT design is completely editable. Download it and make adjustments in color, background, font etc. as per your unique business setting.

Financial Dashboard To Evaluate Internal Rate Of Return Diagrams PDF
This slide showcases dashboard that can help organization to calculate the internal rate rate of return on invested capital. Company can use it to communicate the return on investment to investors. Create an editable Financial Dashboard To Evaluate Internal Rate Of Return Diagrams PDF that communicates your idea and engages your audience. Whether youre presenting a business or an educational presentation, pre designed presentation templates help save time. Financial Dashboard To Evaluate Internal Rate Of Return Diagrams PDF is highly customizable and very easy to edit, covering many different styles from creative to business presentations. Slidegeeks has creative team members who have crafted amazing templates. So, go and get them without any delay.

Financial Budgeting And Assessment Dashboard With Revenue Variance Designs PDF
This slide shows the dashboard representing financial analysis and planning of an organization. It highlights the set revenue targets and actual revenue with the help of graphs. Showcasing this set of slides titled Financial Budgeting And Assessment Dashboard With Revenue Variance Designs PDF. The topics addressed in these templates are YTD Revenue, Revenue Delta, Revenue Variance. All the content presented in this PPT design is completely editable. Download it and make adjustments in color, background, font etc. as per your unique business setting.
Online Business Simulation Dashboard For Practicing Marketing Strategies Icons PDF
This slide shows business simulation dashboard for strengthening marketing strategy practice. It provides information about marketing mix, budget, product allocation, time allocation, etc. Showcasing this set of slides titled Online Business Simulation Dashboard For Practicing Marketing Strategies Icons PDF. The topics addressed in these templates are Marketing Budget, Product Allocation, Marketing Team Size. All the content presented in this PPT design is completely editable. Download it and make adjustments in color, background, font etc. as per your unique business setting.
Project Tracking Planned Vs Actual Project Progress Tracker Pictures PDF
The following slide highlights the variations in the project progress to manage the its and ensure timely delivery. It includes KPIs such as completion percentage and the gap in the planned versus actual hours. Pitch your topic with ease and precision using this Project Tracking Planned Vs Actual Project Progress Tracker Pictures PDF. This layout presents information on Project Tracking Planned, Project Progress Tracker. It is also available for immediate download and adjustment. So, changes can be made in the color, design, graphics or any other component to create a unique layout.
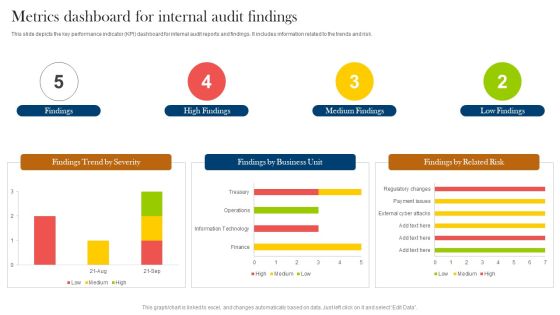
Metrics Dashboard For Internal Audit Findings Ppt Styles Gallery PDF
This slide depicts the key performance indicator KPI dashboard for internal audit reports and findings. It includes information related to the trends and risk. Pitch your topic with ease and precision using this Metrics Dashboard For Internal Audit Findings Ppt Styles Gallery PDF. This layout presents information on Findings, High Findings, Medium Findings, Low Findings. It is also available for immediate download and adjustment. So, changes can be made in the color, design, graphics or any other component to create a unique layout.
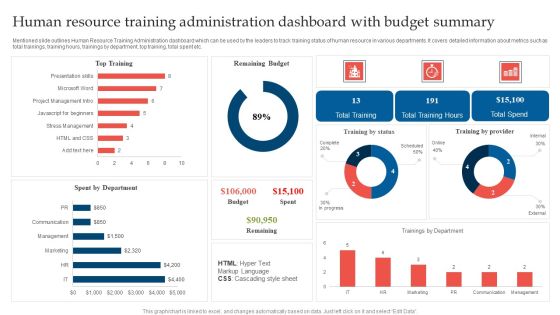
Human Resource Training Administration Dashboard With Budget Summary Microsoft PDF
Mentioned slide outlines Human Resource Training Administration dashboard which can be used by the leaders to track training status of human resource in various departments. It covers detailed information about metrics such as total trainings, training hours, trainings by department, top training, total spent etc. Showcasing this set of slides titled Human Resource Training Administration Dashboard With Budget Summary Microsoft PDF. The topics addressed in these templates are Remaining Budget, Top Training, Spent Department. All the content presented in this PPT design is completely editable. Download it and make adjustments in color, background, font etc. as per your unique business setting.

Revenue Performance And Risk Metrics Dashboard Demonstration PDF
This slide illustrates graphical representation of risk key performance indicators. It includes revenue performance of business units with their risk expenditure and people KRIs like employee job satisfaction, customer satisfaction etc. Showcasing this set of slides titled Revenue Performance And Risk Metrics Dashboard Demonstration PDF. The topics addressed in these templates are Total Risk Expenditure, Risk Management, Revenue Performance . All the content presented in this PPT design is completely editable. Download it and make adjustments in color, background, font etc. as per your unique business setting.

Dashboard For Service Subscription Numbers Assessment Professional PDF
This slide showcases dashboard that can help organization to conduct post service launch analysis by calculating total service subscriptions done by consumers. It can help organization to formulate mitigation strategies in case of declining revenues. Presenting this PowerPoint presentation, titled Dashboard For Service Subscription Numbers Assessment Professional PDF, with topics curated by our researchers after extensive research. This editable presentation is available for immediate download and provides attractive features when used. Download now and captivate your audience. Presenting this Dashboard For Service Subscription Numbers Assessment Professional PDF. Our researchers have carefully researched and created these slides with all aspects taken into consideration. This is a completely customizable Dashboard For Service Subscription Numbers Assessment Professional PDF that is available for immediate downloading. Download now and make an impact on your audience. Highlight the attractive features available with our PPTs.

B2B Lead Marketing Funnel Dashboard Ppt Model Slides PDF
This slide covers the marketing dashboard wherein the lead count is calculated based on media, events, emails, etc.Presenting B2B lead marketing funnel dashboard ppt model slides pdf. to provide visual cues and insights. Share and navigate important information on four stages that need your due attention. This template can be used to pitch topics like media, events, inbound. In addtion, this PPT design contains high resolution images, graphics, etc, that are easily editable and available for immediate download.

B2B Lead Marketing Funnel Dashboard Ppt Styles Ideas PDF
This slide covers the marketing dashboard wherein the lead count is calculated based on media, events, emails, etc.Presenting B2B lead marketing funnel dashboard ppt styles ideas pdf. to provide visual cues and insights. Share and navigate important information on four stages that need your due attention. This template can be used to pitch topics like media, events, inbound. In addtion, this PPT design contains high resolution images, graphics, etc, that are easily editable and available for immediate download.

Financial Dashboard To Evaluate Internal Rate Of Return Microsoft PDF
This slide showcases dashboard that can help organization to calculate the internal rate of return on invested capital. Company can use it to communicate the return on investment to investors. Deliver an awe inspiring pitch with this creative Financial Dashboard To Evaluate Internal Rate Of Return Microsoft PDF bundle. Topics like Invested, Equity, Debt can be discussed with this completely editable template. It is available for immediate download depending on the needs and requirements of the user.

Accelerate Online Journey Now Business Transformation Dashboard Background PDF
This slide covers transformation dashboard covering various stages of a business along with the budget and risks involved at every stage.Deliver and pitch your topic in the best possible manner with this Accelerate Online Journey Now Business Transformation Dashboard Background PDF Use them to share invaluable insights on Mobilization Resources, Stakeholders Availability, Uncertain Timeline and impress your audience. This template can be altered and modified as per your expectations. So, grab it now.
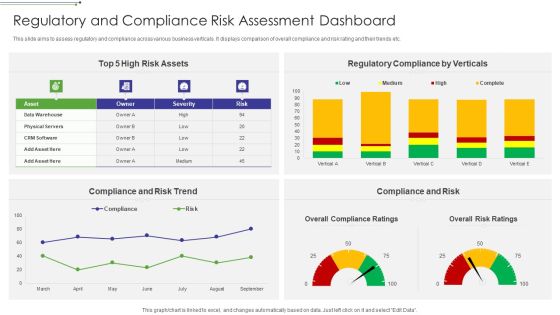
Regulatory And Compliance Risk Assessment Dashboard Designs PDF
This slide aims to assess regulatory and compliance across various business verticals. It displays comparison of overall compliance and risk rating and their trends etc.Pitch your topic with ease and precision using this Regulatory And Compliance Risk Assessment Dashboard Designs PDF This layout presents information on Risk Assets, Regulatory Compliance By Verticals, Compliance And Risk Trend It is also available for immediate download and adjustment. So, changes can be made in the color, design, graphics or any other component to create a unique layout.

Comprehensive Business Digitization Deck Business Transformation Dashboard Sample PDF
This slide covers transformation dashboard covering various stages of a business along with the budget and risks involved at every stage. Deliver and pitch your topic in the best possible manner with this comprehensive business digitization deck business transformation dashboard sample pdf. Use them to share invaluable insights on discovery or visioning, plan, design, execute, monitor and impress your audience. This template can be altered and modified as per your expectations. So, grab it now.

Reshaping Business In Digital Business Transformation Dashboard Formats PDF
This slide covers transformation dashboard covering various stages of a business along with the budget and risks involved at every stage. Deliver an awe inspiring pitch with this creative Reshaping Business In Digital Business Transformation Dashboard Formats PDF bundle. Topics like Plan, Design, Execute, Monitor can be discussed with this completely editable template. It is available for immediate download depending on the needs and requirements of the user.

Actual And Forecasted Income And Expenses Analysis Dashboard Portrait PDF
This slide shows the dashboard representing the comparison between the actual and forecasted monthly income and expenses of an organization. It also shows the report overview of monthly income and expenses of organization. Showcasing this set of slides titled Actual And Forecasted Income And Expenses Analysis Dashboard Portrait PDF. The topics addressed in these templates are Expenses, Income, Expenses. All the content presented in this PPT design is completely editable. Download it and make adjustments in color, background, font etc. as per your unique business setting.

Cyber Security Incident Response KPI Dashboard Microsoft PDF
This slide represents dashboard showing the key metrics of cyber security incident response. It includes key performance indicators such as risk score, compliance status, threat level etc. Slidegeeks has constructed Cyber Security Incident Response KPI Dashboard Microsoft PDF after conducting extensive research and examination. These presentation templates are constantly being generated and modified based on user preferences and critiques from editors. Here, you will find the most attractive templates for a range of purposes while taking into account ratings and remarks from users regarding the content. This is an excellent jumping off point to explore our content and will give new users an insight into our top notch PowerPoint Templates.
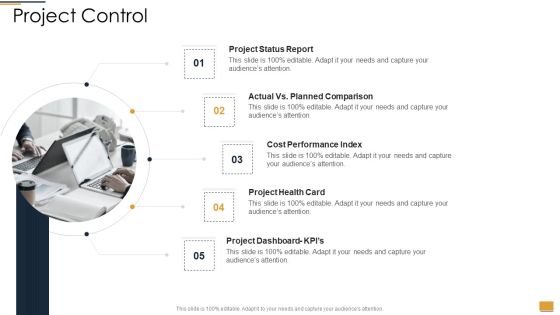
Project Ideation And Administration Project Control Ppt Inspiration Smartart PDF
This is a project ideation and administration project control ppt inspiration smartart pdf template with various stages. Focus and dispense information on five stages using this creative set, that comes with editable features. It contains large content boxes to add your information on topics like cost performance index, project dashboard, actual vs planned comparison. You can also showcase facts, figures, and other relevant content using this PPT layout. Grab it now.
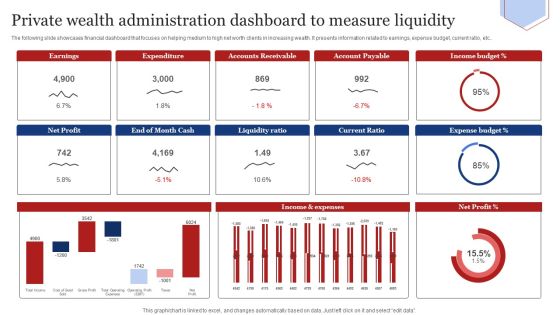
Private Wealth Administration Dashboard To Measure Liquidity Infographics PDF
The following slide showcases financial dashboard that focuses on helping medium to high net worth clients in increasing wealth. It presents information related to earnings, expense budget, current ratio, etc. Showcasing this set of slides titled Private Wealth Administration Dashboard To Measure Liquidity Infographics PDF. The topics addressed in these templates are Liquidity Ratio, Current Ratio, Expense Budget. All the content presented in this PPT design is completely editable. Download it and make adjustments in color, background, font etc. as per your unique business setting.
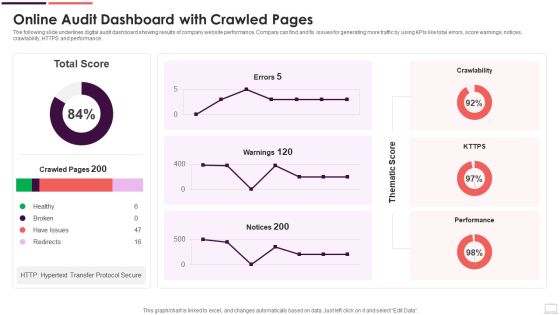
Online Audit Dashboard With Crawled Pages Background PDF
The following slide underlines digital audit dashboard showing results of company website performance. Company can find and fix issues for generating more traffic by using KPIs like total errors, score warnings, notices, crawlability, HTTPS and performance. Showcasing this set of slides titled Online Audit Dashboard With Crawled Pages Background PDF. The topics addressed in these templates are Redirects, Have Issues, Healthy. All the content presented in this PPT design is completely editable. Download it and make adjustments in color, background, font etc. as per your unique business setting.

Production Metric Dashboard For Equipment Performance Measurement Slides PDF
This slide represents lean manufacturing dashboard for performance measurement. It covers equipment status timeline, downtime etc Want to ace your presentation in front of a live audience Our Production Metric Dashboard For Equipment Performance Measurement Slides PDF can help you do that by engaging all the users towards you. Slidegeeks experts have put their efforts and expertise into creating these impeccable powerpoint presentations so that you can communicate your ideas clearly. Moreover, all the templates are customizable, and easy to edit and downloadable. Use these for both personal and commercial use.

Sales Monitoring Dashboard With Monthly Qualified Leads Guidelines PDF
This slide showcases dashboard that can help organization to monitor the sales pipeline velocity and predict future sales more accurately plus increase the leads converted. Its key components are monthly qualified leads, win rate based on deal size, monthly sales cycle and number of leads at each stage of pipeline. Pitch your topic with ease and precision using this Sales Monitoring Dashboard With Monthly Qualified Leads Guidelines PDF. This layout presents information on Monthly Qualified, Monthly Sales Cycle, Deal Size. It is also available for immediate download and adjustment. So, changes can be made in the color, design, graphics or any other component to create a unique layout.
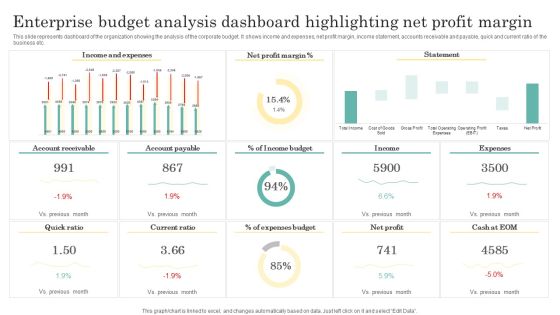
Enterprise Budget Analysis Dashboard Highlighting Net Profit Margin Clipart PDF
This slide represents dashboard of the organization showing the analysis of the corporate budget. It shows income and expenses, net profit margin, income statement, accounts receivable and payable, quick and current ratio of the business etc. Showcasing this set of slides titled Enterprise Budget Analysis Dashboard Highlighting Net Profit Margin Clipart PDF. The topics addressed in these templates are Income And Expenses, Net Profit Margin, Income Budget. All the content presented in this PPT design is completely editable. Download it and make adjustments in color, background, font etc. as per your unique business setting.

Risk Assessment Dashboard For Securing Supply Chain System Graphics PDF
This slide demonstrates risk assessment matrix for improving the efficiency of industrial supply chain system. It includes supplier risks, service type and service health etc.Showcasing this set of slides titled Risk Assessment Dashboard For Securing Supply Chain System Graphics PDF The topics addressed in these templates are Operation Compliance, Privacy Compilation, External Score All the content presented in this PPT design is completely editable. Download it and make adjustments in color, background, font etc. as per your unique business setting.

Dashboard For Tracking Impact Of Procurement Process Automation Inspiration PDF
This slide covers the dashboard for analysing procurement performance after automation. It include KPIs such as on-time delivery, percentage of returns, compliance index percentage, procurement ROI, cost-saving, budget spent on training, etc. Here you can discover an assortment of the finest PowerPoint and Google Slides templates. With these templates, you can create presentations for a variety of purposes while simultaneously providing your audience with an eye catching visual experience. Download Dashboard For Tracking Impact Of Procurement Process Automation Inspiration PDF to deliver an impeccable presentation. These templates will make your job of preparing presentations much quicker, yet still, maintain a high level of quality. Slidegeeks has experienced researchers who prepare these templates and write high quality content for you. Later on, you can personalize the content by editing the Dashboard For Tracking Impact Of Procurement Process Automation Inspiration PDF.

Maintenance KPI Dashboard With Work Orders Ppt Gallery Model PDF
This slide focuses on maintenance dashboard which covers percentage of delayed start, finish, man hours actual versus estimate and work type such as preventive maintenance, calibration, corrective and emergency maintenance. Showcasing this set of slides titled Maintenance KPI Dashboard With Work Orders Ppt Gallery Model PDF. The topics addressed in these templates are Preventive Maintenance Callibration, Man Hours Actual, Delayed Finish Percent. All the content presented in this PPT design is completely editable. Download it and make adjustments in color, background, font etc. as per your unique business setting.

Accounting KPI Dashboard To Control System Financial Performance Formats PDF
The following slide showcases model for enabling control of accounts. It presents information related to long term planning, investment plans, profit estimated, etc. Pitch your topic with ease and precision using this Accounting KPI Dashboard To Control System Financial Performance Formats PDF. This layout presents information on Sales Outstanding, Payable Outstanding, Sales Inventory. It is also available for immediate download and adjustment. So, changes can be made in the color, design, graphics or any other component to create a unique layout.

Continuous Process Improvement KPI Dashboard For IT Industry Clipart PDF
Following slide depicts the IT industry KPI dashboard which will assist in generating more of profit by improving strategic plan according to changing environment with clients preferences .The KPI mentioned in a slide are such as risk analysis, outstanding task , upcoming task, budget analysis, etc. Pitch your topic with ease and precision using this Continuous Process Improvement KPI Dashboard For IT Industry Clipart PDF. This layout presents information on Overall Progress, Risk Analysis, Budget Analysis. It is also available for immediate download and adjustment. So, changes can be made in the color, design, graphics or any other component to create a unique layout.

Dashboard To Track Employee Training Program Slides PDF
This slide showcases dashboard that can help organization to track on job training program. Its key components are training number, training status, budget, duration, training type and number of trainees. Want to ace your presentation in front of a live audience Our Dashboard To Track Employee Training Program Slides PDF can help you do that by engaging all the users towards you. Slidegeeks experts have put their efforts and expertise into creating these impeccable powerpoint presentations so that you can communicate your ideas clearly. Moreover, all the templates are customizable, and easy to edit and downloadable. Use these for both personal and commercial use.
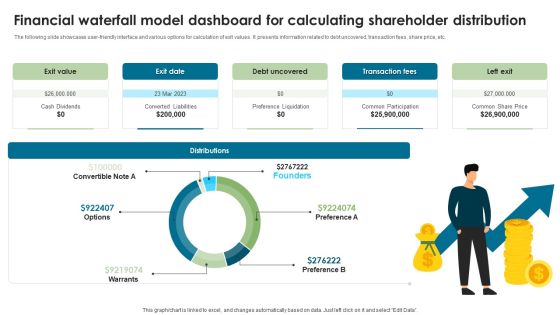
Financial Waterfall Model Dashboard For Calculating Shareholder Distribution Slides PDF
The following slide showcases user-friendly interface and various options for calculation of exit values. It presents information related to debt uncovered, transaction fees, share price, etc. Showcasing this set of slides titled Financial Waterfall Model Dashboard For Calculating Shareholder Distribution Slides PDF. The topics addressed in these templates are Exit Value, Exit Date, Debt Uncovered. All the content presented in this PPT design is completely editable. Download it and make adjustments in color, background, font etc. as per your unique business setting.
 Home
Home