AI PPT Maker
Templates
PPT Bundles
Design Services
Business PPTs
Business Plan
Management
Strategy
Introduction PPT
Roadmap
Self Introduction
Timelines
Process
Marketing
Agenda
Technology
Medical
Startup Business Plan
Cyber Security
Dashboards
SWOT
Proposals
Education
Pitch Deck
Digital Marketing
KPIs
Project Management
Product Management
Artificial Intelligence
Target Market
Communication
Supply Chain
Google Slides
Research Services
 One Pagers
All Categories
-
Home
- Customer Favorites
- Project Kpi
Project Kpi

Data Analytics Value Stream Chain Business Analysis Modification Toolkit Summary PDF
This slide illustrates the series of activities required for analyzing the data. It contains information such as data preparation, exploratory analysis, and predictive analytics etc.This is a Data Analytics Value Stream Chain Business Analysis Modification Toolkit Summary PDF template with various stages. Focus and dispense information on six stages using this creative set, that comes with editable features. It contains large content boxes to add your information on topics like Formulate Business, Data Visualization, Classification Clustering. You can also showcase facts, figures, and other relevant content using this PPT layout. Grab it now.

Top 10 Revolutionary Solutions For Everything How Does Diffusion Model Operate While Predicting System Behavior Introduction PDF
This slide provides information regarding diffusion model that assesses and predicts system behavior and generated similar data on which it was trained. The diffusion models are integrated with AI to ensure noise removal and offer high quality images from random seeds. Formulating a presentation can take up a lot of effort and time, so the content and message should always be the primary focus. The visuals of the PowerPoint can enhance the presenters message, so our Top 10 Revolutionary Solutions For Everything How Does Diffusion Model Operate While Predicting System Behavior Introduction PDF was created to help save time. Instead of worrying about the design, the presenter can concentrate on the message while our designers work on creating the ideal templates for whatever situation is needed. Slidegeeks has experts for everything from amazing designs to valuable content, we have put everything into Top 10 Revolutionary Solutions For Everything How Does Diffusion Model Operate While Predicting System Behavior Introduction PDF

Channel Sales Performance Graph Ppt Slide Examples
This is a channel sales performance graph ppt slide examples. This is a four stage process. The stages in this process are jan, feb, mar, apr, may, jun, jul, aug, sep.

Overview Of Key Findings Ppt PowerPoint Presentation Complete Deck With Slides
Presenting this set of slides with name overview of key findings ppt powerpoint presentation complete deck with slides. The topics discussed in these slides are overview, key findings, agenda, marketing, business. This is a completely editable PowerPoint presentation and is available for immediate download. Download now and impress your audience.
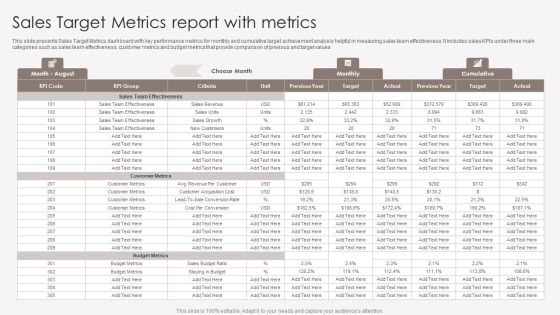
Sales Target Metrics Report With Metrics Introduction PDF
This slide presents Sales Target Metrics dashboard with key performance metrics for monthly and cumulative target achievement analysis helpful in measuring sales team effectiveness. It includes sales KPIs under three main categories such as sales team effectiveness, customer metrics and budget metrics that provide comparison of previous and target values. Pitch your topic with ease and precision using this Sales Target Metrics Report With Metrics Introduction PDF. This layout presents information on Sales Team Effectiveness, Customer Metrics, Budget Metrics. It is also available for immediate download and adjustment. So, changes can be made in the color, design, graphics or any other component to create a unique layout.
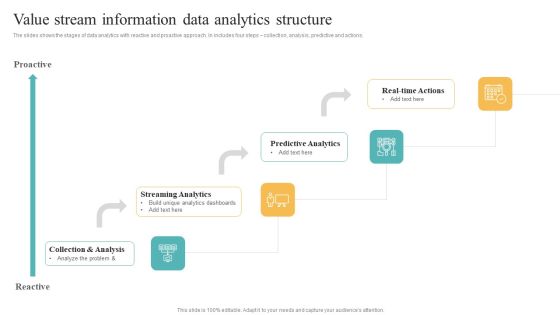
Transformation Toolkit Competitive Intelligence Information Analysis Value Stream Information Data Analytics Structure Infographics PDF
The slides shows the stages of data analytics with reactive and proactive approach. In includes four steps collection, analysis, predictive and actions. Present like a pro with Transformation Toolkit Competitive Intelligence Information Analysis Value Stream Information Data Analytics Structure Infographics PDF Create beautiful presentations together with your team, using our easy to use presentation slides. Share your ideas in real time and make changes on the fly by downloading our templates. So whether you are in the office, on the go, or in a remote location, you can stay in sync with your team and present your ideas with confidence. With Slidegeeks presentation got a whole lot easier. Grab these presentations today.

Due Diligence For M And A Analysis Icon Ppt Inspiration Graphic Images PDF
Persuade your audience using this Due Diligence For M And A Analysis Icon Ppt Inspiration Graphic Images PDF. This PPT design covers three stages, thus making it a great tool to use. It also caters to a variety of topics including Due Diligence, M And A, Analysis Icon. Download this PPT design now to present a convincing pitch that not only emphasizes the topic but also showcases your presentation skills.
System Analysis And Design Running On Browser Icon Ppt Styles Images PDF
Persuade your audience using this System Analysis And Design Running On Browser Icon Ppt Styles Images PDF. This PPT design covers three stages, thus making it a great tool to use. It also caters to a variety of topics including System, Analysis And Design, Running Browser Icon. Download this PPT design now to present a convincing pitch that not only emphasizes the topic but also showcases your presentation skills.

Data Automation Procedure Flow For Integrating Platform Ppt PowerPoint Presentation Infographic Template Vector PDF
This slide represents data automation process flow for integration platform which contains user interface and control, identify and extract, calculation, documentation, analyzing and reporting. It can be referred by IT teams to streamlining the processing methods and bring efficiency.Pitch your topic with ease and precision using this Data Automation Procedure Flow For Integrating Platform Ppt PowerPoint Presentation Infographic Template Vector PDF. This layout presents information on Recognizing Device, Component Recognition, Documentation Analyzing. It is also available for immediate download and adjustment. So, changes can be made in the color, design, graphics or any other component to create a unique layout.

Data Quality Management System With Cleaning Strategy Ppt PowerPoint Presentation File Files PDF
Presenting data quality management system with cleaning strategy ppt powerpoint presentation file files pdf to dispense important information. This template comprises four stages. It also presents valuable insights into the topics including assessment, cleaning strategy, develop data analysis metrics. This is a completely customizable PowerPoint theme that can be put to use immediately. So, download it and address the topic impactfully.

Benefits Of Predictive Analytics Cost Reduction Ppt PowerPoint Presentation Styles Sample
Presenting this set of slides with name benefits of predictive analytics cost reduction ppt powerpoint presentation styles sample. This is a three stage process. The stages in this process are big data analysis, data management, technologies segmentation. This is a completely editable PowerPoint presentation and is available for immediate download. Download now and impress your audience.

Guidebook For Executing Business Market Intelligence Description Of Conjoint Analysis As Data Professional PDF
The following slide provides an overview of conjoint analysis for analyzing data in market intelligence to compare various attributes and determine its value. It also highlights its benefits which are brand equity, market segmentation, price sensitivity and attribute interaction calculation. Create an editable Guidebook For Executing Business Market Intelligence Description Of Conjoint Analysis As Data Professional PDF that communicates your idea and engages your audience. Whether you are presenting a business or an educational presentation, pre designed presentation templates help save time. Guidebook For Executing Business Market Intelligence Description Of Conjoint Analysis As Data Professional PDF is highly customizable and very easy to edit, covering many different styles from creative to business presentations. Slidegeeks has creative team members who have crafted amazing templates. So, go and get them without any delay.
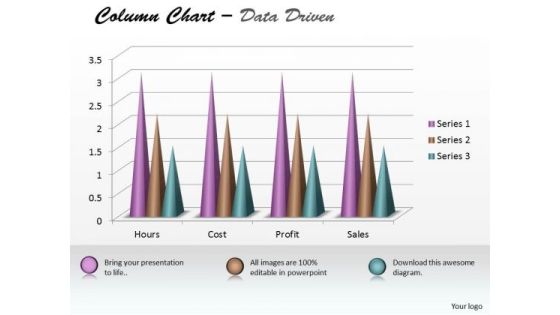
Excel Data Analysis Data Tools Data Methods Statistical Tool Survey Chart PowerPoint Templates
Analyze Ailments On Our excel data analysis data tools data methods statistical tool survey chart Powerpoint Templates . Bring Out The Thinking Doctor In You. Dock Your Thoughts With Our Excel Data Analysis . They Will Launch Them Into Orbit.

AI Logistics Management Automated Framework Themes PDF
The purpose of this slide is to showcase an automated workflow that compiles logistics data and forecasts operational outcomes by running different scenarios. Key components include plan, serve, source, deliver and make. Pitch your topic with ease and precision using this AI Logistics Management Automated Framework Themes PDF. This layout presents information on Demand Forecasting, Risk Analysis, Budget Analysis. It is also available for immediate download and adjustment. So, changes can be made in the color, design, graphics or any other component to create a unique layout.
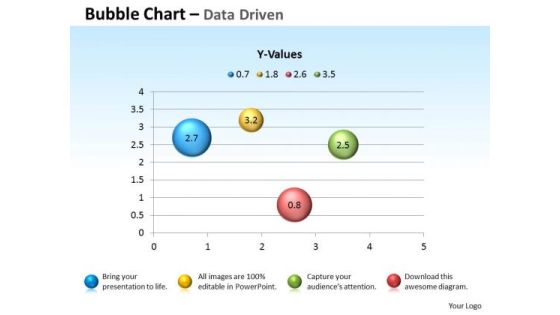
Excel Data Analysis Data Tools Data Methods Statistical Chart For Process PowerPoint Templates
Blend Your Views With Our excel data analysis data tools data methods statistical chart for process Powerpoint Templates . They Are Made For Each Other.

Excel Data Analysis Data Tools Data Methods Statistical Driven PowerPoint Slides Templates
There Is No Subject Too Dull For Our excel data analysis data tools data methods statistical driven powerpoint slides Templates . They Will Always Generate Keenness.
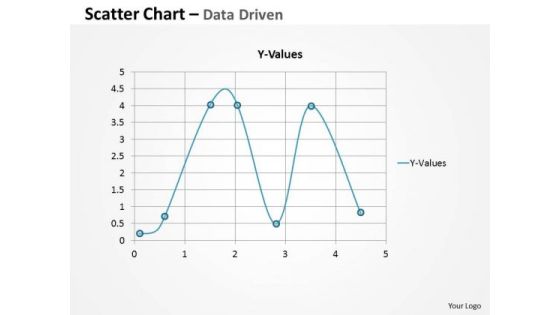
Excel Data Analysis Data Tools Data Methods Statistical Survey Driven PowerPoint Slides Templates
Ask For Assistance From Our excel data analysis data tools data methods statistical survey driven powerpoint slides Templates . You Will Be Duly Satisfied.
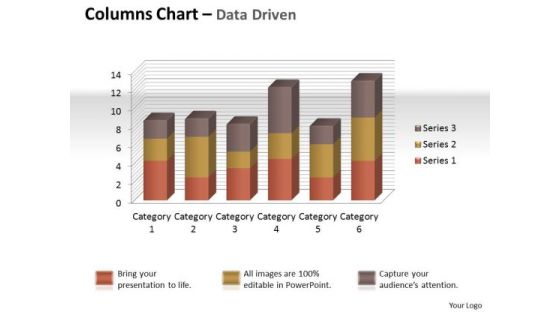
Excel Data Analysis Data Tools Data Methods Statistical Tool Chart PowerPoint Templates
Give Your Thoughts Some Durability. Coat Them With Our excel data analysis data tools data methods statistical tool chart Powerpoint Templates .
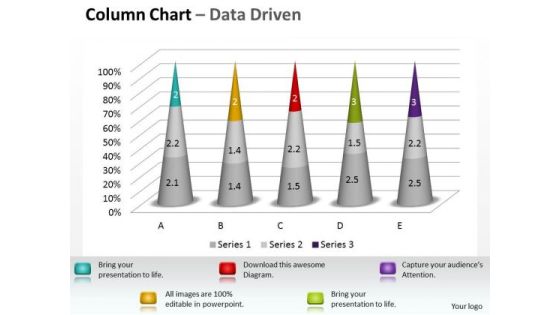
Excel Data Analysis Data Tools Data Methods Statistical Tool Survey 3d Chart PowerPoint Templates
Dumbfound Them With Our excel data analysis data tools data methods statistical tool survey 3d chart Powerpoint Templates . Your Audience Will Be Astounded With Your Ideas.

Excel Data Analysis Data Tools Data Methods Statistical Tool Survey PowerPoint Slides Templates
Get Out Of The Dock With Our excel data analysis data tools data methods statistical tool survey powerpoint slides Templates . Your Mind Will Be Set Free.

6 Step Process For Creating Data Driven Organizational Culture Background PDF
Presenting 6 step process for creating data driven organizational culture background pdf to dispense important information. This template comprises six stages. It also presents valuable insights into the topics including metrics, analysis, information. This is a completely customizable PowerPoint theme that can be put to use immediately. So, download it and address the topic impactfully.

Data Assimilation Advanced Analytics Techniques Ppt Ideas Good PDF
This is a data assimilation advanced analytics techniques ppt ideas good pdf template with various stages. Focus and dispense information on three stages using this creative set, that comes with editable features. It contains large content boxes to add your information on topics like descriptive analytics, predictive analytics, prescriptive analytics. You can also showcase facts, figures, and other relevant content using this PPT layout. Grab it now.
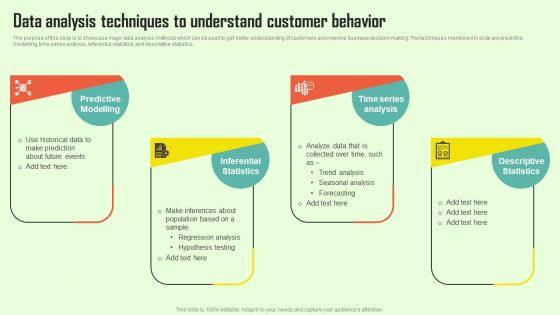
Increasing Consumer Engagement With Database Data Analysis Techniques To Understand Structure PDF
The purpose of this slide is to showcase major data analysis methods which can be used to get better understanding of customers and improve business decision making. The techniques mentioned in slide are predictive modelling, time series analysis, inferential statistics, and descriptive statistics. Want to ace your presentation in front of a live audience Our Increasing Consumer Engagement With Database Data Analysis Techniques To Understand Structure PDF can help you do that by engaging all the users towards you. Slidegeeks experts have put their efforts and expertise into creating these impeccable powerpoint presentations so that you can communicate your ideas clearly. Moreover, all the templates are customizable, and easy to edit and downloadable. Use these for both personal and commercial use.
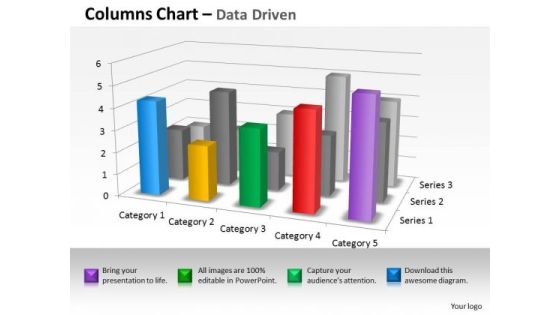
Quantitative Data Analysis 3d Interpretation Of Statistical Quality Control PowerPoint Templates
Land The Idea With Our quantitative data analysis 3d interpretation of statistical quality control Powerpoint Templates . Help It Grow With Your Thoughts.

Bar Graph For Market Analysis Ppt Samples Download
This is a bar graph for market analysis ppt samples download. This is a four stage process. The stages in this process are category.

Supplier Management For Enhanced SCM And Procurement Vendor Risk Management Process Flow Themes PDF
The following slide illustrates vendor risk management process flow. It provides information about identify outcomes, data to insight, continuous improvement, execution practices, identify metrics, etc. Deliver and pitch your topic in the best possible manner with this Supplier Management For Enhanced SCM And Procurement Vendor Risk Management Process Flow Themes PDF. Use them to share invaluable insights on Continuous Improvement, Identify Outcomes, Identify Metrics and impress your audience. This template can be altered and modified as per your expectations. So, grab it now.

Vendor Management To Handle Purchase Vendor Risk Management Process Flow Structure PDF
The following slide illustrates vendor risk management process flow. It provides information about identify outcomes, data to insight, continuous improvement, execution practices, identify metrics, etc. Deliver and pitch your topic in the best possible manner with this Vendor Management To Handle Purchase Vendor Risk Management Process Flow Structure PDF. Use them to share invaluable insights on Identify Outcomes, Identify Metrics, Continuous Improvement and impress your audience. This template can be altered and modified as per your expectations. So, grab it now.
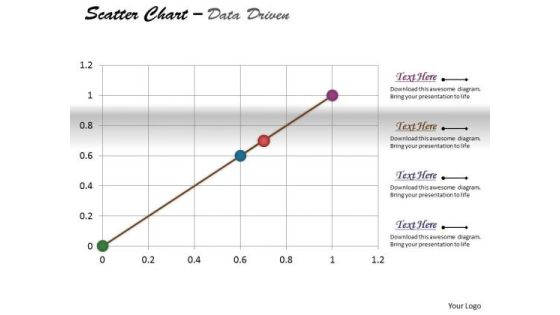
Excel Data Analysis Data Methods Statistical Tool Survey Driven PowerPoint Slides Templates
Be The Duke Of The Dais With Our excel data analysis data methods statistical tool survey driven powerpoint slides Templates . Acquire Royalty Status With Your Thoughts.

Big Data Technology For Real Estate Management Elements PDF
The slide showcases the key areas, big data technology in property management is used to drive Proptech disruption and efficiency of running a business. It covers better analytics, precise property evaluations, improved home prospecting and marketing, data-driven property development and digitalization of back-office processes. Presenting Big Data Technology For Real Estate Management Elements PDF to dispense important information. This template comprises five stages. It also presents valuable insights into the topics including Precise Property Evaluation, Performs Predictive Analysis, Development Opportunities. This is a completely customizable PowerPoint theme that can be put to use immediately. So, download it and address the topic impactfully.

Data Driven Insurance Sales Procedure Boosting Revenue Sample PDF
The following slide highlights insurance sales cycle based on data for predictive analysis and real-time insights. It boost company sales. It includes components such as integrate front and back office, customer centric sales and improve renewal rates. Persuade your audience using this Data Driven Insurance Sales Procedure Boosting Revenue Sample PDF. This PPT design covers three stages, thus making it a great tool to use. It also caters to a variety of topics including Customer Centric Sales, Improve Renewal Rates, Revenue. Download this PPT design now to present a convincing pitch that not only emphasizes the topic but also showcases your presentation skills

Transformation Toolkit Competitive Intelligence Information Analysis Data Analytics Value Stream Chain Portrait PDF
This slide illustrates the series of activities required for analyzing the data. It contains information such as data preparation, exploratory analysis, and predictive analytics etc. Find highly impressive Transformation Toolkit Competitive Intelligence Information Analysis Data Analytics Value Stream Chain Portrait PDF on Slidegeeks to deliver a meaningful presentation. You can save an ample amount of time using these presentation templates. No need to worry to prepare everything from scratch because Slidegeeks experts have already done a huge research and work for you. You need to download Transformation Toolkit Competitive Intelligence Information Analysis Data Analytics Value Stream Chain Portrait PDF for your upcoming presentation. All the presentation templates are 100 percent editable and you can change the color and personalize the content accordingly. Download now.

Business Checklist For Financial Budget Allocation Within Departments Summary PDF
This slide represents the financial budget allocation checklist to evaluate department. It includes various question related to the strategies that are either implemented in an organisation for growth. Deliver an awe inspiring pitch with this creative Business Checklist For Financial Budget Allocation Within Departments Summary PDF bundle. Topics like Document Financial, Data Budget, Spreadsheet Develop can be discussed with this completely editable template. It is available for immediate download depending on the needs and requirements of the user.

Steps Of Continuous Process Business Improvement Action Plan Formats PDF
The slide covers various steps of continuous improvement plan to ensure enhancing customer satisfaction. Various steps included are define, measure, analyse and improve. Presenting Steps Of Continuous Process Business Improvement Action Plan Formats PDF to dispense important information. This template comprises Two stages. It also presents valuable insights into the topics including Comparison Metrics, Data Gathering, Cause And Effect. This is a completely customizable PowerPoint theme that can be put to use immediately. So, download it and address the topic impactfully.

Financial Development Analysis Ppt Ideas
This is a financial development analysis ppt ideas. This is a twelve stage process. The stages in this process are business infographic.

Big Data In Data Warehouse Ppt PowerPoint Presentation Infographic Template
This is a big data in data warehouse ppt powerpoint presentation infographic template. This is a one stage process. The stages in this process are business, data, marketing, analysis, strategy, management.

Transformation Toolkit Competitive Intelligence Information Analysis Data Analytics Software Features Template PDF
This slide represents the key features of predictive data analytics including data mining, data visualization, and modelling etc. Coming up with a presentation necessitates that the majority of the effort goes into the content and the message you intend to convey. The visuals of a PowerPoint presentation can only be effective if it supplements and supports the story that is being told. Keeping this in mind our experts created Transformation Toolkit Competitive Intelligence Information Analysis Data Analytics Software Features Template PDF to reduce the time that goes into designing the presentation. This way, you can concentrate on the message while our designers take care of providing you with the right template for the situation.

Dashboard Program Ppt Presentation Powerpoint
This is a dashboard program ppt presentation powerpoint. This is a six stage process. The stages in this process are tasks, progress, matrix, resource, utilization, time, safety, progress, sales rate.
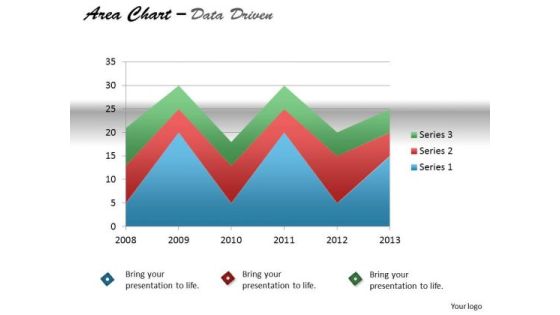
Quantitative Data Analysis Driven Display Series With Area Chart PowerPoint Slides Templates
Our quantitative data analysis driven display series with area chart powerpoint slides Templates Enjoy Drama. They Provide Entertaining Backdrops.

Financial Modelling Growth Reporting Workflow Formats PDF
This slide shows financial modelling report development workflow for forecasting the future ups and downs for business. It include steps such as considering historical data, analyzing historical performance and gathering future assumptions etc. Pitch your topic with ease and precision using this Financial Modelling Growth Reporting Workflow Formats PDF. This layout presents information on Forecast Financial Statements, Risk Assessment, Forecasting Assumptions. It is also available for immediate download and adjustment. So, changes can be made in the color, design, graphics or any other component to create a unique layout.

Global Integration Of Sales And Operations Process Professional PDF
This slide provides the sales and operations process of enterprises that are running their businesses on a global scale to assist them with the planning of their organizational functions. The key elements are month end data, inputs, corporate strategic plan, forecasted output and results . Showcasing this set of slides titled Global Integration Of Sales And Operations Process Professional PDF. The topics addressed in these templates are Corporate Strategic, Forecasted Output, Forecasted Statistics. All the content presented in this PPT design is completely editable. Download it and make adjustments in color, background, font etc. as per your unique business setting.

Competitive Environment Analysis Ppt Images
This is a competitive environment analysis ppt images. This is a four stage process. The stages in this process are engagement, brand, monthly, weekly, x, y.

Business Diagram Colored Column Chart For Result Analysis PowerPoint Slide
This Power Point diagram has been designed with graphic of column chart. It contains diagram of bar char depicting annual business progress report. Use this diagram to build professional presentations for your viewers.

Comprehensive Customer Data Platform Guide Optimizing Promotional Initiatives Perform Comparative Analysis Vendor Background PDF
The following slide showcases the comparative assessment of various vendors to gain better value and support. It includes elements such as predictive analysis, real time behavior, supports digital marketing, personalization, recommendations, loyalty management etc. Slidegeeks is one of the best resources for PowerPoint templates. You can download easily and regulate Comprehensive Customer Data Platform Guide Optimizing Promotional Initiatives Perform Comparative Analysis Vendor Background PDF for your personal presentations from our wonderful collection. A few clicks is all it takes to discover and get the most relevant and appropriate templates. Use our Templates to add a unique zing and appeal to your presentation and meetings. All the slides are easy to edit and you can use them even for advertisement purposes.
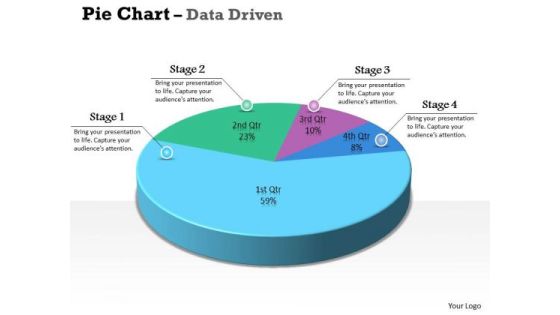
Data Analysis Excel 3d Pie Chart For Marketing Process PowerPoint Templates
Our data analysis excel 3d pie chart for marketing process Powerpoint Templates Team Are A Dogged Lot. They Keep At It Till They Get It Right.
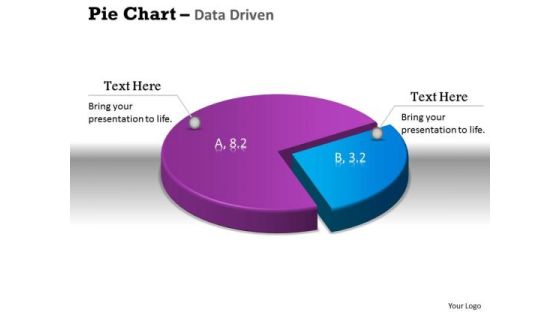
Data Analysis Excel 3d Pie Chart Shows Relative Size Of PowerPoint Templates
Get The Doers Into Action. Activate Them With Our data analysis excel 3d pie chart shows relative size of Powerpoint Templates.

Data Analysis Excel Driven Percentage Breakdown Pie Chart PowerPoint Slides Templates
Be A Donor Of Great Ideas. Display Your Charity On Our data analysis excel driven percentage breakdown pie chart powerpoint slides Templates.

Data Analysis Excel Driven Pie Chart For Business Stratregy PowerPoint Slides Templates
Open Up Doors That Lead To Success. Our data analysis excel driven pie chart for business stratregy powerpoint slides Templates Provide The Handles.
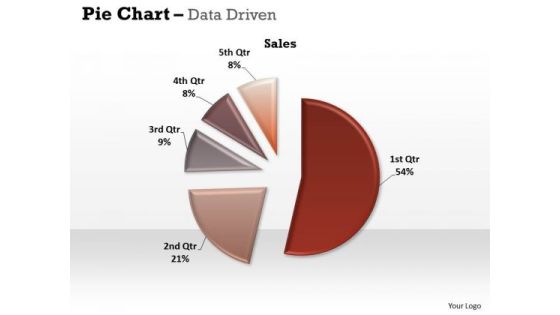
Data Analysis Excel Driven Pie Chart For Easy Comparison PowerPoint Slides Templates
Our data analysis excel driven pie chart for easy comparison powerpoint slides Templates Abhor Doodling. They Never Let The Interest Flag.
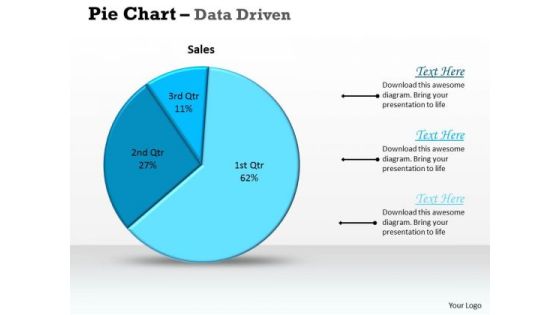
Data Analysis Excel Driven Pie Chart For Sales Process PowerPoint Slides Templates
Deliver The Right Dose With Our data analysis excel driven pie chart for sales process powerpoint slides Templates . Your Ideas Will Get The Correct Illumination.
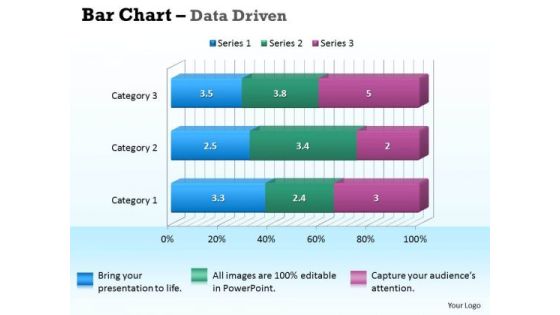
Data Analysis In Excel 3d Bar Chart For Business Information PowerPoint Templates
Our data analysis in excel 3d bar chart for business information Powerpoint Templates Deliver At Your Doorstep. Let Them In For A Wonderful Experience.
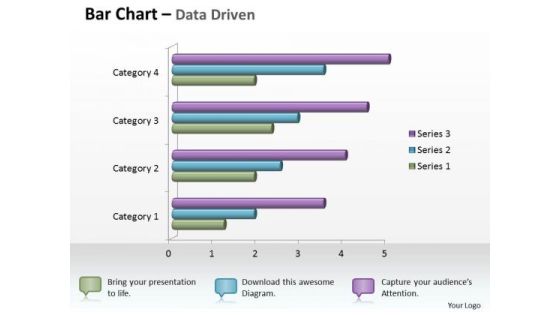
Data Analysis In Excel 3d Bar Chart For Business Statistics PowerPoint Templates
Knock On The Door To Success With Our data analysis in excel 3d bar chart for business statistics Powerpoint Templates . Be Assured Of Gaining Entry.

Data Analysis In Excel 3d Bar Chart For Business Trends PowerPoint Templates
Connect The Dots With Our data analysis in excel 3d bar chart for business trends Powerpoint Templates . Watch The Whole Picture Clearly Emerge.

Data Analysis In Excel 3d Bar Chart For Comparison Of Time Series PowerPoint Templates
Double Your Chances With Our data analysis in excel 3d bar chart for comparison of time series Powerpoint Templates . The Value Of Your Thoughts Will Increase Two-Fold.
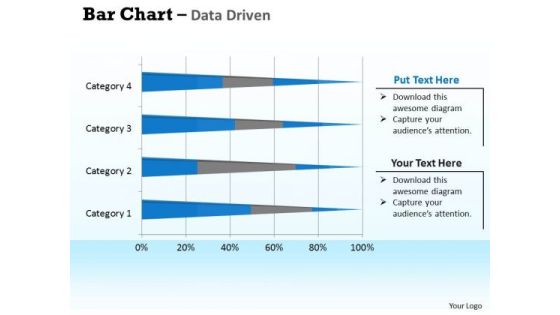
Data Analysis In Excel 3d Bar Chart For Interpretation PowerPoint Templates
Double Up Our data analysis in excel 3d bar chart for interpretation Powerpoint Templates With Your Thoughts. They Will Make An Awesome Pair.
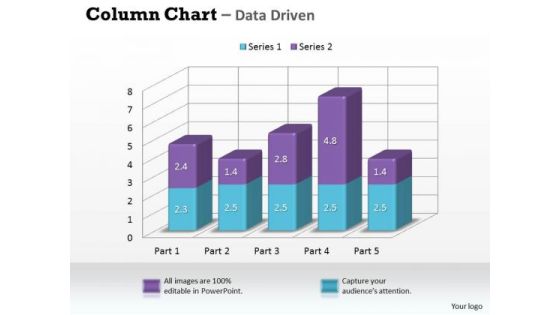
Data Analysis In Excel 3d Column Chart For Market Surveys PowerPoint Templates
Our data analysis in excel 3d column chart for market surveys Powerpoint Templates Leave No One In Doubt. Provide A Certainty To Your Views.

Data Analysis In Excel 3d Column Chart For Sets Of Information PowerPoint Templates
Double The Impact With Our data analysis in excel 3d column chart for sets of information Powerpoint Templates . Your Thoughts Will Have An Imposing Effect.
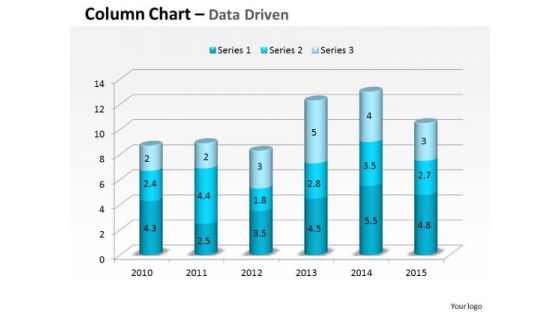
Data Analysis In Excel 3d Compare Yearly Business Performance PowerPoint Templates
Plan For All Contingencies With Our data analysis in excel 3d compare yearly business performance Powerpoint Templates . Douse The Fire Before It Catches.
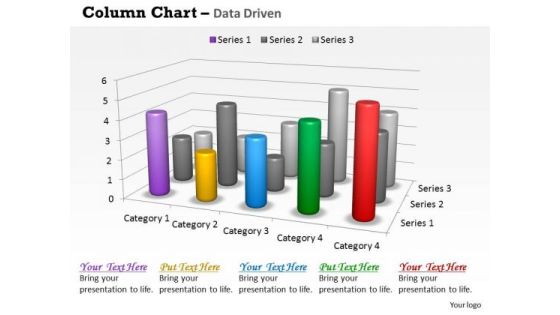
Data Analysis In Excel 3d Survey For Sales Chart PowerPoint Templates
Good Camaraderie Is A Key To Teamwork. Our data analysis in excel 3d survey for sales chart Powerpoint Templates Can Be A Cementing Force.
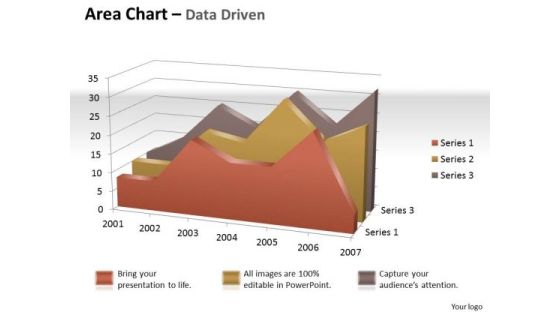
Data Analysis In Excel 3d Visual Display Of Area Chart PowerPoint Templates
Brace Yourself, Arm Your Thoughts. Prepare For The Hustle With Our data analysis in excel 3d visual display of area chart Powerpoint Templates .

Data Analysis In Excel Area Chart For Business Process PowerPoint Templates
Your Grasp Of Economics Is Well Known. Help Your Audience Comprehend Issues With Our data analysis in excel area chart for business process Powerpoint Templates .

Data Analysis In Excel Column Chart For Business Analytics PowerPoint Templates
Our data analysis in excel column chart for business analytics Powerpoint Templates Heighten Concentration. Your Audience Will Be On The Edge.

Data Analysis In Excel Column Chart Of Various Fields PowerPoint Templates
Land The Idea With Our data analysis in excel column chart of various fields Powerpoint Templates . Help It Grow With Your Thoughts.
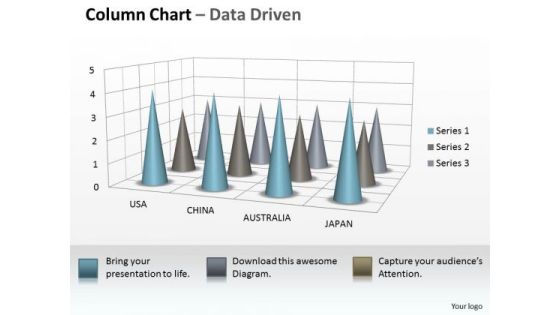
Data Analysis On Excel 3d Chart To Incorporate Business Information PowerPoint Templates
Our data analysis on excel 3d chart to incorporate business information Powerpoint Templates Allow You To Do It With Ease. Just Like Picking The Low Hanging Fruit.

Data Analysis On Excel 3d Chart To Monitor Business Process PowerPoint Templates
Make Some Dough With Our data analysis on excel 3d chart to monitor business process Powerpoint Templates . Your Assets Will Rise Significantly.
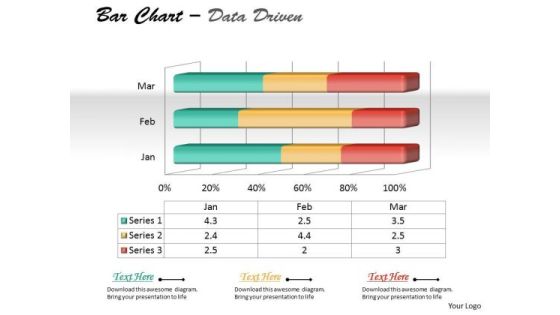
Data Analysis On Excel 3d Chart To Represent Quantitative Differences PowerPoint Templates
Draft It Out On Our data analysis on excel 3d chart to represent quantitative differences Powerpoint Templates . Give The Final Touches With Your Ideas.

Data Analysis On Excel 3d Chart With Sets Of PowerPoint Templates
Reduce The Drag With Our data analysis on excel 3d chart with sets of Powerpoint Templates . Give More Lift To Your Thoughts.

Data Analysis On Excel Driven Sets Of Business Information PowerPoint Slides Templates
Break The Deadlock With Our data analysis on excel driven sets of business information powerpoint slides Templates . Let The Words Start To Flow.

Data Analysis On Excel Driven Stacked Area Chart PowerPoint Slides Templates
Be The Dramatist With Our data analysis on excel driven stacked area chart powerpoint slides Templates . Script Out The Play Of Words.

Data Analysis On Excel Driven Stock Chart For Business Growth PowerPoint Slides Templates
Add Some Dramatization To Your Thoughts. Our data analysis on excel driven stock chart for business growth powerpoint slides Templates Make Useful Props.

Data Analysis Programs 3d Bar Chart For Market Surveys PowerPoint Templates
Draw On The Experience Of Our data analysis programs 3d bar chart for market surveys Powerpoint Templates . They Imbibe From Past Masters.
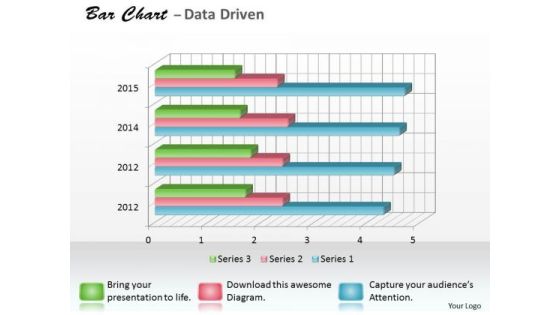
Data Analysis Programs 3d Bar Chart For Research In Statistics PowerPoint Templates
Draw It Out On Our data analysis programs 3d bar chart for research in statistics Powerpoint Templates . Provide Inspiration To Your Colleagues.
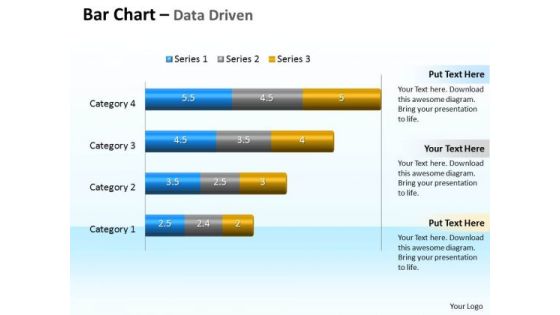
Data Analysis Programs 3d Bar Chart To Compare Categories PowerPoint Templates
Discover Decisive Moments With Our data analysis programs 3d bar chart to compare categories Powerpoint Templates . They Help Make That Crucial Difference.
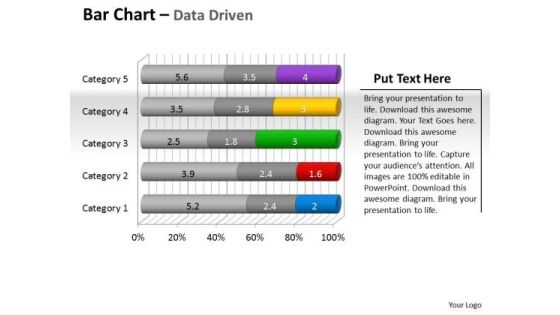
Data Analysis Programs 3d Bar Chart To Put Information PowerPoint Templates
Draw Up Your Agenda On Our data analysis programs 3d bar chart to put information Powerpoint Templates . Coax Your Audience Into Acceptance.
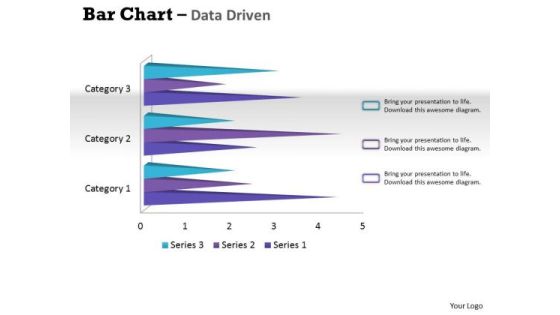
Data Analysis Techniques 3d Bar Chart For Financial Solutions PowerPoint Templates
Make Your Dreams A Reality With Our data analysis techniques 3d bar chart for financial solutions Powerpoint Templates . Your Ideas Will Begin To Take Shape.
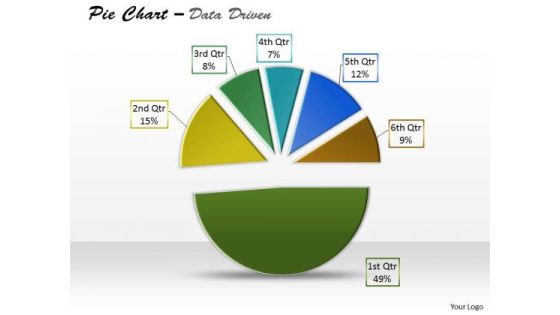
Data Analysis Template Driven Express Business Facts Pie Chart PowerPoint Slides Templates
Display Your Drive On Our data analysis template driven express business facts pie chart powerpoint slides Templates . Invigorate The Audience With Your Fervor.

Data Analysis Template Driven Ineract With Stock Chart PowerPoint Slides Templates
Drive Your Passion With Our data analysis template driven ineract with stock chart powerpoint slides Templates . Steer Yourself To Achieve Your Aims.

Data Analysis Template Driven Line Chart Business Graph PowerPoint Slides Templates
Bottle Your Thoughts In Our data analysis template driven line chart business graph powerpoint slides Templates . Pass It Around For Your Audience To Sip.
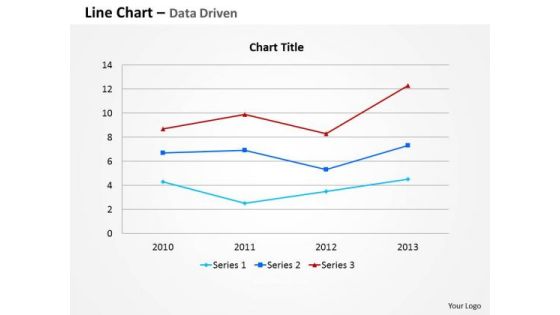
Data Analysis Template Driven Line Chart For Business Information PowerPoint Slides Templates
Your Thoughts Are Dripping With Wisdom. Lace It With Our data analysis template driven line chart for business information powerpoint slides Templates .
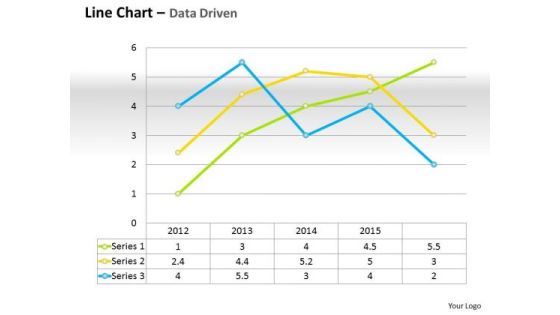
Data Analysis Template Driven Line Chart For Business Performance PowerPoint Slides Templates
Do Not Allow Things To Drift. Ring In Changes With Our data analysis template driven line chart for business performance powerpoint slides Templates .
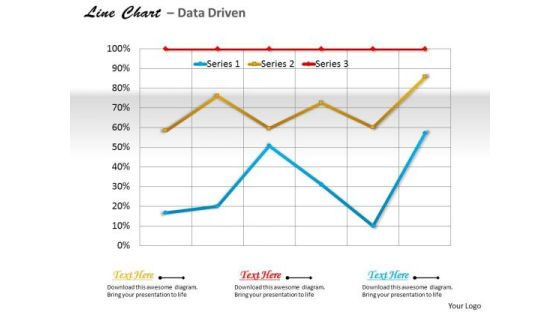
Data Analysis Template Driven Line Chart For Business Trends PowerPoint Slides Templates
Use Our data analysis template driven line chart for business trends powerpoint slides Templates As The Bit. Drill Your Thoughts Into Their Minds.

Data Analysis Template Driven Stock Chart For Market Trends PowerPoint Slides Templates
Drive Your Team Along The Road To Success. Take The Wheel With Our data analysis template driven stock chart for market trends powerpoint slides Templates .
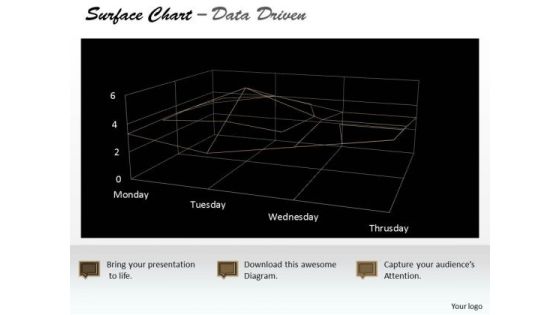
Data Analysis Template Driven Surface Chart Indicating Areas PowerPoint Slides Templates
Highlight Your Drive With Our data analysis template driven surface chart indicating areas powerpoint slides Templates . Prove The Fact That You Have Control.
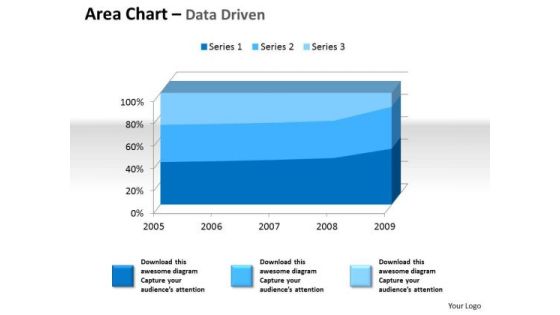
Examples Of Data Analysis Market 3d Area Chart For Quantiative PowerPoint Templates
Drum It Up With Our examples of data analysis market 3d area chart for quantiative Powerpoint Templates . Your Thoughts Will Raise The Tempo.
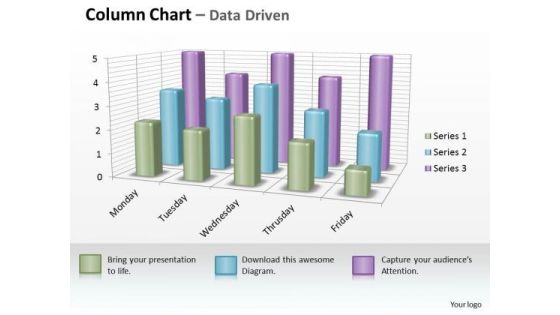
Examples Of Data Analysis Market 3d Business Inspection Procedure Chart PowerPoint Templates
However Dry Your Topic Maybe. Make It Catchy With Our examples of data analysis market 3d business inspection procedure chart Powerpoint Templates .

Examples Of Data Analysis Market 3d Business Intelligence And PowerPoint Templates
Our examples of data analysis market 3d business intelligence and Powerpoint Templates Are Dual Purpose. They Help Instruct And Inform At The Same Time.
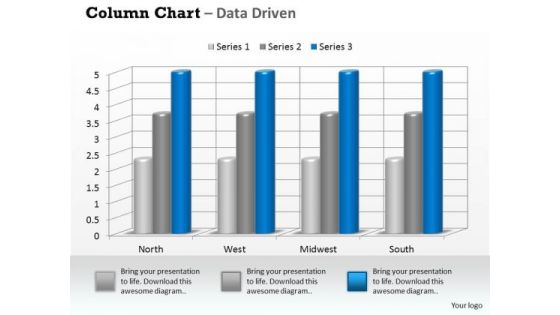
Examples Of Data Analysis Market 3d Business On Regular Intervals PowerPoint Templates
Drum It Out Loud And Clear On Our examples of data analysis market 3d business on regular intervals Powerpoint Templates . Your Words Will Ring In Their Ears.

Examples Of Data Analysis Market 3d Business Trend Series Chart PowerPoint Templates
Duct It Through With Our examples of data analysis market 3d business trend series chart Powerpoint Templates . Your Ideas Will Reach Into Their Minds Intact.

Examples Of Data Analysis Market Driven Plotting The Business Values PowerPoint Slides Templates
Ring The Duck With Our examples of data analysis market driven plotting the business values powerpoint slides Templates . Acquire The Points With Your Ideas.

Examples Of Data Analysis Market Driven Radar Chart To Compare PowerPoint Slides Templates
Rely On Our examples of data analysis market driven radar chart to compare powerpoint slides Templates In Any Duel. They Will Drive Home Your Point.
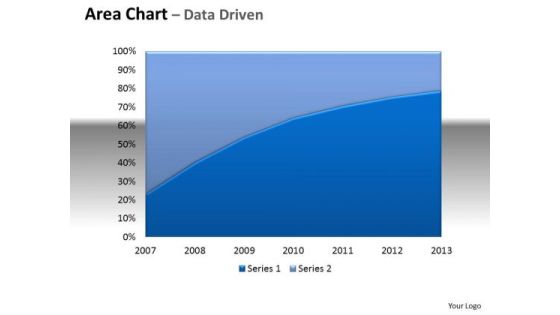
Financial Data Analysis Area Chart With Plotted Line Center PowerPoint Templates
Be The Doer With Our financial data analysis area chart with plotted line center Powerpoint Templates . Put Your Thoughts Into Practice.
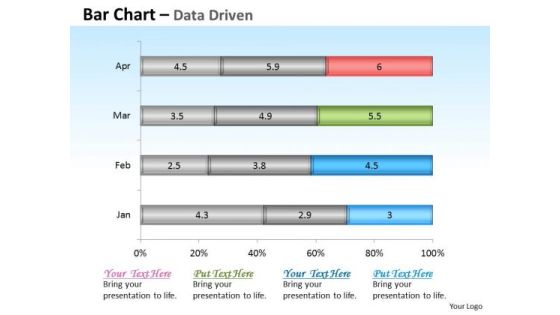
Financial Data Analysis Driven Base Bar Chart Design PowerPoint Slides Templates
Get The Domestics Right With Our financial data analysis driven base bar chart design powerpoint slides Templates . Create The Base For Thoughts To Grow.

Financial Data Analysis Driven Compare Market Share Of Brand PowerPoint Templates
Doll Up Your Thoughts With Our financial data analysis driven compare market share of brand Powerpoint Templates . They Will Make A Pretty Picture.
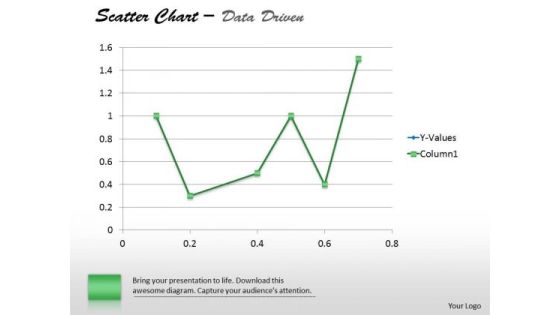
Financial Data Analysis Driven Demonstrate Statistics With Scatter Chart PowerPoint Slides Templates
Establish The Dominance Of Your Ideas. Our financial data analysis driven demonstrate statistics with scatter chart powerpoint slides Templates Will Put Them On Top.
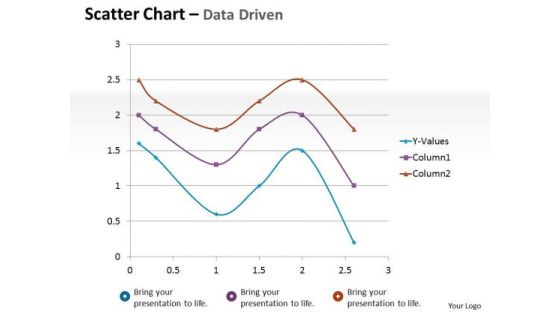
Financial Data Analysis Driven Scatter Chart Mathematical Diagram PowerPoint Slides Templates
Dominate Proceedings With Your Ideas. Our financial data analysis driven scatter chart mathematical diagram powerpoint slides Templates Will Empower Your Thoughts.
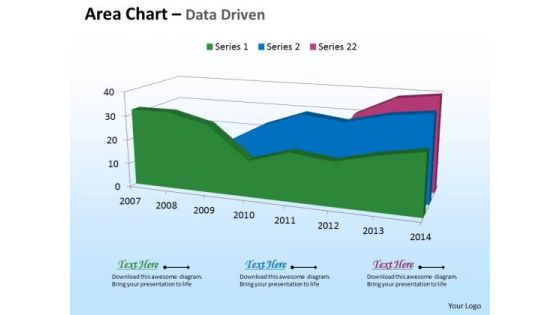
Microsoft Excel Data Analysis 3d Area Chart For Time Based PowerPoint Templates
Deliver The Right Dose With Our microsoft excel data analysis 3d area chart for time based Powerpoint Templates . Your Ideas Will Get The Correct Illumination.
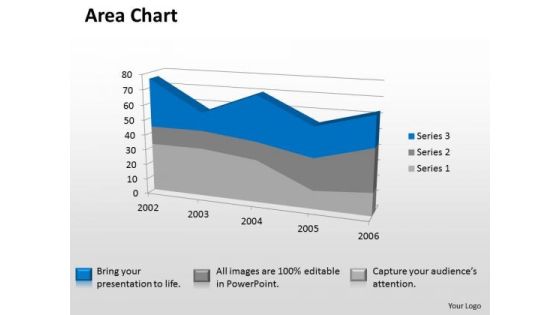
Microsoft Excel Data Analysis 3d Area Chart Showimg Change In Values PowerPoint Templates
Our microsoft excel data analysis 3d area chart showimg change in values Powerpoint Templates Deliver At Your Doorstep. Let Them In For A Wonderful Experience.
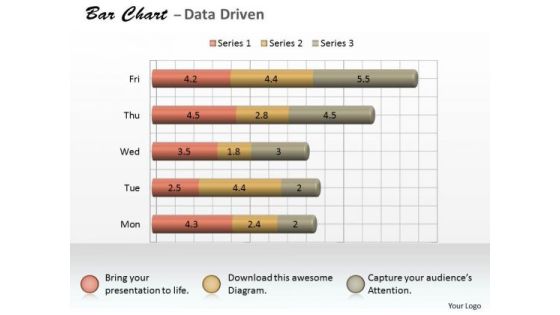
Microsoft Excel Data Analysis 3d Bar Chart As Research Tool PowerPoint Templates
Knock On The Door To Success With Our microsoft excel data analysis 3d bar chart as research tool Powerpoint Templates . Be Assured Of Gaining Entry.
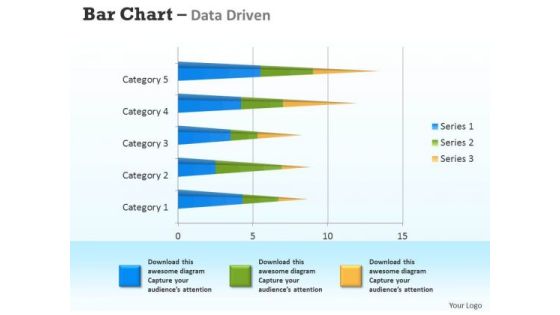
Microsoft Excel Data Analysis 3d Bar Chart For Analyzing Survey PowerPoint Templates
Connect The Dots With Our microsoft excel data analysis 3d bar chart for analyzing survey Powerpoint Templates . Watch The Whole Picture Clearly Emerge.

Microsoft Excel Data Analysis 3d Change In Business Process Chart PowerPoint Templates
Double Your Chances With Our microsoft excel data analysis 3d change in business process chart Powerpoint Templates . The Value Of Your Thoughts Will Increase Two-Fold.

Microsoft Excel Data Analysis 3d Chart For Business Observation PowerPoint Templates
Double Up Our microsoft excel data analysis 3d chart for business observation Powerpoint Templates With Your Thoughts. They Will Make An Awesome Pair.
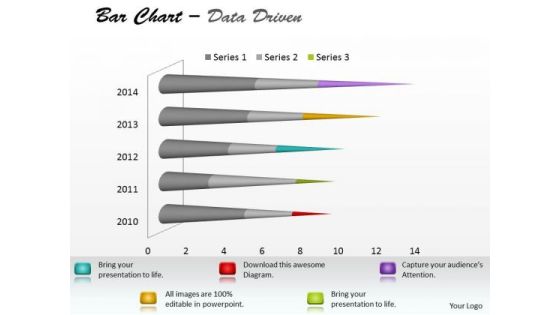
Microsoft Excel Data Analysis Bar Chart To Communicate Information PowerPoint Templates
With Our microsoft excel data analysis bar chart to communicate information Powerpoint Templates You Will Be Doubly Sure. They Possess That Stamp Of Authority.

Microsoft Excel Data Analysis Bar Chart To Compare Quantities PowerPoint Templates
Our microsoft excel data analysis bar chart to compare quantities Powerpoint Templates Leave No One In Doubt. Provide A Certainty To Your Views.
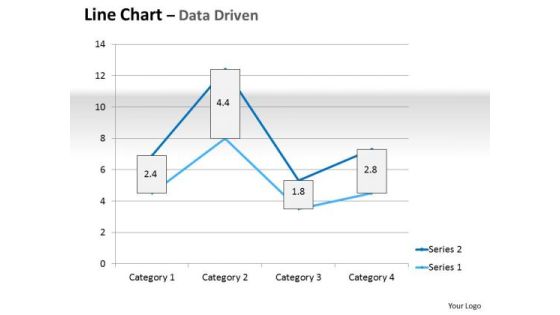
Multivariate Data Analysis Driven Line Chart Market Graph PowerPoint Slides Templates
Plan For All Contingencies With Our multivariate data analysis driven line chart market graph powerpoint slides Templates . Douse The Fire Before It Catches.
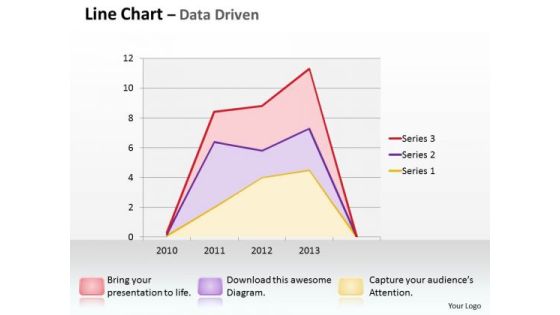
Multivariate Data Analysis Driven Line Chart Shows Revenue Trends PowerPoint Slides Templates
Good Camaraderie Is A Key To Teamwork. Our multivariate data analysis driven line chart shows revenue trends powerpoint slides Templates Can Be A Cementing Force.
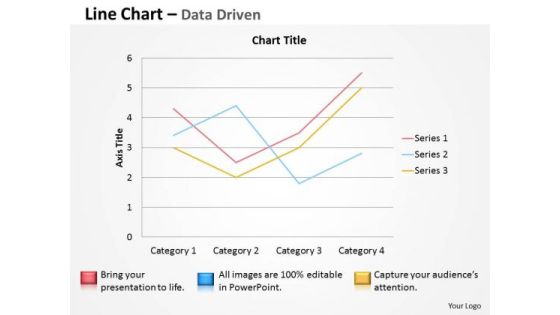
Multivariate Data Analysis Driven Line Chart To Demonstrate PowerPoint Slides Templates
Brace Yourself, Arm Your Thoughts. Prepare For The Hustle With Our multivariate data analysis driven line chart to demonstrate powerpoint slides Templates .
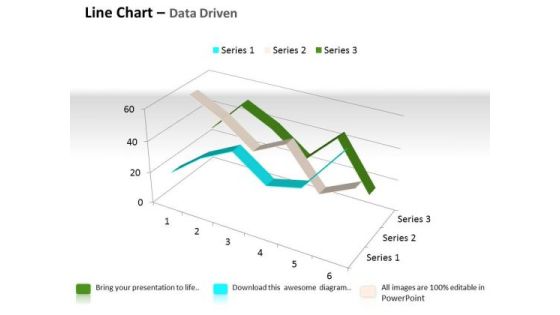
Quantitative Data Analysis 3d Line Chart For Comparison Of PowerPoint Templates
Touch Base With Our quantitative data analysis 3d line chart for comparison of Powerpoint Templates . Review Your Growth With Your Audience.

Quantitative Data Analysis 3d Pie Chart For Business Process PowerPoint Templates
Put Them On The Same Page With Our quantitative data analysis 3d pie chart for business process Powerpoint Templates . Your Team Will Sing From The Same Sheet.
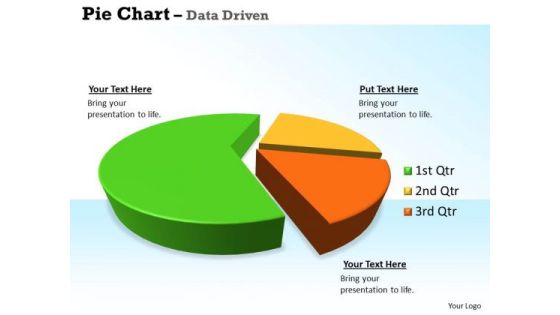
Quantitative Data Analysis 3d Pie Chart For Business Statistics PowerPoint Templates
Our quantitative data analysis 3d pie chart for business statistics Powerpoint Templates Allow You To Do It With Ease. Just Like Picking The Low Hanging Fruit.

Quantitative Data Analysis Driven Economic Status Line Chart PowerPoint Slides Templates
Be The Dramatist With Our quantitative data analysis driven economic status line chart powerpoint slides Templates . Script Out The Play Of Words.

Quantitative Data Analysis Driven Economic With Column Chart PowerPoint Slides Templates
Add Some Dramatization To Your Thoughts. Our quantitative data analysis driven economic with column chart powerpoint slides Templates Make Useful Props.
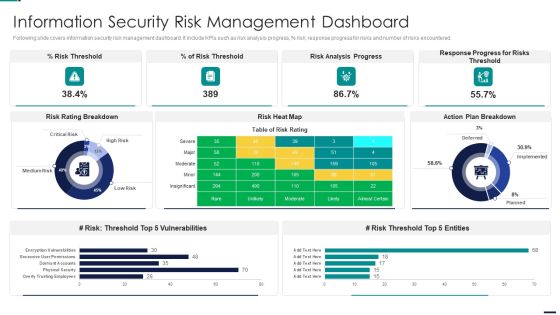
Risk Management Model For Data Security Information Security Risk Management Dashboard Pictures PDF
Following slide covers information security risk management dashboard. It include KPIs such as risk analysis progress, percent risk, response progress for risks and number of risks encountered. Deliver an awe inspiring pitch with this creative Risk Management Model For Data Security Information Security Risk Management Dashboard Pictures PDF bundle. Topics like Risk Threshold, Risk Analysis Progress, Response Progress For Risks Threshold, Action Plan Breakdown can be discussed with this completely editable template. It is available for immediate download depending on the needs and requirements of the user.
Risk Analysis Vector Icon Ppt Powerpoint Presentation Infographics File Formats
This is a risk analysis vector icon ppt powerpoint presentation infographics file formats. This is a four stage process. The stages in this process are feedback loop icon, evaluation icon, assessment icon.

Market Research Assessment Of Target Market Requirements Instagram Marketing Campaign Increase Template PDF
The following slide outlines overview of Instagram marketing campaign that can assist organizations to successfully optimize conversion rate. Information covered in this slide is related to campaign details, goal, target audience, influencers, duration, budget, and key metrics. The Market Research Assessment Of Target Market Requirements Instagram Marketing Campaign Increase Template PDF is a compilation of the most recent design trends as a series of slides. It is suitable for any subject or industry presentation, containing attractive visuals and photo spots for businesses to clearly express their messages. This template contains a variety of slides for the user to input data, such as structures to contrast two elements, bullet points, and slides for written information. Slidegeeks is prepared to create an impression.
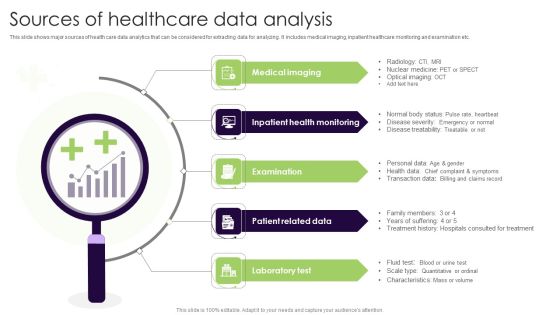
Sources Of Healthcare Data Analysis Rules PDF
This slide shows major sources of health care data analytics that can be considered for extracting data for analyzing. It includes medical imaging, inpatient healthcare monitoring and examination etc. Presenting Sources Of Healthcare Data Analysis Rules PDF to dispense important information. This template comprises five stages. It also presents valuable insights into the topics including Inpatient Health Monitoring, Examination, Patient Related Data. This is a completely customizable PowerPoint theme that can be put to use immediately. So, download it and address the topic impactfully.

Data Analysis On Excel 3d Chart Shows Interrelated Sets Of PowerPoint Templates
Put Them On The Same Page With Our data analysis on excel 3d chart shows interrelated sets of Powerpoint Templates . Your Team Will Sing From The Same Sheet.

Data Analysis On Excel Driven Stock Chart For Market History PowerPoint Slides Templates
Draw Out The Best In You With Our data analysis on excel driven stock chart for market history powerpoint slides Templates . Let Your Inner Brilliance Come To The Surface.
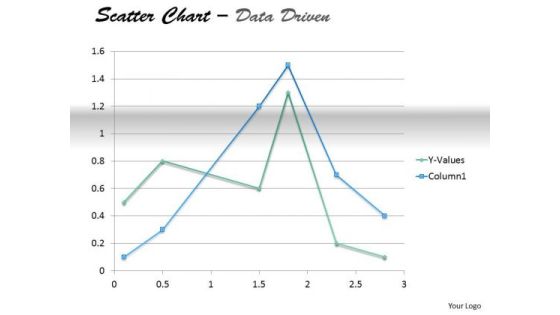
Examples Of Data Analysis Market Driven Present In Scatter Chart PowerPoint Slides Templates
Your Thoughts Will Take To Our examples of data analysis market driven present in scatter chart powerpoint slides Templates Like A Duck To Water. They Develop A Binding Affinity.

Procedure Of Time Series Analysis Diagram Powerpoint Slide Clipart
This is a procedure of time series analysis diagram powerpoint slide clipart. This is a eight stage process. The stages in this process are data acquisition, preprocessing, correlation and spectral analysis, build the arima model, make predictions, modeling and prediction, statistical analysis, visualize the time series.

Big Data Management In Automobile Industry Ppt Icon Example PDF
This slide explains the big data use cases in the automobile industry and how it would help automobile firms in supply chain management, connected cars, automobile financing, predictive analysis, and design and production. This is a big data management in automobile industry ppt icon example pdf template with various stages. Focus and dispense information on five stages using this creative set, that comes with editable features. It contains large content boxes to add your information on topics like supply chain management, automobile financing, predictive analysis, design, production. You can also showcase facts, figures, and other relevant content using this PPT layout. Grab it now.

Guidebook For Executing Business Market Intelligence Brief Of Gap Analysis For Data Evaluation Professional PDF
The following slide highlights overview of gap analysis method for data evaluation and identify variance between actual and estimated performance. It also presents various advantages which are profit percentage analysis, process improvement, market opportunities and understand KPIs. Crafting an eye catching presentation has never been more straightforward. Let your presentation shine with this tasteful yet straightforward Guidebook For Executing Business Market Intelligence Brief Of Gap Analysis For Data Evaluation Professional PDF template. It offers a minimalistic and classy look that is great for making a statement. The colors have been employed intelligently to add a bit of playfulness while still remaining professional. Construct the ideal Guidebook For Executing Business Market Intelligence Brief Of Gap Analysis For Data Evaluation Professional PDF that effortlessly grabs the attention of your audience Begin now and be certain to wow your customers.

Companies Branding Analysis Ppt Sample
This is a companies branding analysis ppt sample. This is a five stage process. The stages in this process are growth, loyalty, success, sales, customer.

Data Analytics IT Tools For Data Science Excel Ppt Professional Templates PDF
This slide depicts the excel tool used in data science and its usage along with its features. It also shows that users can create their functions and combine SQL with Excel. This is a data analytics it tools for data science excel ppt professional templates pdf template with various stages. Focus and dispense information on eight stages using this creative set, that comes with editable features. It contains large content boxes to add your information on topics like data analysis, calculations and visualization, data scientists, process. You can also showcase facts, figures, and other relevant content using this PPT layout. Grab it now.
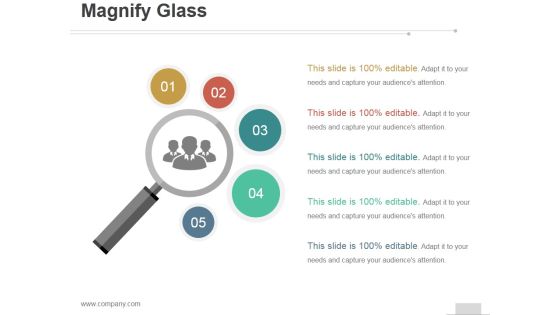
Magnify Glass Ppt PowerPoint Presentation Influencers
This is a magnify glass ppt powerpoint presentation influencers. This is a five stage process. The stages in this process are business, marketing, success, searching, strategy.
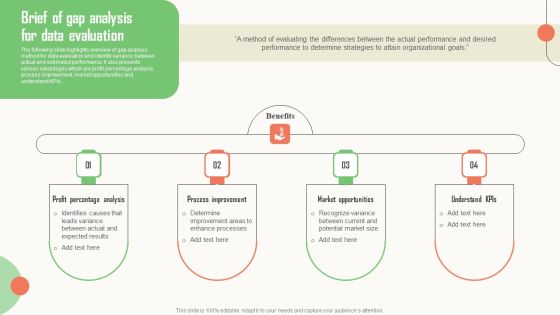
Strategic Market Insight Implementation Guide Brief Of Gap Analysis For Data Evaluation Sample PDF
The following slide highlights overview of gap analysis method for data evaluation and identify variance between actual and estimated performance. It also presents various advantages which are profit percentage analysis, process improvement, market opportunities and understand KPIs. Want to ace your presentation in front of a live audience Our Strategic Market Insight Implementation Guide Brief Of Gap Analysis For Data Evaluation Sample PDF can help you do that by engaging all the users towards you. Slidegeeks experts have put their efforts and expertise into creating these impeccable powerpoint presentations so that you can communicate your ideas clearly. Moreover, all the templates are customizable, and easy to edit and downloadable. Use these for both personal and commercial use.
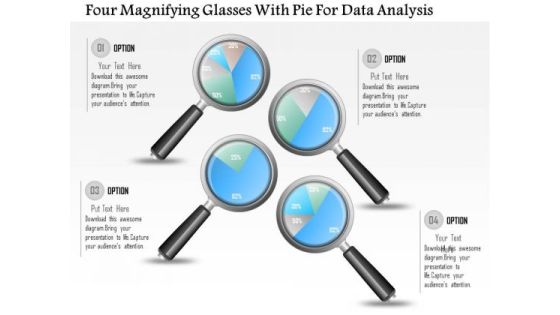
Business Diagram Four Magnifying Glasses With Pie For Data Analysis PowerPoint Slide
This business diagram displays graphic of pie charts in shape of magnifying glasses This business slide is suitable to present and compare business data. Use this diagram to build professional presentations for your viewers.
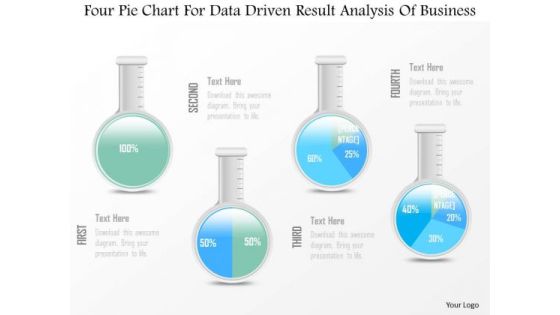
Business Diagram Four Pie Chart For Data Driven Result Analysis Of Business PowerPoint Slide
This business diagram displays graphic of pie charts in shape of flasks. This business slide is suitable to present and compare business data. Use this diagram to build professional presentations for your viewers.

Business Diagram Data Visualization Workflow From Data Access To Graphs Ppt Slide
Graphic of workflow has been used to design this diagram. This diagram slide depicts the concept of data visualization from data access. This diagrams suitable for technology and internet related presentations.
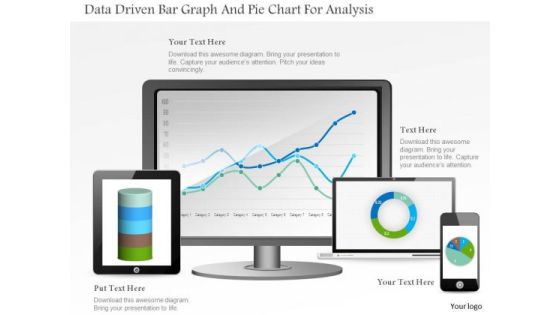
Business Diagram Data Driven Bar Graph And Pie Chart For Analysis PowerPoint Slide
This PowerPoint template displays technology gadgets with various business charts. Use this diagram slide, in your presentations to make business reports for statistical analysis. You may use this diagram to impart professional appearance to your presentations.

Big Data Processing Application Ppt PowerPoint Presentation Shapes
This is a big data processing application ppt powerpoint presentation shapes. This is a two stage process. The stages in this process are small data, big data, low volumes, batch velocities, structured varieties, into petabyte volumes.

Data And Analytics Ppt PowerPoint Presentation Icon Layouts Cpb
This is a data and analytics ppt powerpoint presentation icon layouts cpb. This is a five stage process. The stages in this process are data and analytics.

Business Analysis Data Monitoring Vector Icon Ppt Powerpoint Presentation Ideas Design Ideas
This is a business analysis data monitoring vector icon ppt powerpoint presentation ideas design ideas. This is a one stage process. The stages in this process are feedback loop icon, evaluation icon, assessment icon.

Dashboard To Analyse Effectiveness Of Promotions Execution Plan Diagrams PDF
This slide depicts analysis dashboard for tracking marketing activities with implementations and continuously updates data so businesses can track the marketing effectiveness. The various key performing indicators are cost, conversions and channel performance. Showcasing this set of slides titled Dashboard To Analyse Effectiveness Of Promotions Execution Plan Diagrams PDF. The topics addressed in these templates are Channel Performance, Cost, Conversions. All the content presented in this PPT design is completely editable. Download it and make adjustments in color, background, font etc. as per your unique business setting.

Big Data Software Application Brain Diagram Ppt PowerPoint Presentation Slides
This is a big data software application brain diagram ppt powerpoint presentation slides. This is a one stage process. The stages in this process are big data, communication, business, marketing, idea.

Data Mining Future Trends In Medical Industry Ppt PowerPoint Presentation Inspiration Objects PDF
This slide mentions future trends of data mining applicable in medical industry. It includes electronic health records, patient engagement and predictive analysis. Persuade your audience using this Data Mining Future Trends In Medical Industry Ppt PowerPoint Presentation Inspiration Objects PDF. This PPT design covers four stages, thus making it a great tool to use. It also caters to a variety of topics including Electronic Health, Patient Engagement, Predictive Analytics. Download this PPT design now to present a convincing pitch that not only emphasizes the topic but also showcases your presentation skills.

Comprehensive Customer Data Platform Guide Optimizing Promotional Initiatives Traeger Grills Cdp Execution Outcomes Sample PDF
The following slide illustrates key benefits gained by Trager Grills post customer platform adoption to attract and retain customers. It includes elements such as challenges, solutions, outcomes, data driven decision making, predictive marketing, click rate, conversion rates etc. Do you have an important presentation coming up Are you looking for something that will make your presentation stand out from the rest Look no further than Comprehensive Customer Data Platform Guide Optimizing Promotional Initiatives Traeger Grills Cdp Execution Outcomes Sample PDF. With our professional designs, you can trust that your presentation will pop and make delivering it a smooth process. And with Slidegeeks, you can trust that your presentation will be unique and memorable. So why wait Grab Comprehensive Customer Data Platform Guide Optimizing Promotional Initiatives Traeger Grills Cdp Execution Outcomes Sample PDF today and make your presentation stand out from the rest.
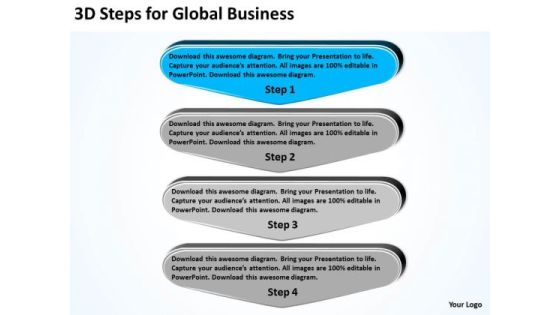
For Global Business PowerPoint Presentations Embroidery Plan Slides
We present our for global business powerpoint presentations embroidery plan Slides.Present our Marketing PowerPoint Templates because networking is an imperative in todays world. You need to access the views of others. Similarly you need to give access to them of your abilities. Download our Business PowerPoint Templates because you can see clearly through to the bigger bowl ahead. Time your jump to perfection and hit the nail on the head. Use our Flow charts PowerPoint Templates because they pinpoint the core values of your organisation. Use our Process and Flows PowerPoint Templates because this outlines the path you have in mind in order to boost sales and stay ahead of the competition enhancing your corporate reputation as you go along the road to success. Use our Arrows PowerPoint Templates because you have the process in your head, our template design showing will illuminate your thoughts.Use these PowerPoint slides for presentations relating to Analysis, Analyze, Background, Business, Chart, Competition, Conceptual, Corporation, Create, Data, Decision, Design, Direction, Economic, Enterprise, Future, Graph, Idea, Illustration, Information, Innovate, Layout, Management, Marketing, Paper, Plan, Process, Product, Project, Science, Social. The prominent colors used in the PowerPoint template are Blue, Gray, Black. Presenters tell us our for global business powerpoint presentations embroidery plan Slides are Vintage. Use our Business PowerPoint templates and PPT Slides are Perfect. You can be sure our for global business powerpoint presentations embroidery plan Slides are Endearing. Professionals tell us our Chart PowerPoint templates and PPT Slides will save the presenter time. Presenters tell us our for global business powerpoint presentations embroidery plan Slides are Amazing. PowerPoint presentation experts tell us our Create PowerPoint templates and PPT Slides will get their audience's attention.
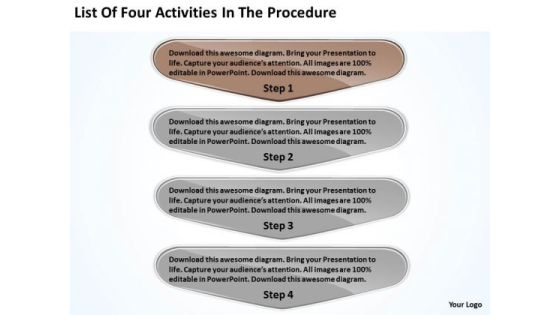
List Of Four Activities In The Procedure Business Plan Template PowerPoint Templates
We present our list of four activities in the procedure business plan template PowerPoint templates.Present our Marketing PowerPoint Templates because presenting your views using our innovative slides, will be assured of leaving a lasting impression. Download and present our Business PowerPoint Templates because you can Lead your flock steadily to greater heights. Look around at the vast potential of achievement around you. Download our Flow charts PowerPoint Templates because health of the determines the quality of our lives. Use our Process and Flows PowerPoint Templates because your ideas are fundamentally stable with a broad base of workable possibilities. Download our Arrows PowerPoint Templates because the concept and strategy is your strength.Use these PowerPoint slides for presentations relating to Analysis, Analyze, Background, Business, Chart, Competition, Conceptual, Corporation, Create, Data, Decision, Design, Direction, Economic, Enterprise, Future, Graph, Idea, Illustration, Information, Innovate, Layout, Management, Marketing, Paper, Plan, Process, Product, Project, Science, Social. The prominent colors used in the PowerPoint template are Brown, Gray, Black. Presenters tell us our list of four activities in the procedure business plan template PowerPoint templates are Lush. Use our Competition PowerPoint templates and PPT Slides are Exuberant. You can be sure our list of four activities in the procedure business plan template PowerPoint templates are Liberated. Professionals tell us our Background PowerPoint templates and PPT Slides are specially created by a professional team with vast experience. They diligently strive to come up with the right vehicle for your brilliant Ideas. Presenters tell us our list of four activities in the procedure business plan template PowerPoint templates are Reminiscent. PowerPoint presentation experts tell us our Competition PowerPoint templates and PPT Slides are Excellent.
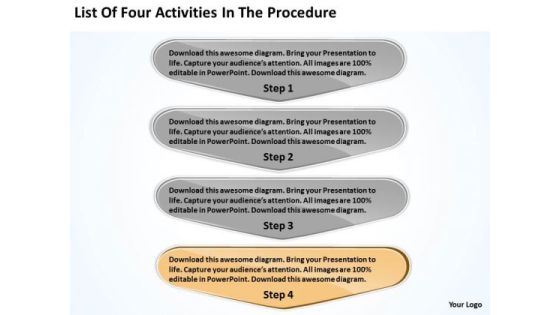
List Of Four Activities In The Procedure Business Plans Writers PowerPoint Slides
We present our list of four activities in the procedure business plans writers PowerPoint Slides.Download our Marketing PowerPoint Templates because customer satisfaction is a mantra of the marketplace. Building a loyal client base is an essential element of your business. Download our Business PowerPoint Templates because maximising sales of your product is the intended destination. Download and present our Flow charts PowerPoint Templates because very often it is important to reflect on the basics. Download our Process and Flows PowerPoint Templates because you have a good idea of the roadmap to your desired destination. Download our Arrows PowerPoint Templates because you should Emphasise the process of your business or corporate growth.Use these PowerPoint slides for presentations relating to Analysis, Analyze, Background, Business, Chart, Competition, Conceptual, Corporation, Create, Data, Decision, Design, Direction, Economic, Enterprise, Future, Graph, Idea, Illustration, Information, Innovate, Layout, Management, Marketing, Paper, Plan, Process, Product, Project, Science, Social. The prominent colors used in the PowerPoint template are Orange, Gray, Black. Presenters tell us our list of four activities in the procedure business plans writers PowerPoint Slides will make you look like a winner. Use our Business PowerPoint templates and PPT Slides are readymade to fit into any presentation structure. You can be sure our list of four activities in the procedure business plans writers PowerPoint Slides are Festive. Professionals tell us our Competition PowerPoint templates and PPT Slides are Pleasant. Presenters tell us our list of four activities in the procedure business plans writers PowerPoint Slides are Fabulous. PowerPoint presentation experts tell us our Business PowerPoint templates and PPT Slides are Magnificent.

List Of Four Activities In The Procedure Web Design Business Plan PowerPoint Slides
We present our list of four activities in the procedure web design business plan PowerPoint Slides.Use our Marketing PowerPoint Templates because networking is an imperative in todays world. You need to access the views of others. Similarly you need to give access to them of your abilities. Download our Business PowerPoint Templates because Building castles in the sand is a danger and you are aware of. You have taken the precaution of building strong fundamentals. Present our Flow charts PowerPoint Templates because there is a vision, a need you can meet. Present our Process and Flows PowerPoint Templates because they pinpoint the core values of your organisation. Download and present our Arrows PowerPoint Templates because using our templates for your colleagues will impart knowledge to feed.Use these PowerPoint slides for presentations relating to Analysis, Analyze, Background, Business, Chart, Competition, Conceptual, Corporation, Create, Data, Decision, Design, Direction, Economic, Enterprise, Future, Graph, Idea, Illustration, Information, Innovate, Layout, Management, Marketing, Paper, Plan, Process, Product, Project, Science, Social. The prominent colors used in the PowerPoint template are Orange, Gray, Black. Presenters tell us our list of four activities in the procedure web design business plan PowerPoint Slides are Sparkling. Use our Conceptual PowerPoint templates and PPT Slides are Handsome. You can be sure our list of four activities in the procedure web design business plan PowerPoint Slides are Wonderful. Professionals tell us our Competition PowerPoint templates and PPT Slides are One-of-a-kind. Presenters tell us our list of four activities in the procedure web design business plan PowerPoint Slides will make the presenter look like a pro even if they are not computer savvy. PowerPoint presentation experts tell us our Competition PowerPoint templates and PPT Slides are the best it can get when it comes to presenting.
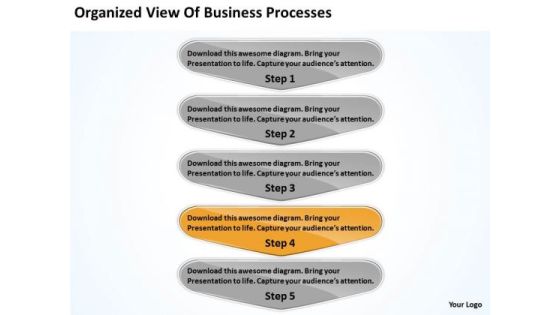
Of New Business PowerPoint Presentation Processes Fitness Plan Slides
We present our of new business powerpoint presentation processes fitness plan Slides.Use our Marketing PowerPoint Templates because your foot is on the pedal and your company is purring along smoothly. Use our Business PowerPoint Templates because you can Lead your flock steadily to greater heights. Look around at the vast potential of achievement around you. Use our Flow charts PowerPoint Templates because you have a great plan to put the pieces together, getting all the various contributors to gel for a successful completion. Use our Process and Flows PowerPoint Templates because clarity of thought has been the key to your growth. Download and present our Arrows PowerPoint Templates because you have churned your mind and come up with effective ways and means to further refine it.Use these PowerPoint slides for presentations relating to Analysis, Analyze, Background, Business, Chart, Competition, Conceptual, Corporation, Create, Data, Decision, Design, Direction, Economic, Enterprise, Future, Graph, Idea, Illustration, Information, Innovate, Layout, Management, Marketing, Paper, Plan, Process, Product, Project, Science, Social. The prominent colors used in the PowerPoint template are Orange, Gray, White. Presenters tell us our of new business powerpoint presentation processes fitness plan Slides are Bright. Use our Corporation PowerPoint templates and PPT Slides are Youthful. You can be sure our of new business powerpoint presentation processes fitness plan Slides are Vintage. Professionals tell us our Corporation PowerPoint templates and PPT Slides are No-nonsense. Presenters tell us our of new business powerpoint presentation processes fitness plan Slides are Youthful. PowerPoint presentation experts tell us our Create PowerPoint templates and PPT Slides are readymade to fit into any presentation structure.

Data Collection Preparation And Preprocessing Through Machine Learning Icons PDF
Once the insights are identified, data collection sources are selected for further predictive modeling. After that, dataset is prepared with a set of attributes representing behavior patterns related to customer engagement level for specific product or service. Presenting this PowerPoint presentation, titled Data Collection Preparation And Preprocessing Through Machine Learning Icons PDF, with topics curated by our researchers after extensive research. This editable presentation is available for immediate download and provides attractive features when used. Download now and captivate your audience. Presenting this Data Collection Preparation And Preprocessing Through Machine Learning Icons PDF. Our researchers have carefully researched and created these slides with all aspects taken into consideration. This is a completely customizable Data Collection Preparation And Preprocessing Through Machine Learning Icons PDF that is available for immediate downloading. Download now and make an impact on your audience. Highlight the attractive features available with our PPTs.

Financial Forecast After Process Improvement Develop Organizational Productivity By Enhancing Business Process Brochure PDF
The slide provides the financial forecast of the company after the process improvement. Major KPIs key performance indicators covered in the slide are total revenue, interest income, number of customers, customer churn rate, online banking users, customer satisfaction rate etc. Deliver an awe inspiring pitch with this creative financial forecast after process improvement develop organizational productivity by enhancing business process brochure pdf bundle. Topics like revenue, interest income, performance indicator, actual, target can be discussed with this completely editable template. It is available for immediate download depending on the needs and requirements of the user.
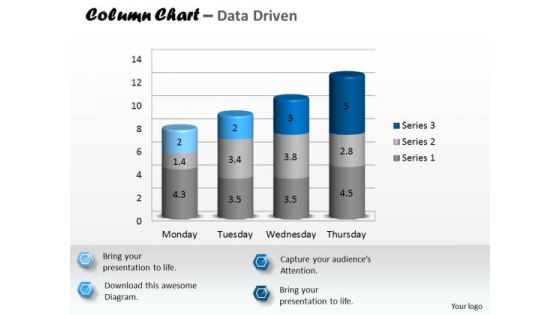
Data Analysis In Excel 3d Column Chart To Represent Information PowerPoint Templates
Rake In The Dough With
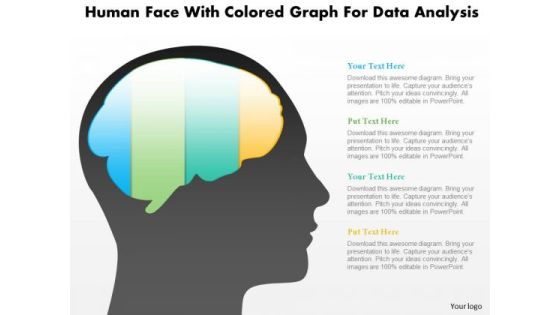
Business Diagram Human Face With Colored Graph For Data Analysis PowerPoint Slide
This diagram displays human face graphic with colored graph. This diagram can be used to represent strategy, planning, thinking of business plan. Display business options in your presentations by using this creative diagram.

Comprehensive Guide For Multi Level Network Marketing Software Dashboard Summary PDF
This slide represents metric dashboard for multi-level marketing software that helps marketers to track and monitor network participants progress. It covers details regarding training, sales etc. Do you have an important presentation coming up Are you looking for something that will make your presentation stand out from the rest Look no further than Comprehensive Guide For Multi Level Network Marketing Software Dashboard Summary PDF. With our professional designs, you can trust that your presentation will pop and make delivering it a smooth process. And with Slidegeeks, you can trust that your presentation will be unique and memorable. So why wait Grab Comprehensive Guide For Multi Level Network Marketing Software Dashboard Summary PDF today and make your presentation stand out from the rest.

Data Monetization Approach To Drive Business Growth Modelling And Testing In Machine Learning Clipart PDF
The firm can consider in between two churn prediction model decision tree and random forest. These models are capable in detecting potential churners with desired level of accuracy. Welcome to our selection of the Data Monetization Approach To Drive Business Growth Modelling And Testing In Machine Learning Clipart PDF. These are designed to help you showcase your creativity and bring your sphere to life. Planning and Innovation are essential for any business that is just starting out. This collection contains the designs that you need for your everyday presentations. All of our PowerPoints are 100 percent editable, so you can customize them to suit your needs. This multi purpose template can be used in various situations. Grab these presentation templates today.
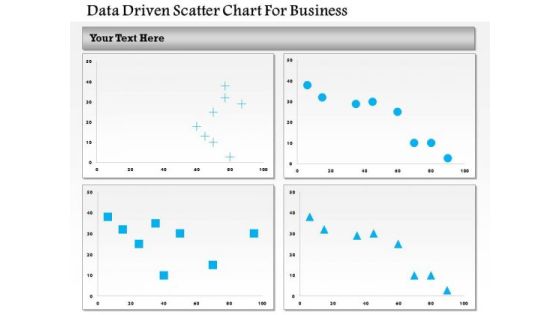
Business Diagram Data Driven Scatter Chart For Business PowerPoint Slide
This business diagram has been designed with four comparative charts. This slide suitable for data representation. You can also use this slide to present business analysis and reports. Use this diagram to present your views in a wonderful manner.

Design For Data Analysis And Strategy Planning Powerpoint Templates
This business slide has backdrop of chess game with six zigzag steps. You may download this slide for data analysis and strategy planning related topics. Illustrate your plans to your listeners with using this slide.

Business Diagram Thumb Diagram With Five Stages For Data Representation PowerPoint Slide
This business diagram displays thumb up with five stages. This diagram contains text boxes for data representation. Use this diagram to display business process workflows in any presentations.

Bar Graph Icon For Research Analysis Ppt PowerPoint Presentation Summary Portfolio
Presenting this set of slides with name bar graph icon for research analysis ppt powerpoint presentation summary portfolio. This is a three stage process. The stages in this process are data visualization icon, research analysis, business focus. This is a completely editable PowerPoint presentation and is available for immediate download. Download now and impress your audience.

Data Maturity Framework Assessment Icon Ppt PowerPoint Presentation Icon Infographic Template PDF
Presenting Data Maturity Framework Assessment Icon Ppt PowerPoint Presentation Icon Infographic Template PDF to dispense important information. This template comprises one stages. It also presents valuable insights into the topics including Data Maturity Framework, Assessment Icon. This is a completely customizable PowerPoint theme that can be put to use immediately. So, download it and address the topic impactfully.

Types Of Big Data Analytics Procedure For Effective Decision Making Microsoft PDF
This slide illustrate four different types of big data analysis processes along with their tools used and business applications. It includes analysis such as descriptive, diagnostic, predictive and prescriptive Pitch your topic with ease and precision using this Types Of Big Data Analytics Procedure For Effective Decision Making Microsoft PDF. This layout presents information on Descriptive Analysis, Diagnostic Analysis, Predictive Analysis. It is also available for immediate download and adjustment. So, changes can be made in the color, design, graphics or any other component to create a unique layout.

Competitive Analysis Matrix Ppt PowerPoint Presentation Inspiration
This is a competitive analysis matrix ppt powerpoint presentation inspiration. This is a six stage process. The stages in this process are tables, benefits, data, analysis, marketing.
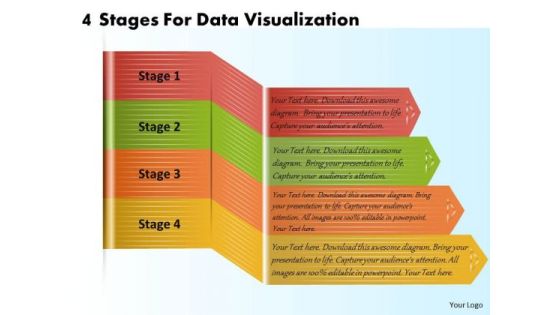
Business Plan And Strategy 4 Stages For Data Visualization Strategic Planning Template Ppt Slide
Your Listeners Will Never Doodle. Our business plan and strategy 4 stages for data visualization strategic planning template ppt slide Powerpoint Templates Will Hold Their Concentration. Do The One Thing With Your Thoughts. Uphold Custom With Our Process and Flows Powerpoint Templates.
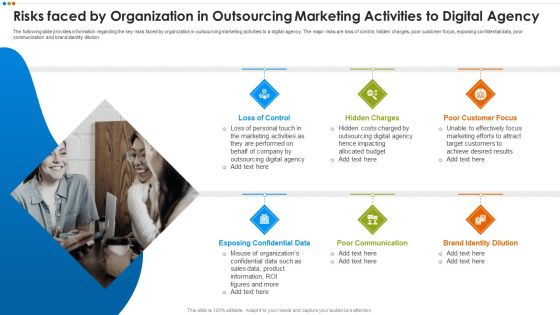
Quarterly Budget Analysis Of Business Organization Risks Faced By Organization In Outsourcing Clipart PDF
The following slide provides information regarding the key risks faced by organization in outsourcing marketing activities to a digital agency. The major risks are loss of control, hidden charges, poor customer focus, exposing confidential data, poor communication and brand identity dilution.Presenting Quarterly Budget Analysis Of Business Organization Risks Faced By Organization In Outsourcing Clipart PDF to provide visual cues and insights. Share and navigate important information on six stages that need your due attention. This template can be used to pitch topics like Poor Customer Focus, Exposing Confidential Data, Poor Communication In addtion, this PPT design contains high resolution images, graphics, etc, that are easily editable and available for immediate download.

Business Diagram Alarm Clock With Pie Chart For Result Analysis PowerPoint Slide
This business slide displays alarm clock with pie chart. This diagram is a data visualization tool that gives you a simple way to present statistical information. This slide helps your audience examine and interpret the data you present.
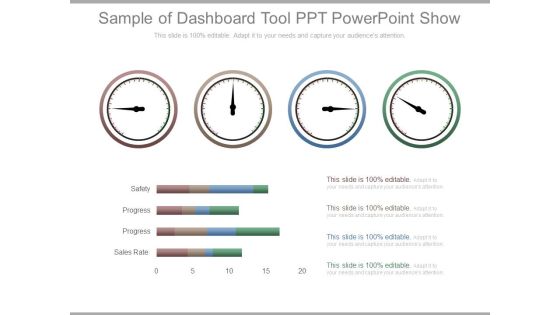
Sample Of Dashboard Tool Ppt Powerpoint Show
This is a sample of dashboard tool ppt powerpoint show. This is a four stage process. The stages in this process are safety, progress, sales rate.

Business Diagram Flask With Data Driven Chart PowerPoint Slide
This data driven diagram has been designed with flask graphics. Download this diagram to give your presentations more effective look. It helps in clearly conveying your message to clients and audience.

Business Diagram Laptop With Data Driven Area Chart PowerPoint Slide
This diagram has been designed with laptop and data driven area chart. Download this diagram to give your presentations more effective look. It helps in clearly conveying your message to clients and audience.

Customer Centric Business Model Ppt Presentation
This is a customer centric business model ppt presentation. This is a four stage process. The stages in this process are success, arrows, business.
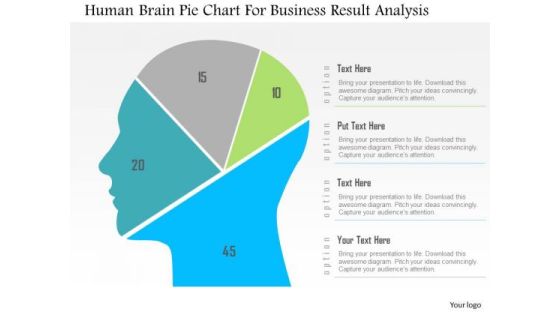
Business Diagram Human Brain Pie Chart For Business Result Analysis PowerPoint Slide
This diagram displays human face graphic divided into sections. This section can be used for data display. Use this diagram to build professional presentations for your viewers.
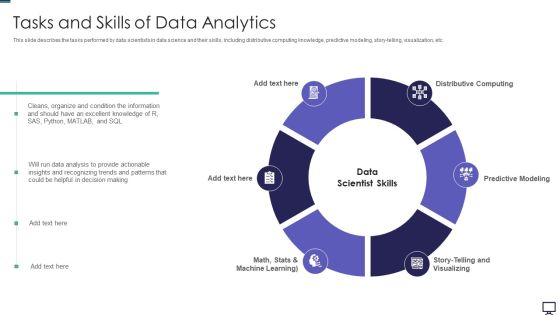
Tasks And Skills Of Data Analytics Ppt Infographics Summary PDF
This slide describes the tasks performed by data scientists in data science and their skills, including distributive computing knowledge, predictive modeling, story-telling, visualization, etc. Presenting tasks and skills of data analytics ppt infographics summary pdf to provide visual cues and insights. Share and navigate important information on six stages that need your due attention. This template can be used to pitch topics like data analysis, information, predictive modeling, distributive computing. In addtion, this PPT design contains high resolution images, graphics, etc, that are easily editable and available for immediate download.

Business Diagram 3d Colorful Pie Graph With Magnifier Data Search PowerPoint Slide
This business slide displays 3d colorful pie graph with magnifier. This diagram is a data visualization tool that gives you a simple way to present statistical information. This slide helps your audience examine and interpret the data you present.

Business Diagram Data Driven Pie Chart Inside The Magnifier PowerPoint Slide
This business slide displays 3d colorful pie graph with magnifier. This diagram is a data visualization tool that gives you a simple way to present statistical information. This slide helps your audience examine and interpret the data you present.
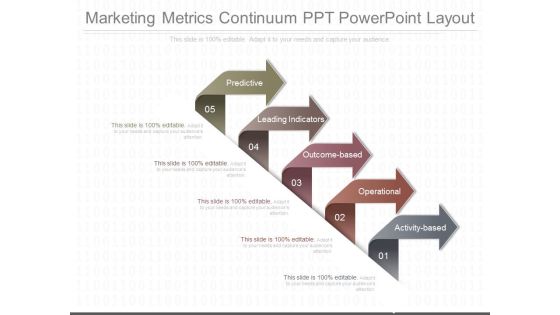
Marketing Metrics Continuum Ppt Powerpoint Layout
This is a marketing metrics continuum ppt powerpoint layout. This is a five stage process. The stages in this process are predictive, leading indicators, outcome based, operational, activity based.

Consumer Statistics Tools Analysis Chart Ppt PowerPoint Presentation File Picture PDF
Presenting this set of slides with name consumer statistics tools analysis chart ppt powerpoint presentation file picture pdf. The topics discussed in these slides are forecasting accuracy, visualization friendliness, data science. This is a completely editable PowerPoint presentation and is available for immediate download. Download now and impress your audience.

Components Of Cost Analysis Process For E Commerce Portrait PDF
This slide showcases various elements of pricing analysis process to determine economic price for a product or service in an e-commerce industry. It includes key components like calculate price index, utilize historical price data and use pricing software. Persuade your audience using this Components Of Cost Analysis Process For E Commerce Portrait PDF. This PPT design covers three stages, thus making it a great tool to use. It also caters to a variety of topics including Calculate Price Index, Utilize Historical Price Data, Pricing Software. Download this PPT design now to present a convincing pitch that not only emphasizes the topic but also showcases your presentation skills.
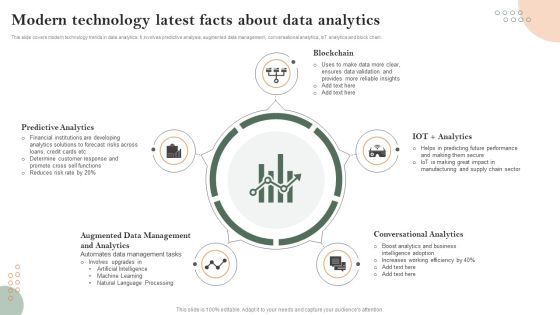
Modern Technology Latest Facts About Data Analytics Template PDF
This slide covers modern technology trends in data analytics. It involves predictive analysis, augmented data management, conversational analytics, IoT analytics and block chain. Persuade your audience using this Modern Technology Latest Facts About Data Analytics Template PDF. This PPT design covers Five stages, thus making it a great tool to use. It also caters to a variety of topics including Predictive Analytics, Blockchain, Conversational Analytics. Download this PPT design now to present a convincing pitch that not only emphasizes the topic but also showcases your presentation skills.

Business Diagram Tablet With Pie And Business Bar Graph For Result Analysis PowerPoint Slide
This PowerPoint template displays technology gadgets with various business charts. Use this diagram slide, in your presentations to make business reports for statistical analysis. You may use this diagram to impart professional appearance to your presentations.

Application Development Best Practice Tools And Templates Jira Dashboard For Software Teams Progress Microsoft PDF
This slide covers the software teams progress through JIRA dashboard which focuses on pie chart, sprint health dashboard and assigned task details. Deliver and pitch your topic in the best possible manner with this application development best practice tools and templates jira dashboard for software teams progress microsoft pdf. Use them to share invaluable insights on improvement, travel provider, initiative, task and impress your audience. This template can be altered and modified as per your expectations. So, grab it now.

Brand Maintenance Toolkit Performance Monitoring Dashboard To Track Brand Progress Elements PDF
This slide provides information regarding monitoring dashboard to track brand performance through monitoring of session, new users, bounce rate, etc. Deliver an awe inspiring pitch with this creative Brand Maintenance Toolkit Performance Monitoring Dashboard To Track Brand Progress Elements PDF bundle. Topics like Performance Monitoring Dashboard, Track Brand Progress can be discussed with this completely editable template. It is available for immediate download depending on the needs and requirements of the user.

Magnify Glass Ppt PowerPoint Presentation Styles
This is a magnify glass ppt powerpoint presentation styles. This is a five stage process. The stages in this process are big data, analysis, success, business, strategy.

Digital Dashboard Resource Kit Ppt Powerpoint Slides Design
This is a digital dashboard resource kit ppt powerpoint slides design. This is a four stage process. The stages in this process are sales rate, progress, profits, safety.

Data Analytics Management Big Data Management In Automobile Industry Template PDF
This slide explains the big data use cases in the automobile industry and how it would help automobile firms in supply chain management, connected cars, automobile financing, predictive analysis, and design and production.This is a Data Analytics Management Big Data Management In Automobile Industry Template PDF template with various stages. Focus and dispense information on five stages using this creative set, that comes with editable features. It contains large content boxes to add your information on topics like Chain Management, Connected Cars, Automobile Financing. You can also showcase facts, figures, and other relevant content using this PPT layout. Grab it now.

Data Evaluation And Processing Toolkit Value Stream Information Data Analytics Structure Themes PDF
The slides shows the stages of data analytics with reactive and proactive approach. In includes four steps collection, analysis, predictive and actions. This modern and well-arranged Data Evaluation And Processing Toolkit Value Stream Information Data Analytics Structure Themes PDF provides lots of creative possibilities. It is very simple to customize and edit with the Powerpoint Software. Just drag and drop your pictures into the shapes. All facets of this template can be edited with Powerpoint, no extra software is necessary. Add your own material, put your images in the places assigned for them, adjust the colors, and then you can show your slides to the world, with an animated slide included.
Business Diagram 3d Capsule With Multiple Icons For Business Data Flow PowerPoint Slide
This diagram has been designed with 3d graphic of capsule with multiple icons. This data driven PowerPoint slide can be used to give your presentations more effective look. It helps in clearly conveying your message to clients and audience.

Business Diagram 3d Thumb Chart And Tablet For Data Representation PowerPoint Slide
This business diagram displays graphic of 3d thumb up chart with icons on computer screen. This business slide contains the concept of business data representation. Use this diagram to build professional presentations for your viewers.


