Project Kpi
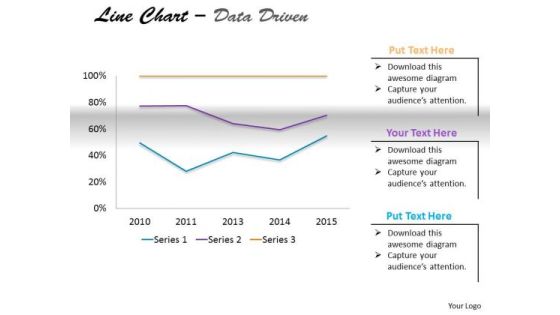
Multivariate Data Analysis Driven Market Line Chart PowerPoint Slides Templates
Delight Them With Our multivariate data analysis driven market line chart powerpoint slides Templates .

5 Levels Of Data Analysis For Managing Organizational Issues Microsoft PDF
This slide showcases the problem solving techniques through five level of data analysis model. Key goal of this analysis is to find insights about the issues and corrective actions. Five stages of data analysis are descriptive, diagnostic, predictive, prescriptive and cognitive. Persuade your audience using this 5 Levels Of Data Analysis For Managing Organizational Issues Microsoft PDF. This PPT design covers five stages, thus making it a great tool to use. It also caters to a variety of topics including Data Analysis, Management, Business Reputation. Download this PPT design now to present a convincing pitch that not only emphasizes the topic but also showcases your presentation skills.

Data Management Analysis Ppt PowerPoint Presentation Complete Deck With Slides
This is a data management analysis ppt powerpoint presentation complete deck with slides. This is a one stage process. The stages in this process are business, data analysis, management, marketing, strategy.
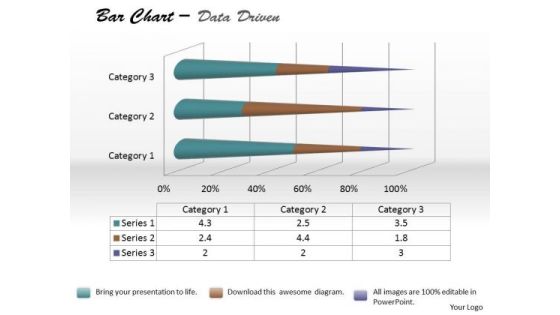
Data Analysis Bar Chart For Foreign Trade PowerPoint Templates
Be The Doer With Our data analysis bar chart for foreign trade Powerpoint Templates. Put Your Thoughts Into Practice.

Data Analysis Excel Business Tool Scatter Chart PowerPoint Templates
Dominate Proceedings With Your Ideas. Our data analysis excel business tool scatter chart Powerpoint Templates Will Empower Your Thoughts.
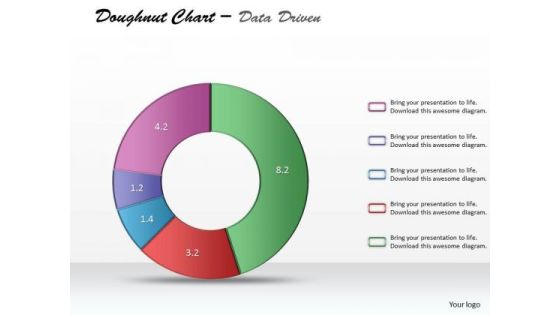
Data Analysis Excel Categorical Statistics Doughnut Chart PowerPoint Templates
Establish Your Dominion With Our data analysis excel categorical statistics doughnut chart Powerpoint Templates. Rule The Stage With Your Thoughts.

Data Analysis Techniques 3d Grouped Bar Chart PowerPoint Templates
Place The Orders With Your Thoughts. Our data analysis techniques 3d grouped bar chart Powerpoint Templates Know The Drill.
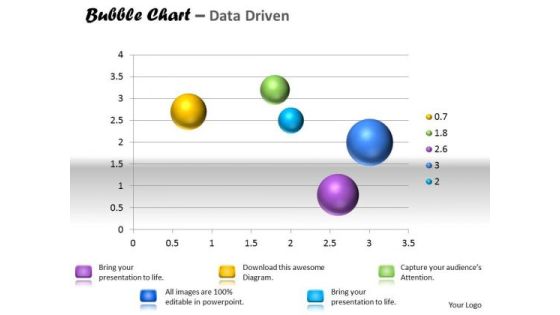
Data Analysis Template Interactive Bubble Chart PowerPoint Templates
Our data analysis template interactive bubble chart Powerpoint Templates Are A Wonder Drug. They Help Cure Almost Any Malaise.
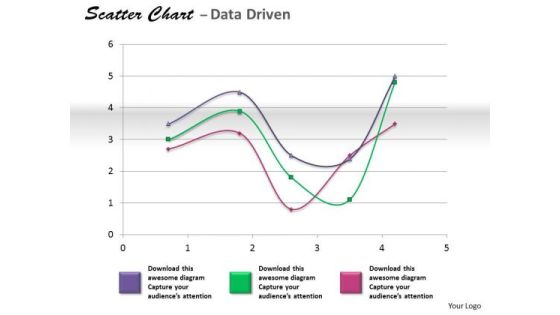
Financial Data Analysis Coordinate With Scatter Chart PowerPoint Templates
Get The Doers Into Action. Activate Them With Our financial data analysis coordinate with scatter chart Powerpoint Templates .
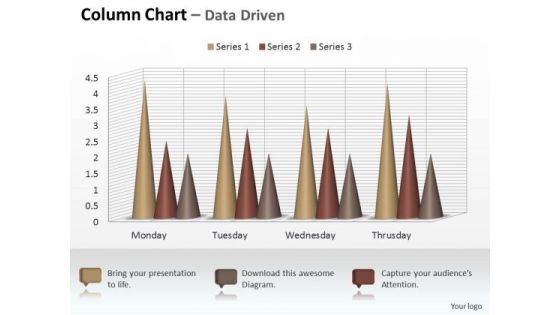
Marketing Data Analysis 3d Sets Of Column Chart PowerPoint Templates
Your Listeners Will Never Doodle. Our marketing data analysis 3d sets of column chart Powerpoint Templates Will Hold Their Concentration.
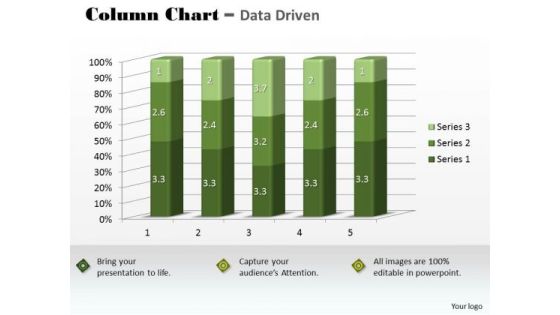
Marketing Data Analysis 3d Statistical Quality Control Chart PowerPoint Templates
Our marketing data analysis 3d statistical quality control chart Powerpoint Templates Abhor Doodling. They Never Let The Interest Flag.
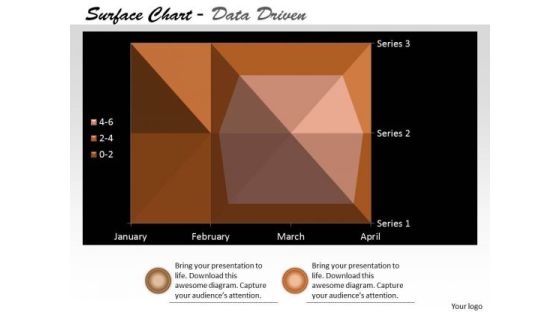
Multivariate Data Analysis Surface Chart Plots Trends PowerPoint Templates
Our multivariate data analysis surface chart plots trends Powerpoint Templates Heighten Concentration. Your Audience Will Be On The Edge.
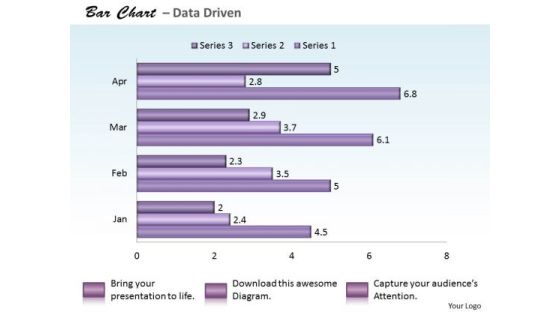
Quantitative Data Analysis Bar Chart For PowerPoint Templates
Reduce The Drag With Our quantitative data analysis bar chart for Powerpoint Templates . Give More Lift To Your Thoughts.

Data Analysis Techniques 3d Effective Display Chart PowerPoint Templates
Dribble Away With Our data analysis techniques 3d effective display chart Powerpoint Templates . Score A Goal With Your Ideas.
Developing Organization Partner Strategy 6 Measure Partner Performance Ppt PowerPoint Presentation Icon Format Ideas PDF
Presenting this set of slides with name developing organization partner strategy 6 measure partner performance ppt powerpoint presentation icon format ideas pdf. This is a three three stage process. The stages in this process are partner performance scorecard, pipeline deals, making progress, business. This is a completely editable PowerPoint presentation and is available for immediate download. Download now and impress your audience.
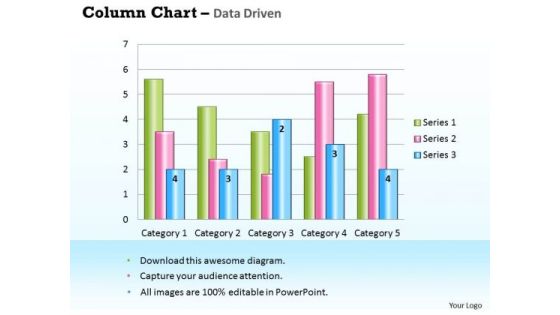
Business Data Analysis Chart For Case Studies PowerPoint Templates
Get Out Of The Dock With Our business data analysis chart for case studies Powerpoint Templates. Your Mind Will Be Set Free.
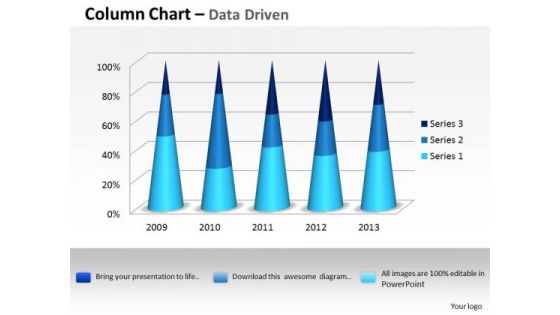
Data Analysis Excel 3d Process Variation Column Chart PowerPoint Templates
Put In A Dollop Of Our data analysis excel 3d process variation column chart Powerpoint Templates. Give Your Thoughts A Distinctive Flavor.
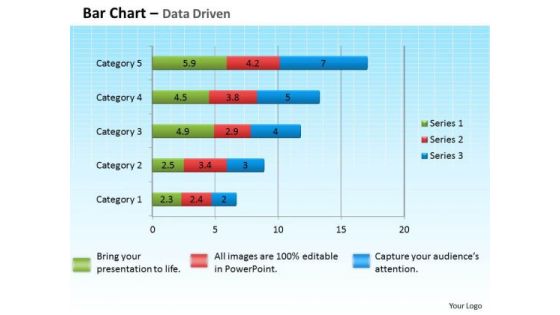
Data Analysis Excel Bar Graph To Compare PowerPoint Templates
Get The Domestics Right With Our data analysis excel bar graph to compare Powerpoint Templates. Create The Base For Thoughts To Grow.

Data Analysis Excel Bubble Chart For Business Tasks PowerPoint Templates
Doll Up Your Thoughts With Our data analysis excel bubble chart for business tasks Powerpoint Templates. They Will Make A Pretty Picture.
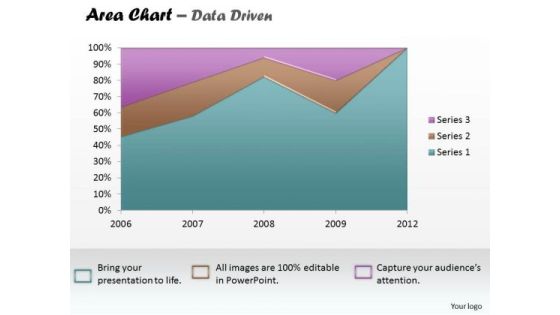
Data Analysis Excel Business Reporting Area Chart PowerPoint Templates
Establish The Dominance Of Your Ideas. Our data analysis excel business reporting area chart Powerpoint Templates Will Put Them On Top.

Data Analysis In Excel 3d Classification Of Chart PowerPoint Templates
With Our data analysis in excel 3d classification of chart Powerpoint Templates You Will Be Doubly Sure. They Possess That Stamp Of Authority.
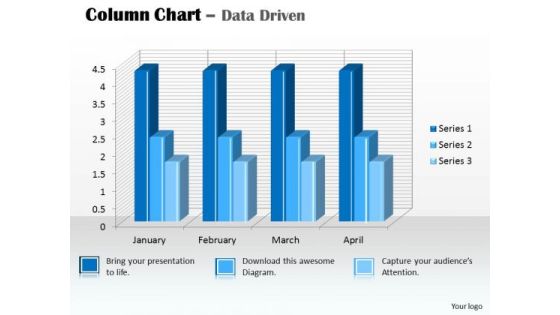
Data Analysis In Excel 3d Column Chart For PowerPoint Templates
Our data analysis in excel 3d column chart for Powerpoint Templates And Your Ideas Make A Great Doubles Pair. Play The Net With Assured Hands.

Data Analysis In Excel Of Stock Chart PowerPoint Templates
Plan Your Storyboard With Our data analysis in excel of stock chart Powerpoint Templates . Give An Outline To The Solutions You Have.

Data Analysis Programs 3d Bar Chart To Dispaly PowerPoint Templates
Lower The Drawbridge With Our data analysis programs 3d bar chart to dispaly Powerpoint Templates . Capture The Minds Of Your Audience.
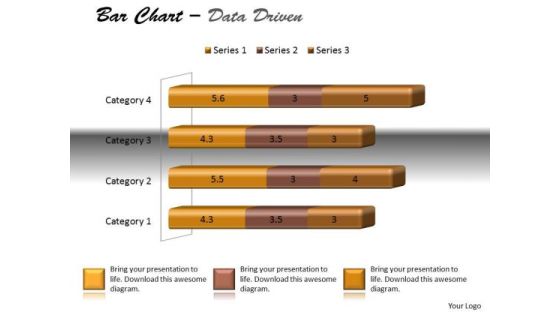
Data Analysis Techniques 3d Bar Chart For Modification PowerPoint Templates
Dreams Generate Thoughts, Thoughts Generate Ideas. Give Them Life With Our data analysis techniques 3d bar chart for modification Powerpoint Templates .
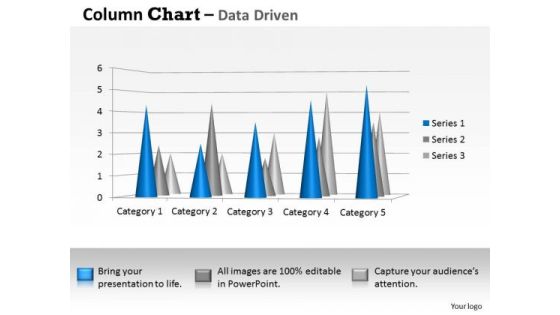
Data Analysis Techniques 3d Distribution Of In Sets PowerPoint Templates
Your Thoughts Will Be The Main Course. Provide The Dressing With Our data analysis techniques 3d distribution of in sets Powerpoint Templates .

Data Analysis Techniques 3d Graphical Presentation Of PowerPoint Templates
Our data analysis techniques 3d graphical presentation of Powerpoint Templates Will Follow The Drill. They Accomplish The Task Assigned To Them.

Data Analysis Techniques 3d In Segments Pie Chart PowerPoint Templates
Drink To The Success Of Your Campaign. Our data analysis techniques 3d in segments pie chart Powerpoint Templates Will Raise A Toast.

Data Analysis Template Driven Visualization Area Chart PowerPoint Slides Templates
Draw On The Energy Of Our data analysis template driven visualization area chart powerpoint slides Templates . Your Thoughts Will Perk Up.

Data Analysis Template Forex Market Bar Chart PowerPoint Templates
Attract A Crowd With Our data analysis template forex market bar chart Powerpoint Templates . They Will Drop It All And Come To Hear You.

Financial Data Analysis Area Chart For Showing Trends PowerPoint Templates
Document Your Views On Our financial data analysis area chart for showing trends Powerpoint Templates . They Will Create A Strong Impression.
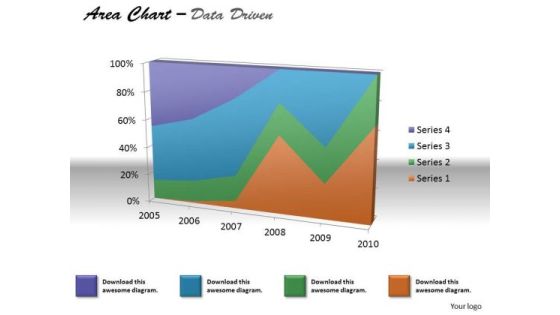
Financial Data Analysis Area Chart For Various Values PowerPoint Templates
Document The Process On Our financial data analysis area chart for various values Powerpoint Templates . Make A Record Of Every Detail.
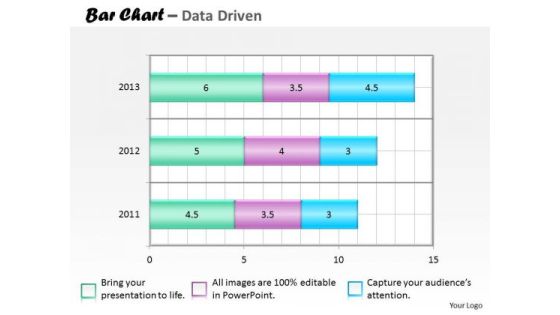
Financial Data Analysis Bar Chart For Collection Of PowerPoint Templates
Our financial data analysis bar chart for collection of Powerpoint Templates Team Are A Dogged Lot. They Keep At It Till They Get It Right.

Financial Data Analysis Currency Trading Bar Chart PowerPoint Templates
Put In A Dollop Of Our financial data analysis currency trading bar chart Powerpoint Templates . Give Your Thoughts A Distinctive Flavor.
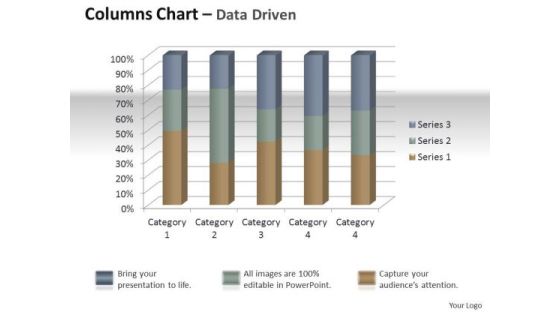
Marketing Data Analysis 3d Quality Control Of Units PowerPoint Templates
Establish Your Dominion With Our marketing data analysis 3d quality control of units Powerpoint Templates . Rule The Stage With Your Thoughts.
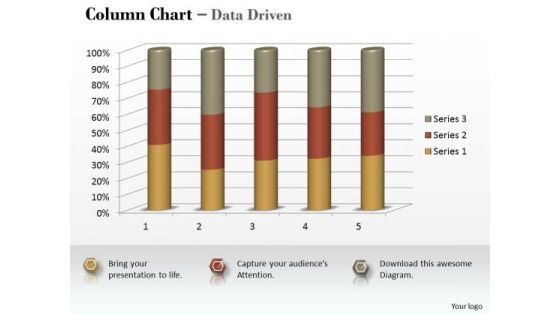
Marketing Data Analysis 3d Statistical Process Column Chart PowerPoint Templates
Be A Donor Of Great Ideas. Display Your Charity On Our marketing data analysis 3d statistical process column chart Powerpoint Templates .

Marketing Data Analysis 3d Statistical Process Control Chart PowerPoint Templates
Open Up Doors That Lead To Success. Our marketing data analysis 3d statistical process control chart Powerpoint Templates Provide The Handles.
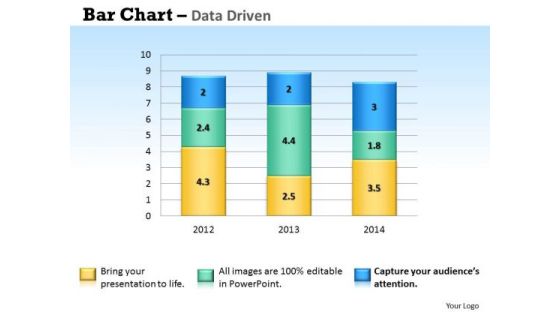
Microsoft Excel Data Analysis Bar Chart To Handle PowerPoint Templates
Our microsoft excel data analysis bar chart to handle Powerpoint Templates And Your Ideas Make A Great Doubles Pair. Play The Net With Assured Hands.

Microsoft Excel Data Analysis Bar Graph PowerPoint Templates
Double The Impact With Our microsoft excel data analysis bar graph Powerpoint Templates . Your Thoughts Will Have An Imposing Effect.

Multivariate Data Analysis Numeric Values Surface Chart PowerPoint Templates
Your Grasp Of Economics Is Well Known. Help Your Audience Comprehend Issues With Our multivariate data analysis numeric values surface chart Powerpoint Templates .
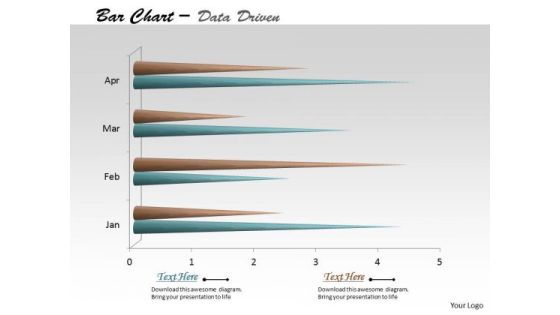
Multivariate Data Analysis Time Based Bar Chart PowerPoint Templates
Edit Your Work With Our multivariate data analysis time based bar chart Powerpoint Templates . They Will Help You Give The Final Form.
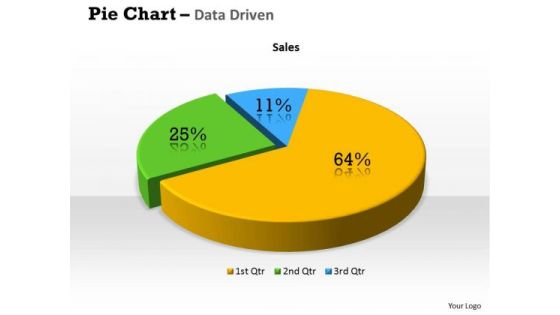
Quantitative Data Analysis 3d Percentage Ratio Pie Chart PowerPoint Templates
Plan Your Storyboard With Our quantitative data analysis 3d percentage ratio pie chart Powerpoint Templates . Give An Outline To The Solutions You Have.

Quantitative Data Analysis Bar Chart For Different Categories PowerPoint Templates
Make Some Dough With Our quantitative data analysis bar chart for different categories Powerpoint Templates . Your Assets Will Rise Significantly.

Quantitative Data Analysis Bar Chart For Financial Markets PowerPoint Templates
Draft It Out On Our quantitative data analysis bar chart for financial markets Powerpoint Templates . Give The Final Touches With Your Ideas.
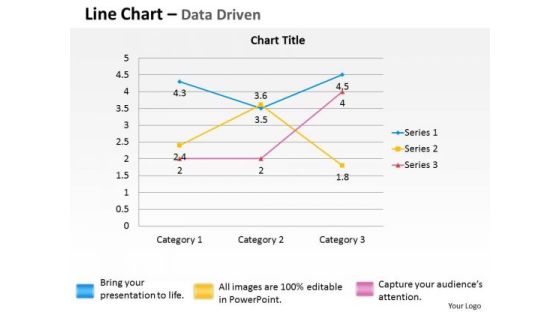
Quantitative Data Analysis Driven Economic Line Chart PowerPoint Slides Templates
Break The Deadlock With Our quantitative data analysis driven economic line chart powerpoint slides Templates . Let The Words Start To Flow.
Data Analytics IT Data Science In Healthcare Department Ppt Professional Icon PDF
This slide depicts the role of data science in healthcare departments and its benefits in different ways, such as image analysis, drug discovery, genetics and Genomics, predictive diagnosis, and NLP. Presenting data analytics it data science in healthcare department ppt professional icon pdf to provide visual cues and insights. Share and navigate important information on five stages that need your due attention. This template can be used to pitch topics like medical image analysis, drug discovery, genetics and genomics, predictive diagnosis, natural language processing. In addtion, this PPT design contains high resolution images, graphics, etc, that are easily editable and available for immediate download.

Business Data Analysis Chart Comparing Multiple Entities PowerPoint Templates
Analyze Ailments On Our business data analysis chart comparing multiple entities Powerpoint Templates. Bring Out The Thinking Doctor In You. Dock Your Thoughts With Our Financial Analysis . They Will Launch Them Into Orbit.

Application Of AI For Database Access Governance Summary PDF
This slide represents the applications of artificial intelligence systems for data access governance. The purpose of this slide is to demonstrate the AI application in secure data access. The use cases include threat detection and prediction, system configuration, adaptability, data interpretation, and predictive forecasting. Presenting Application Of AI For Database Access Governance Summary PDF to dispense important information. This template comprises five stages. It also presents valuable insights into the topics including Prediction, System Configuration, Adaptability. This is a completely customizable PowerPoint theme that can be put to use immediately. So, download it and address the topic impactfully.
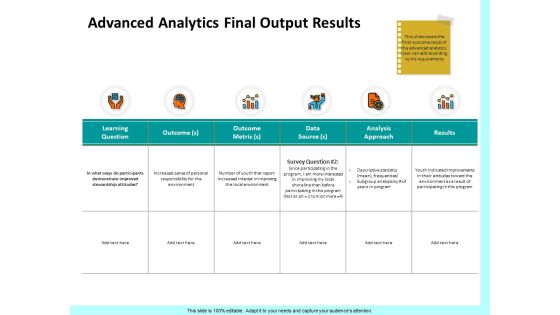
Firm Productivity Administration Advanced Analytics Final Output Results Data Rules PDF
Presenting this set of slides with name firm productivity administration advanced analytics final output results data rules pdf. The topics discussed in these slides are learning question, outcome, outcome metric, data source analysis approach, results. This is a completely editable PowerPoint presentation and is available for immediate download. Download now and impress your audience.

Data Management Maturity Chart With Capabilities Topics PDF
The slide carries a data management maturity model for effective assessment of different business capabilities. Various elements included are maturity levels and capabilities such as data management function, data policies and procedures, data management initiatives budget, etc. Pitch your topic with ease and precision using this Data Management Maturity Chart With Capabilities Topics PDF. This layout presents information on Data Management Function, Development Stage, Team. It is also available for immediate download and adjustment. So, changes can be made in the color, design, graphics or any other component to create a unique layout.
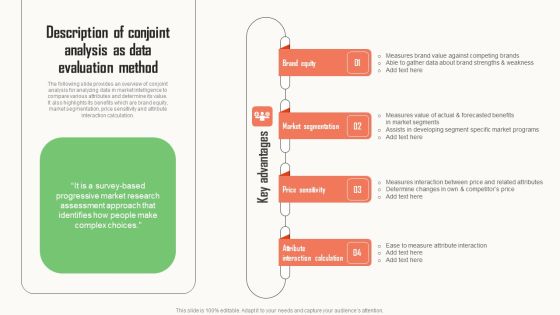
Strategic Market Insight Implementation Guide Description Of Conjoint Analysis As Data Evaluation Method Graphics PDF
The following slide provides an overview of conjoint analysis for analyzing data in market intelligence to compare various attributes and determine its value. It also highlights its benefits which are brand equity, market segmentation, price sensitivity and attribute interaction calculation. Whether you have daily or monthly meetings, a brilliant presentation is necessary. Strategic Market Insight Implementation Guide Description Of Conjoint Analysis As Data Evaluation Method Graphics PDF can be your best option for delivering a presentation. Represent everything in detail using Strategic Market Insight Implementation Guide Description Of Conjoint Analysis As Data Evaluation Method Graphics PDF and make yourself stand out in meetings. The template is versatile and follows a structure that will cater to your requirements. All the templates prepared by Slidegeeks are easy to download and edit. Our research experts have taken care of the corporate themes as well. So, give it a try and see the results.
Workforce Productivity Tracking Report Dashboard Background PDF
The given below slide depicts the KPIs of work stream status to assess progress and stagnation. It includes elements such as budget, risk, action plan, work stream timeline, highlights etc. Showcasing this set of slides titled Workforce Productivity Tracking Report Dashboard Background PDF. The topics addressed in these templates are High Technology Turnover, Workforce Health Safety Risk, Plan Employee Training. All the content presented in this PPT design is completely editable. Download it and make adjustments in color, background, font etc. as per your unique business setting.

Classical Virtual Cloud Enterprise Data Repository Types Microsoft PDF
The mentioned slide showcases different types of data warehouse depending on the bases of budget, amount of data, security issues, complexity. The slide covers classical, virtual and cloud data warehouse. Pitch your topic with ease and precision using this Classical Virtual Cloud Enterprise Data Repository Types Microsoft PDF. This layout presents information on Data Warehouse, Virtual, Cloud. It is also available for immediate download and adjustment. So, changes can be made in the color, design, graphics or any other component to create a unique layout.

Database Management Vector Icon Ppt PowerPoint Presentation Professional Format Ideas
Presenting this set of slides with name database management vector icon ppt powerpoint presentation professional format ideas. The topics discussed in these slides are data sources, database management, marketing. This is a completely editable PowerPoint presentation and is available for immediate download. Download now and impress your audience.

Five Ways To Maximize Digital Marketing Efficiency Ppt PowerPoint Presentation Summary Brochure
Presenting this set of slides with name five ways to maximize digital marketing efficiency ppt powerpoint presentation summary brochure. The topics discussed in these slides are data sources, database management, marketing. This is a completely editable PowerPoint presentation and is available for immediate download. Download now and impress your audience.

Data Assimilation Advanced Analytics Final Output Results Mean Ppt Icon Diagrams PDF
Deliver an awe inspiring pitch with this creative data assimilation advanced analytics final output results mean ppt icon diagrams pdf bundle. Topics like outcome, metric, data source, analysis approach, environment can be discussed with this completely editable template. It is available for immediate download depending on the needs and requirements of the user.
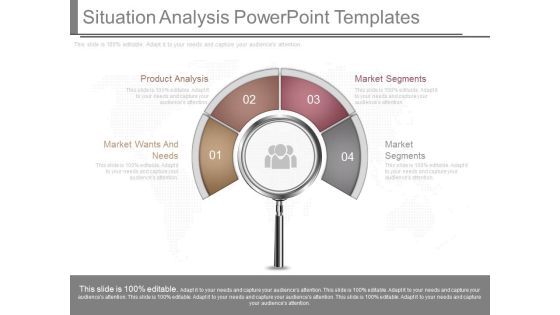
Situation Analysis Powerpoint Templates
This is a situation analysis powerpoint templates. This is a four stage process. The stages in this process are market wants and needs, product analysis, market segments.
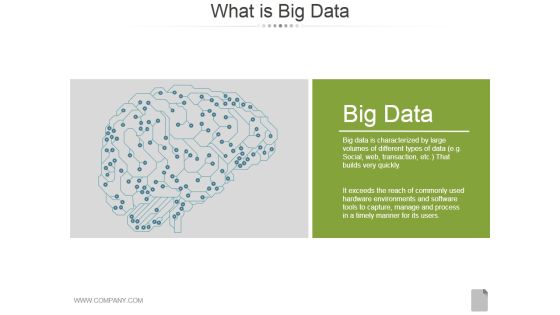
What Is Big Data Ppt PowerPoint Presentation Diagrams
This is a what is big data ppt powerpoint presentation diagrams. This is a one stage process. The stages in this process are big data, business, analysis, management, marketing.

Data Analytics Healthcare Method To Improve Clinical Performance Brochure PDF
This slide showcase the different methods of healthcare data analytics for better clinical performance. It includes methods such as descriptive, predictive, prescriptive and comparative analysis. Persuade your audience using this Data Analytics Healthcare Method To Improve Clinical Performance Brochure PDF. This PPT design covers Four stages, thus making it a great tool to use. It also caters to a variety of topics including Descriptive Analysis, Predictive Analysis, Prescriptive Analysis. Download this PPT design now to present a convincing pitch that not only emphasizes the topic but also showcases your presentation skills.

Proregression Of Analytics Predictive And Prescriptive Ppt PowerPoint Presentation Styles Inspiration Cpb
This is a proregression of analytics predictive and prescriptive ppt powerpoint presentation styles inspiration cpb. This is a four stage process. The stages in this process are data analysis, analytics architecture, analytics framework.

Data Analytics Value Stream Chain Business Analysis Modification Toolkit Summary PDF
This slide illustrates the series of activities required for analyzing the data. It contains information such as data preparation, exploratory analysis, and predictive analytics etc.This is a Data Analytics Value Stream Chain Business Analysis Modification Toolkit Summary PDF template with various stages. Focus and dispense information on six stages using this creative set, that comes with editable features. It contains large content boxes to add your information on topics like Formulate Business, Data Visualization, Classification Clustering. You can also showcase facts, figures, and other relevant content using this PPT layout. Grab it now.

Top 10 Revolutionary Solutions For Everything How Does Diffusion Model Operate While Predicting System Behavior Introduction PDF
This slide provides information regarding diffusion model that assesses and predicts system behavior and generated similar data on which it was trained. The diffusion models are integrated with AI to ensure noise removal and offer high quality images from random seeds. Formulating a presentation can take up a lot of effort and time, so the content and message should always be the primary focus. The visuals of the PowerPoint can enhance the presenters message, so our Top 10 Revolutionary Solutions For Everything How Does Diffusion Model Operate While Predicting System Behavior Introduction PDF was created to help save time. Instead of worrying about the design, the presenter can concentrate on the message while our designers work on creating the ideal templates for whatever situation is needed. Slidegeeks has experts for everything from amazing designs to valuable content, we have put everything into Top 10 Revolutionary Solutions For Everything How Does Diffusion Model Operate While Predicting System Behavior Introduction PDF

Channel Sales Performance Graph Ppt Slide Examples
This is a channel sales performance graph ppt slide examples. This is a four stage process. The stages in this process are jan, feb, mar, apr, may, jun, jul, aug, sep.

Overview Of Key Findings Ppt PowerPoint Presentation Complete Deck With Slides
Presenting this set of slides with name overview of key findings ppt powerpoint presentation complete deck with slides. The topics discussed in these slides are overview, key findings, agenda, marketing, business. This is a completely editable PowerPoint presentation and is available for immediate download. Download now and impress your audience.
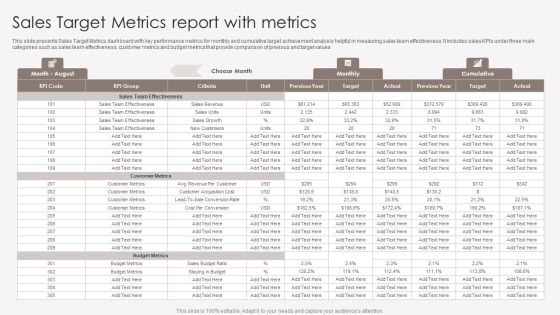
Sales Target Metrics Report With Metrics Introduction PDF
This slide presents Sales Target Metrics dashboard with key performance metrics for monthly and cumulative target achievement analysis helpful in measuring sales team effectiveness. It includes sales KPIs under three main categories such as sales team effectiveness, customer metrics and budget metrics that provide comparison of previous and target values. Pitch your topic with ease and precision using this Sales Target Metrics Report With Metrics Introduction PDF. This layout presents information on Sales Team Effectiveness, Customer Metrics, Budget Metrics. It is also available for immediate download and adjustment. So, changes can be made in the color, design, graphics or any other component to create a unique layout.
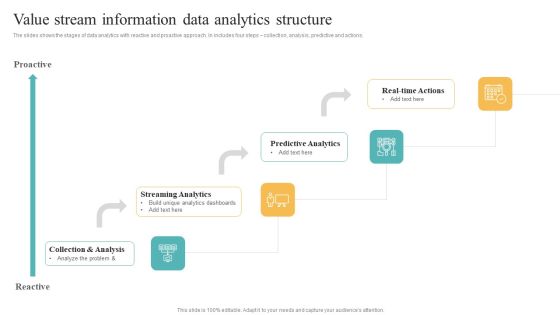
Transformation Toolkit Competitive Intelligence Information Analysis Value Stream Information Data Analytics Structure Infographics PDF
The slides shows the stages of data analytics with reactive and proactive approach. In includes four steps collection, analysis, predictive and actions. Present like a pro with Transformation Toolkit Competitive Intelligence Information Analysis Value Stream Information Data Analytics Structure Infographics PDF Create beautiful presentations together with your team, using our easy to use presentation slides. Share your ideas in real time and make changes on the fly by downloading our templates. So whether you are in the office, on the go, or in a remote location, you can stay in sync with your team and present your ideas with confidence. With Slidegeeks presentation got a whole lot easier. Grab these presentations today.

Due Diligence For M And A Analysis Icon Ppt Inspiration Graphic Images PDF
Persuade your audience using this Due Diligence For M And A Analysis Icon Ppt Inspiration Graphic Images PDF. This PPT design covers three stages, thus making it a great tool to use. It also caters to a variety of topics including Due Diligence, M And A, Analysis Icon. Download this PPT design now to present a convincing pitch that not only emphasizes the topic but also showcases your presentation skills.
System Analysis And Design Running On Browser Icon Ppt Styles Images PDF
Persuade your audience using this System Analysis And Design Running On Browser Icon Ppt Styles Images PDF. This PPT design covers three stages, thus making it a great tool to use. It also caters to a variety of topics including System, Analysis And Design, Running Browser Icon. Download this PPT design now to present a convincing pitch that not only emphasizes the topic but also showcases your presentation skills.

Data Automation Procedure Flow For Integrating Platform Ppt PowerPoint Presentation Infographic Template Vector PDF
This slide represents data automation process flow for integration platform which contains user interface and control, identify and extract, calculation, documentation, analyzing and reporting. It can be referred by IT teams to streamlining the processing methods and bring efficiency.Pitch your topic with ease and precision using this Data Automation Procedure Flow For Integrating Platform Ppt PowerPoint Presentation Infographic Template Vector PDF. This layout presents information on Recognizing Device, Component Recognition, Documentation Analyzing. It is also available for immediate download and adjustment. So, changes can be made in the color, design, graphics or any other component to create a unique layout.

Data Quality Management System With Cleaning Strategy Ppt PowerPoint Presentation File Files PDF
Presenting data quality management system with cleaning strategy ppt powerpoint presentation file files pdf to dispense important information. This template comprises four stages. It also presents valuable insights into the topics including assessment, cleaning strategy, develop data analysis metrics. This is a completely customizable PowerPoint theme that can be put to use immediately. So, download it and address the topic impactfully.

Benefits Of Predictive Analytics Cost Reduction Ppt PowerPoint Presentation Styles Sample
Presenting this set of slides with name benefits of predictive analytics cost reduction ppt powerpoint presentation styles sample. This is a three stage process. The stages in this process are big data analysis, data management, technologies segmentation. This is a completely editable PowerPoint presentation and is available for immediate download. Download now and impress your audience.

Guidebook For Executing Business Market Intelligence Description Of Conjoint Analysis As Data Professional PDF
The following slide provides an overview of conjoint analysis for analyzing data in market intelligence to compare various attributes and determine its value. It also highlights its benefits which are brand equity, market segmentation, price sensitivity and attribute interaction calculation. Create an editable Guidebook For Executing Business Market Intelligence Description Of Conjoint Analysis As Data Professional PDF that communicates your idea and engages your audience. Whether you are presenting a business or an educational presentation, pre designed presentation templates help save time. Guidebook For Executing Business Market Intelligence Description Of Conjoint Analysis As Data Professional PDF is highly customizable and very easy to edit, covering many different styles from creative to business presentations. Slidegeeks has creative team members who have crafted amazing templates. So, go and get them without any delay.
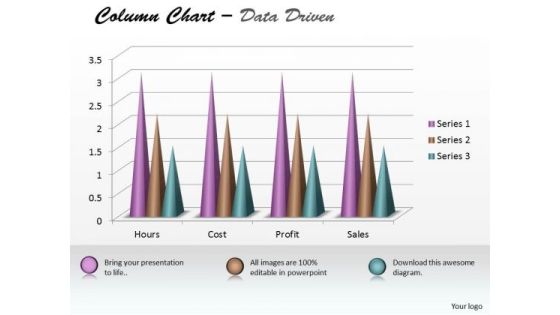
Excel Data Analysis Data Tools Data Methods Statistical Tool Survey Chart PowerPoint Templates
Analyze Ailments On Our excel data analysis data tools data methods statistical tool survey chart Powerpoint Templates . Bring Out The Thinking Doctor In You. Dock Your Thoughts With Our Excel Data Analysis . They Will Launch Them Into Orbit.

AI Logistics Management Automated Framework Themes PDF
The purpose of this slide is to showcase an automated workflow that compiles logistics data and forecasts operational outcomes by running different scenarios. Key components include plan, serve, source, deliver and make. Pitch your topic with ease and precision using this AI Logistics Management Automated Framework Themes PDF. This layout presents information on Demand Forecasting, Risk Analysis, Budget Analysis. It is also available for immediate download and adjustment. So, changes can be made in the color, design, graphics or any other component to create a unique layout.
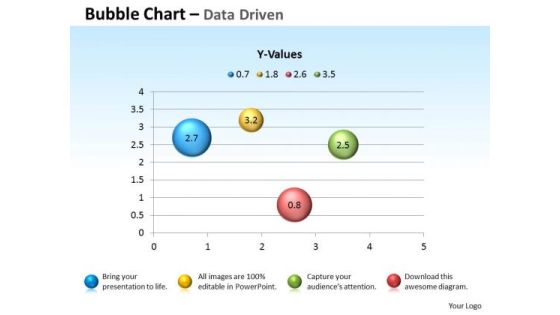
Excel Data Analysis Data Tools Data Methods Statistical Chart For Process PowerPoint Templates
Blend Your Views With Our excel data analysis data tools data methods statistical chart for process Powerpoint Templates . They Are Made For Each Other.

Excel Data Analysis Data Tools Data Methods Statistical Driven PowerPoint Slides Templates
There Is No Subject Too Dull For Our excel data analysis data tools data methods statistical driven powerpoint slides Templates . They Will Always Generate Keenness.
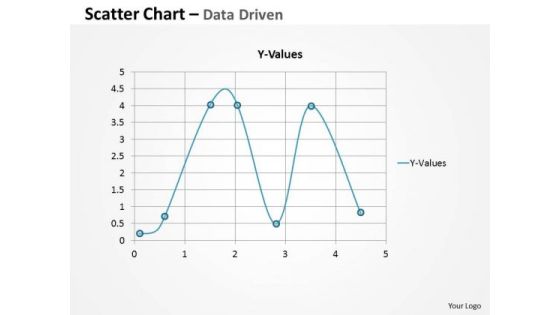
Excel Data Analysis Data Tools Data Methods Statistical Survey Driven PowerPoint Slides Templates
Ask For Assistance From Our excel data analysis data tools data methods statistical survey driven powerpoint slides Templates . You Will Be Duly Satisfied.
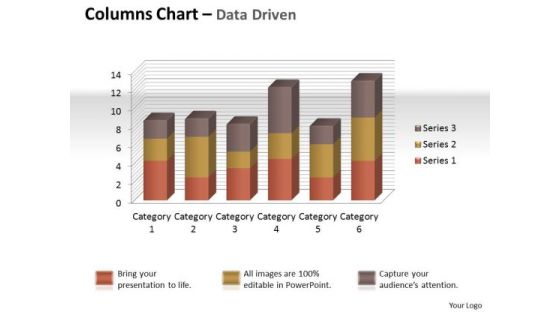
Excel Data Analysis Data Tools Data Methods Statistical Tool Chart PowerPoint Templates
Give Your Thoughts Some Durability. Coat Them With Our excel data analysis data tools data methods statistical tool chart Powerpoint Templates .
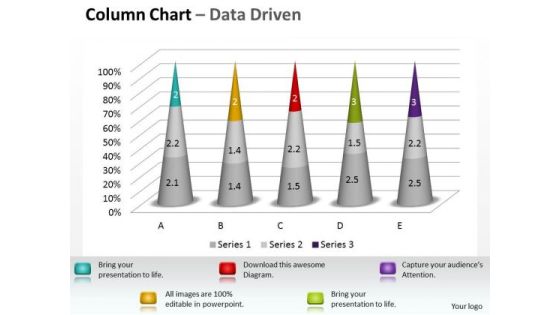
Excel Data Analysis Data Tools Data Methods Statistical Tool Survey 3d Chart PowerPoint Templates
Dumbfound Them With Our excel data analysis data tools data methods statistical tool survey 3d chart Powerpoint Templates . Your Audience Will Be Astounded With Your Ideas.

Excel Data Analysis Data Tools Data Methods Statistical Tool Survey PowerPoint Slides Templates
Get Out Of The Dock With Our excel data analysis data tools data methods statistical tool survey powerpoint slides Templates . Your Mind Will Be Set Free.

6 Step Process For Creating Data Driven Organizational Culture Background PDF
Presenting 6 step process for creating data driven organizational culture background pdf to dispense important information. This template comprises six stages. It also presents valuable insights into the topics including metrics, analysis, information. This is a completely customizable PowerPoint theme that can be put to use immediately. So, download it and address the topic impactfully.

Data Assimilation Advanced Analytics Techniques Ppt Ideas Good PDF
This is a data assimilation advanced analytics techniques ppt ideas good pdf template with various stages. Focus and dispense information on three stages using this creative set, that comes with editable features. It contains large content boxes to add your information on topics like descriptive analytics, predictive analytics, prescriptive analytics. You can also showcase facts, figures, and other relevant content using this PPT layout. Grab it now.
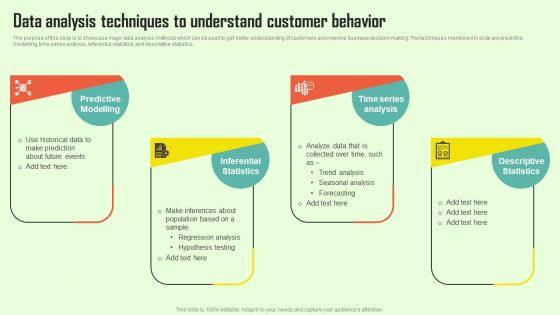
Increasing Consumer Engagement With Database Data Analysis Techniques To Understand Structure PDF
The purpose of this slide is to showcase major data analysis methods which can be used to get better understanding of customers and improve business decision making. The techniques mentioned in slide are predictive modelling, time series analysis, inferential statistics, and descriptive statistics. Want to ace your presentation in front of a live audience Our Increasing Consumer Engagement With Database Data Analysis Techniques To Understand Structure PDF can help you do that by engaging all the users towards you. Slidegeeks experts have put their efforts and expertise into creating these impeccable powerpoint presentations so that you can communicate your ideas clearly. Moreover, all the templates are customizable, and easy to edit and downloadable. Use these for both personal and commercial use.
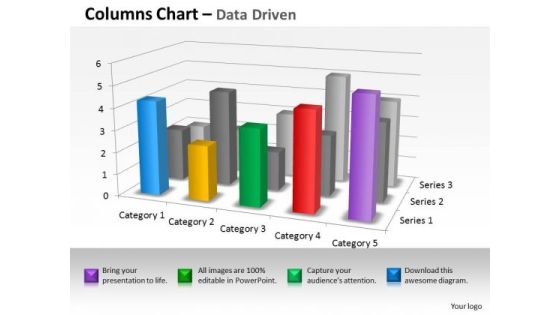
Quantitative Data Analysis 3d Interpretation Of Statistical Quality Control PowerPoint Templates
Land The Idea With Our quantitative data analysis 3d interpretation of statistical quality control Powerpoint Templates . Help It Grow With Your Thoughts.

Bar Graph For Market Analysis Ppt Samples Download
This is a bar graph for market analysis ppt samples download. This is a four stage process. The stages in this process are category.

Supplier Management For Enhanced SCM And Procurement Vendor Risk Management Process Flow Themes PDF
The following slide illustrates vendor risk management process flow. It provides information about identify outcomes, data to insight, continuous improvement, execution practices, identify metrics, etc. Deliver and pitch your topic in the best possible manner with this Supplier Management For Enhanced SCM And Procurement Vendor Risk Management Process Flow Themes PDF. Use them to share invaluable insights on Continuous Improvement, Identify Outcomes, Identify Metrics and impress your audience. This template can be altered and modified as per your expectations. So, grab it now.

Vendor Management To Handle Purchase Vendor Risk Management Process Flow Structure PDF
The following slide illustrates vendor risk management process flow. It provides information about identify outcomes, data to insight, continuous improvement, execution practices, identify metrics, etc. Deliver and pitch your topic in the best possible manner with this Vendor Management To Handle Purchase Vendor Risk Management Process Flow Structure PDF. Use them to share invaluable insights on Identify Outcomes, Identify Metrics, Continuous Improvement and impress your audience. This template can be altered and modified as per your expectations. So, grab it now.
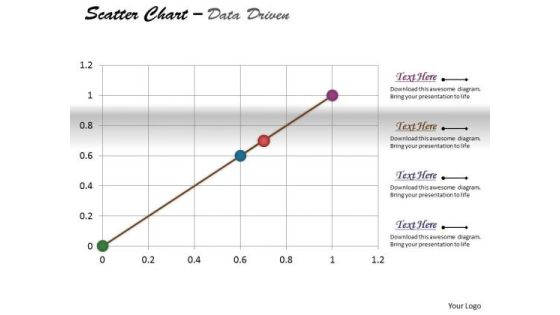
Excel Data Analysis Data Methods Statistical Tool Survey Driven PowerPoint Slides Templates
Be The Duke Of The Dais With Our excel data analysis data methods statistical tool survey driven powerpoint slides Templates . Acquire Royalty Status With Your Thoughts.

Big Data Technology For Real Estate Management Elements PDF
The slide showcases the key areas, big data technology in property management is used to drive Proptech disruption and efficiency of running a business. It covers better analytics, precise property evaluations, improved home prospecting and marketing, data-driven property development and digitalization of back-office processes. Presenting Big Data Technology For Real Estate Management Elements PDF to dispense important information. This template comprises five stages. It also presents valuable insights into the topics including Precise Property Evaluation, Performs Predictive Analysis, Development Opportunities. This is a completely customizable PowerPoint theme that can be put to use immediately. So, download it and address the topic impactfully.

Data Driven Insurance Sales Procedure Boosting Revenue Sample PDF
The following slide highlights insurance sales cycle based on data for predictive analysis and real-time insights. It boost company sales. It includes components such as integrate front and back office, customer centric sales and improve renewal rates. Persuade your audience using this Data Driven Insurance Sales Procedure Boosting Revenue Sample PDF. This PPT design covers three stages, thus making it a great tool to use. It also caters to a variety of topics including Customer Centric Sales, Improve Renewal Rates, Revenue. Download this PPT design now to present a convincing pitch that not only emphasizes the topic but also showcases your presentation skills

Transformation Toolkit Competitive Intelligence Information Analysis Data Analytics Value Stream Chain Portrait PDF
This slide illustrates the series of activities required for analyzing the data. It contains information such as data preparation, exploratory analysis, and predictive analytics etc. Find highly impressive Transformation Toolkit Competitive Intelligence Information Analysis Data Analytics Value Stream Chain Portrait PDF on Slidegeeks to deliver a meaningful presentation. You can save an ample amount of time using these presentation templates. No need to worry to prepare everything from scratch because Slidegeeks experts have already done a huge research and work for you. You need to download Transformation Toolkit Competitive Intelligence Information Analysis Data Analytics Value Stream Chain Portrait PDF for your upcoming presentation. All the presentation templates are 100 percent editable and you can change the color and personalize the content accordingly. Download now.

Business Checklist For Financial Budget Allocation Within Departments Summary PDF
This slide represents the financial budget allocation checklist to evaluate department. It includes various question related to the strategies that are either implemented in an organisation for growth. Deliver an awe inspiring pitch with this creative Business Checklist For Financial Budget Allocation Within Departments Summary PDF bundle. Topics like Document Financial, Data Budget, Spreadsheet Develop can be discussed with this completely editable template. It is available for immediate download depending on the needs and requirements of the user.

Steps Of Continuous Process Business Improvement Action Plan Formats PDF
The slide covers various steps of continuous improvement plan to ensure enhancing customer satisfaction. Various steps included are define, measure, analyse and improve. Presenting Steps Of Continuous Process Business Improvement Action Plan Formats PDF to dispense important information. This template comprises Two stages. It also presents valuable insights into the topics including Comparison Metrics, Data Gathering, Cause And Effect. This is a completely customizable PowerPoint theme that can be put to use immediately. So, download it and address the topic impactfully.

Financial Development Analysis Ppt Ideas
This is a financial development analysis ppt ideas. This is a twelve stage process. The stages in this process are business infographic.

Big Data In Data Warehouse Ppt PowerPoint Presentation Infographic Template
This is a big data in data warehouse ppt powerpoint presentation infographic template. This is a one stage process. The stages in this process are business, data, marketing, analysis, strategy, management.

Transformation Toolkit Competitive Intelligence Information Analysis Data Analytics Software Features Template PDF
This slide represents the key features of predictive data analytics including data mining, data visualization, and modelling etc. Coming up with a presentation necessitates that the majority of the effort goes into the content and the message you intend to convey. The visuals of a PowerPoint presentation can only be effective if it supplements and supports the story that is being told. Keeping this in mind our experts created Transformation Toolkit Competitive Intelligence Information Analysis Data Analytics Software Features Template PDF to reduce the time that goes into designing the presentation. This way, you can concentrate on the message while our designers take care of providing you with the right template for the situation.

Dashboard Program Ppt Presentation Powerpoint
This is a dashboard program ppt presentation powerpoint. This is a six stage process. The stages in this process are tasks, progress, matrix, resource, utilization, time, safety, progress, sales rate.
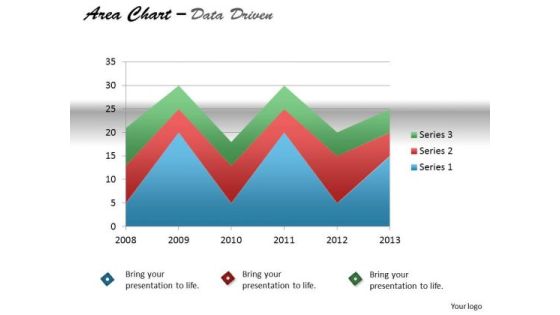
Quantitative Data Analysis Driven Display Series With Area Chart PowerPoint Slides Templates
Our quantitative data analysis driven display series with area chart powerpoint slides Templates Enjoy Drama. They Provide Entertaining Backdrops.

Financial Modelling Growth Reporting Workflow Formats PDF
This slide shows financial modelling report development workflow for forecasting the future ups and downs for business. It include steps such as considering historical data, analyzing historical performance and gathering future assumptions etc. Pitch your topic with ease and precision using this Financial Modelling Growth Reporting Workflow Formats PDF. This layout presents information on Forecast Financial Statements, Risk Assessment, Forecasting Assumptions. It is also available for immediate download and adjustment. So, changes can be made in the color, design, graphics or any other component to create a unique layout.

Global Integration Of Sales And Operations Process Professional PDF
This slide provides the sales and operations process of enterprises that are running their businesses on a global scale to assist them with the planning of their organizational functions. The key elements are month end data, inputs, corporate strategic plan, forecasted output and results . Showcasing this set of slides titled Global Integration Of Sales And Operations Process Professional PDF. The topics addressed in these templates are Corporate Strategic, Forecasted Output, Forecasted Statistics. All the content presented in this PPT design is completely editable. Download it and make adjustments in color, background, font etc. as per your unique business setting.

Competitive Environment Analysis Ppt Images
This is a competitive environment analysis ppt images. This is a four stage process. The stages in this process are engagement, brand, monthly, weekly, x, y.

Business Diagram Colored Column Chart For Result Analysis PowerPoint Slide
This Power Point diagram has been designed with graphic of column chart. It contains diagram of bar char depicting annual business progress report. Use this diagram to build professional presentations for your viewers.

Comprehensive Customer Data Platform Guide Optimizing Promotional Initiatives Perform Comparative Analysis Vendor Background PDF
The following slide showcases the comparative assessment of various vendors to gain better value and support. It includes elements such as predictive analysis, real time behavior, supports digital marketing, personalization, recommendations, loyalty management etc. Slidegeeks is one of the best resources for PowerPoint templates. You can download easily and regulate Comprehensive Customer Data Platform Guide Optimizing Promotional Initiatives Perform Comparative Analysis Vendor Background PDF for your personal presentations from our wonderful collection. A few clicks is all it takes to discover and get the most relevant and appropriate templates. Use our Templates to add a unique zing and appeal to your presentation and meetings. All the slides are easy to edit and you can use them even for advertisement purposes.
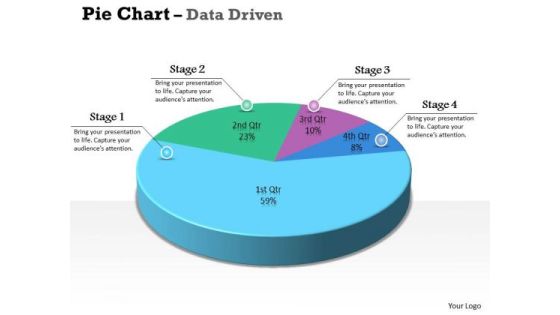
Data Analysis Excel 3d Pie Chart For Marketing Process PowerPoint Templates
Our data analysis excel 3d pie chart for marketing process Powerpoint Templates Team Are A Dogged Lot. They Keep At It Till They Get It Right.
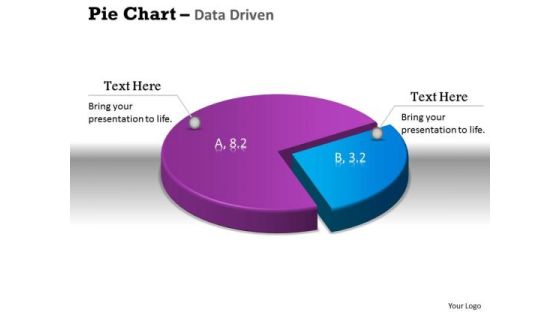
Data Analysis Excel 3d Pie Chart Shows Relative Size Of PowerPoint Templates
Get The Doers Into Action. Activate Them With Our data analysis excel 3d pie chart shows relative size of Powerpoint Templates.

Data Analysis Excel Driven Percentage Breakdown Pie Chart PowerPoint Slides Templates
Be A Donor Of Great Ideas. Display Your Charity On Our data analysis excel driven percentage breakdown pie chart powerpoint slides Templates.

Data Analysis Excel Driven Pie Chart For Business Stratregy PowerPoint Slides Templates
Open Up Doors That Lead To Success. Our data analysis excel driven pie chart for business stratregy powerpoint slides Templates Provide The Handles.
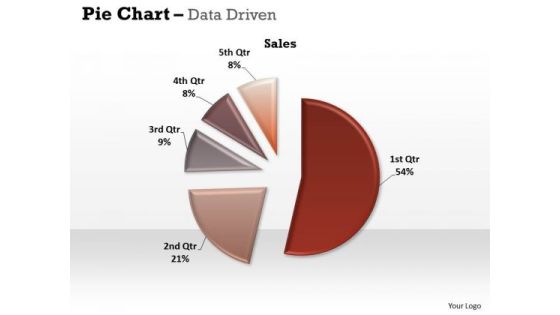
Data Analysis Excel Driven Pie Chart For Easy Comparison PowerPoint Slides Templates
Our data analysis excel driven pie chart for easy comparison powerpoint slides Templates Abhor Doodling. They Never Let The Interest Flag.
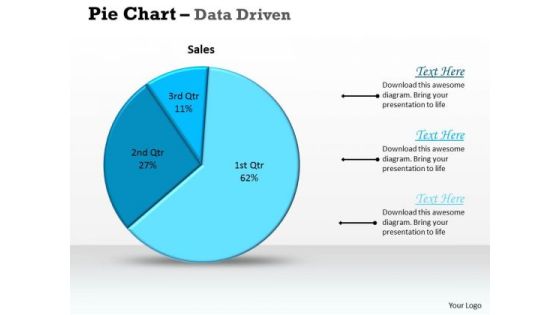
Data Analysis Excel Driven Pie Chart For Sales Process PowerPoint Slides Templates
Deliver The Right Dose With Our data analysis excel driven pie chart for sales process powerpoint slides Templates . Your Ideas Will Get The Correct Illumination.
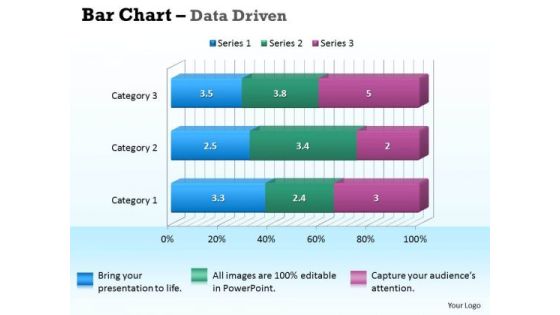
Data Analysis In Excel 3d Bar Chart For Business Information PowerPoint Templates
Our data analysis in excel 3d bar chart for business information Powerpoint Templates Deliver At Your Doorstep. Let Them In For A Wonderful Experience.
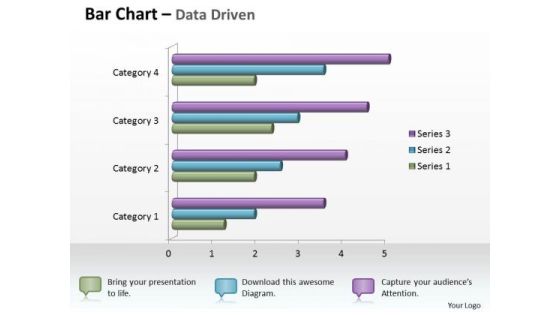
Data Analysis In Excel 3d Bar Chart For Business Statistics PowerPoint Templates
Knock On The Door To Success With Our data analysis in excel 3d bar chart for business statistics Powerpoint Templates . Be Assured Of Gaining Entry.

Data Analysis In Excel 3d Bar Chart For Business Trends PowerPoint Templates
Connect The Dots With Our data analysis in excel 3d bar chart for business trends Powerpoint Templates . Watch The Whole Picture Clearly Emerge.

Data Analysis In Excel 3d Bar Chart For Comparison Of Time Series PowerPoint Templates
Double Your Chances With Our data analysis in excel 3d bar chart for comparison of time series Powerpoint Templates . The Value Of Your Thoughts Will Increase Two-Fold.
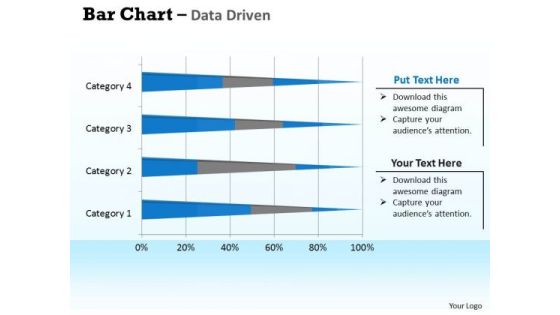
Data Analysis In Excel 3d Bar Chart For Interpretation PowerPoint Templates
Double Up Our data analysis in excel 3d bar chart for interpretation Powerpoint Templates With Your Thoughts. They Will Make An Awesome Pair.
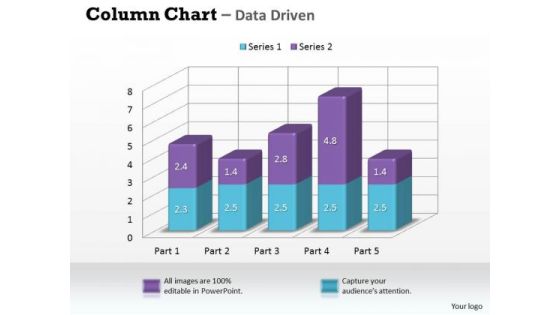
Data Analysis In Excel 3d Column Chart For Market Surveys PowerPoint Templates
Our data analysis in excel 3d column chart for market surveys Powerpoint Templates Leave No One In Doubt. Provide A Certainty To Your Views.

Data Analysis In Excel 3d Column Chart For Sets Of Information PowerPoint Templates
Double The Impact With Our data analysis in excel 3d column chart for sets of information Powerpoint Templates . Your Thoughts Will Have An Imposing Effect.
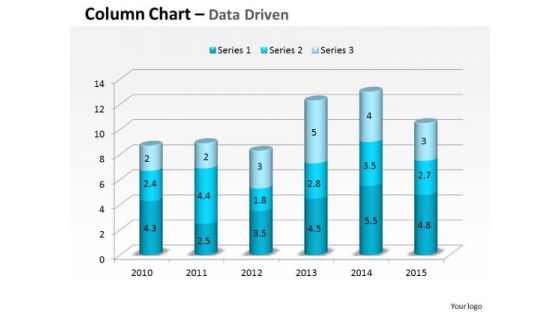
Data Analysis In Excel 3d Compare Yearly Business Performance PowerPoint Templates
Plan For All Contingencies With Our data analysis in excel 3d compare yearly business performance Powerpoint Templates . Douse The Fire Before It Catches.
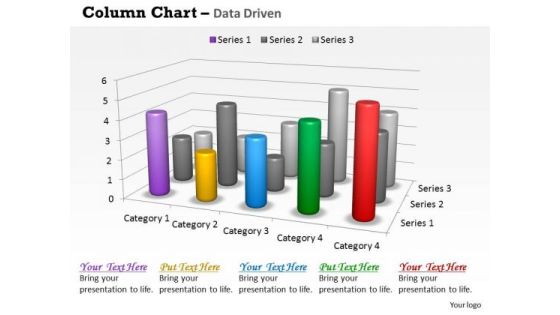
Data Analysis In Excel 3d Survey For Sales Chart PowerPoint Templates
Good Camaraderie Is A Key To Teamwork. Our data analysis in excel 3d survey for sales chart Powerpoint Templates Can Be A Cementing Force.
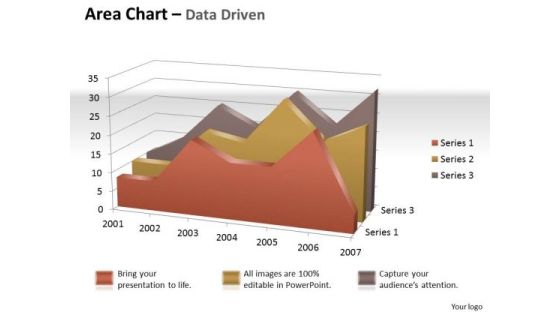
Data Analysis In Excel 3d Visual Display Of Area Chart PowerPoint Templates
Brace Yourself, Arm Your Thoughts. Prepare For The Hustle With Our data analysis in excel 3d visual display of area chart Powerpoint Templates .

Data Analysis In Excel Area Chart For Business Process PowerPoint Templates
Your Grasp Of Economics Is Well Known. Help Your Audience Comprehend Issues With Our data analysis in excel area chart for business process Powerpoint Templates .
 Home
Home