Project Kpi
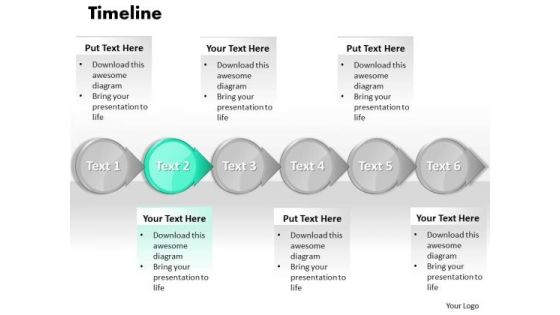
Ppt PowerPoint Slide Numbers A Procedure Or Timeline 2007 Templates
PPT powerpoint slide numbers a procedure or timeline 2007 Templates-This image represents the concept of structured analysis technique that employs a set of visual representations of the data that moves through the organization. This template is specifically designed to highlight you points. Organize your thoughts and illuminate your ideas accordingly-PPT powerpoint slide numbers a procedure or timeline 2007 Templates-Account, Arrow, Arrows, Away, Box, Business, Chart, Choice, Choose, Concept, Concepts, Consultation, Corporate, Design, Diagram, Direction, Elements, Flow, Follow, Follows, Future, Group, Grow, Increase, Lines, Many, Month, Move, Past, Period, Phase, Project, Report, Rise, Row, Step, Success, Text, Time, Timeline, Today, Up, Way, Ways, Work, Year

Comparative Assessment Of Software To Reduce Financial Challenges Icons PDF
Following slide demonstrates financial software comparative analysis conducted by managers to determine best tools for overcoming financial challenges. It includes key elements such as software solutions, financial pain points, rating, pricing and comments. Showcasing this set of slides titled Comparative Assessment Of Software To Reduce Financial Challenges Icons PDF. The topics addressed in these templates are Data Management, Financial Reporting, Financial Planning, Cash Flow Projection. All the content presented in this PPT design is completely editable. Download it and make adjustments in color, background, font etc. as per your unique business setting.
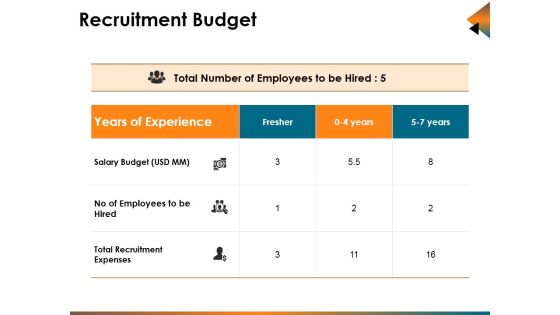
Recruitment Budget Ppt PowerPoint Presentation Infographics Guide
This is a recruitment budget ppt powerpoint presentation infographics guide. This is a three stage process. The stages in this process are years of experience, salary budget, no of employees to be hired, total recruitment expenses.
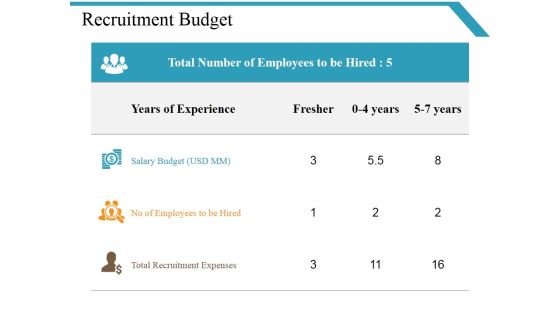
Recruitment Budget Ppt PowerPoint Presentation Model Skills
This is a recruitment budget ppt powerpoint presentation model skills. This is a three stage process. The stages in this process are years of experience, salary budget, no of employees to be hired, total recruitment expenses.

Budgeting Template Ppt PowerPoint Presentation Show Template
This is a budgeting template ppt powerpoint presentation show template. This is a three stage process. The stages in this process are business, marketing, finance, planning, tables.

Internal And External Business Environment Analysis SWOT Analysis For Scoring Environmental Factors Inspiration PDF
This slide shows SWOT analysis to prioritize key internal and external environmental factors for business environmental impact analysis Presenting internal and external business environment analysis swot analysis for scoring environmental factors inspiration pdf to provide visual cues and insights. Share and navigate important information on one stage that need your due attention. This template can be used to pitch topics like performance tracking systems, forecasting capabilities, purchasing power In addtion, this PPT design contains high resolution images, graphics, etc, that are easily editable and available for immediate download.

Budgeting Template Ppt PowerPoint Presentation Styles Pictures
This is a budgeting template ppt powerpoint presentation styles pictures. This is a three stage process. The stages in this process are public relations, web marketing, advertising, press release development, review program.

Brand Budgeting Ppt PowerPoint Presentation Pictures Slides
This is a brand budgeting ppt powerpoint presentation pictures slides. This is a seven stage process. The stages in this process are name development, brand mark, core brand presentation, advertising, social media.

Budgeting Template Ppt PowerPoint Presentation Gallery Inspiration
This is a budgeting template ppt powerpoint presentation gallery inspiration. This is a three stage process. The stages in this process are public relations, web marketing, advertising, press release development, microsoft as program.

Predictive Analytics In The Age Of Big Data Uses Of Predictive Analytics Underwriting Sample PDF
This slide represents the application of predictive analytics in underwriting by insurance companies. Predictive analytics help them identify future claims by analyzing policyholders historical data patterns and existing risk collection. Do you have an important presentation coming up Are you looking for something that will make your presentation stand out from the rest Look no further than Predictive Analytics In The Age Of Big Data Uses Of Predictive Analytics Underwriting Sample PDF. With our professional designs, you can trust that your presentation will pop and make delivering it a smooth process. And with Slidegeeks, you can trust that your presentation will be unique and memorable. So why wait Grab Predictive Analytics In The Age Of Big Data Uses Of Predictive Analytics Underwriting Sample PDF today and make your presentation stand out from the rest.

Predictive Data Model Applications Of Predictive Analytics Fraud Detection Microsoft PDF
This slide represents the application of predictive analytics in fraud detection in various industries. Predictive analytics help combat these frauds by sifting through large amounts of information and submitting the suspicious ones to the investigation teams. Get a simple yet stunning designed Predictive Data Model Applications Of Predictive Analytics Fraud Detection Microsoft PDF. It is the best one to establish the tone in your meetings. It is an excellent way to make your presentations highly effective. So, download this PPT today from Slidegeeks and see the positive impacts. Our easy-to-edit Predictive Data Model Applications Of Predictive Analytics Fraud Detection Microsoft PDF can be your go-to option for all upcoming conferences and meetings. So, what are you waiting for Grab this template today.

Calculate Facebook Key Performance Indicator Ppt PowerPoint Presentation Complete Deck With Slides
This complete deck acts as a great communication tool. It helps you in conveying your business message with personalized sets of graphics, icons etc. Comprising a set of eleven slides, this complete deck can help you persuade your audience. It also induces strategic thinking as it has been thoroughly researched and put together by our experts. Not only is it easily downloadable but also editable. The color, graphics, theme any component can be altered to fit your individual needs. So grab it now.

Graphical Exploratory Data Analysis Powerpoint Slides Clipart
This is a graphical exploratory data analysis powerpoint slides clipart. This is a five stage process. The stages in this process are techniques, information, predictive, focuses, business.

Predictive Data Model Table Of Contents Mockup PDF
Present like a pro with Predictive Data Model Table Of Contents Mockup PDF Create beautiful presentations together with your team, using our easy-to-use presentation slides. Share your ideas in real-time and make changes on the fly by downloading our templates. So whether you are in the office, on the go, or in a remote location, you can stay in sync with your team and present your ideas with confidence. With Slidegeeks presentation got a whole lot easier. Grab these presentations today.

Predictive Analytics In The Age Of Big Data Predictive Analytics In Marketing Automation Ideas PDF
This slide talks about marketing automation by predictive analytics, and this will reshape the market industry. It also includes how this process will work and how automatic systems will detect the searched keywords and will inform the sales team about the leads in the funnel when they will make any social activity. The Predictive Analytics In The Age Of Big Data Predictive Analytics In Marketing Automation Ideas PDF is a compilation of the most recent design trends as a series of slides. It is suitable for any subject or industry presentation, containing attractive visuals and photo spots for businesses to clearly express their messages. This template contains a variety of slides for the user to input data, such as structures to contrast two elements, bullet points, and slides for written information. Slidegeeks is prepared to create an impression.

Table Of Contents Predictive Data Model Slides PDF
Coming up with a presentation necessitates that the majority of the effort goes into the content and the message you intend to convey. The visuals of a PowerPoint presentation can only be effective if it supplements and supports the story that is being told. Keeping this in mind our experts created Table Of Contents Predictive Data Model Slides PDF to reduce the time that goes into designing the presentation. This way, you can concentrate on the message while our designers take care of providing you with the right template for the situation.

Predictive Data Model Predictive Analytics In Finding Better Customer Leads Sample PDF
This slide represents how predictive analytics can help the marketing industry find better customer leads and can be used in ad targeting, suggestive copywriting, lead prospecting, and targeted sales conversations. Slidegeeks has constructed Predictive Data Model Predictive Analytics In Finding Better Customer Leads Sample PDF after conducting extensive research and examination. These presentation templates are constantly being generated and modified based on user preferences and critiques from editors. Here, you will find the most attractive templates for a range of purposes while taking into account ratings and remarks from users regarding the content. This is an excellent jumping-off point to explore our content and will give new users an insight into our top-notch PowerPoint Templates.

Predictive Data Model Timeline For Predictive Analytics Model Development Elements PDF
This slide depicts the roadmap for predictive analytics model development, including describing the project, information collection, information analysis, statistics, modeling, implementation of the model, and model monitoring. Do you have an important presentation coming up Are you looking for something that will make your presentation stand out from the rest Look no further than Predictive Data Model Timeline For Predictive Analytics Model Development Elements PDF. With our professional designs, you can trust that your presentation will pop and make delivering it a smooth process. And with Slidegeeks, you can trust that your presentation will be unique and memorable. So why wait Grab Predictive Data Model Timeline For Predictive Analytics Model Development Elements PDF today and make your presentation stand out from the rest
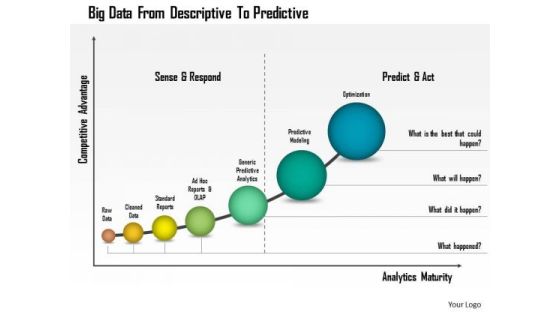
Business Diagram Big Data From Descriptive To Predictive Presentation Template
This business diagram has been designed with graphic of linear bar graph. This growing bar graph depicts the concept of big data analysis. Use this professional diagram for your financial and business analysis.
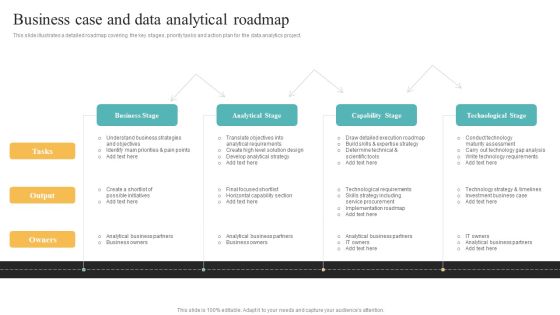
Transformation Toolkit Competitive Intelligence Information Analysis Business Case And Data Analytical Roadmap Microsoft PDF
This slide illustrates a detailed roadmap covering the key stages, priority tasks and action plan for the data analytics project. Get a simple yet stunning designed Transformation Toolkit Competitive Intelligence Information Analysis Business Case And Data Analytical Roadmap Microsoft PDF. It is the best one to establish the tone in your meetings. It is an excellent way to make your presentations highly effective. So, download this PPT today from Slidegeeks and see the positive impacts. Our easy to edit Transformation Toolkit Competitive Intelligence Information Analysis Business Case And Data Analytical Roadmap Microsoft PDF can be your go to option for all upcoming conferences and meetings. So, what are you waiting for Grab this template today.
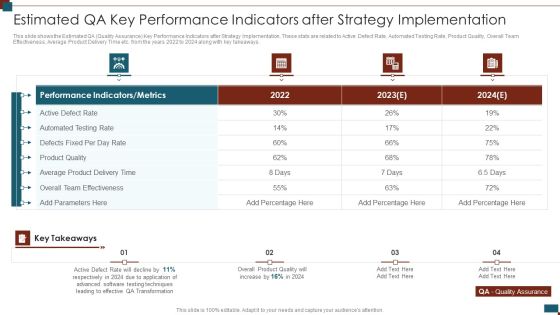
Successful Quality Assurance Transition Techniques To Enhance Product Quality Estimated Qa Key Performance Indicators Slides PDF
This slide shows the Estimated QA Quality Assurance Key Performance Indicators after Strategy Implementation. These stats are related to Active Defect Rate, Automated Testing Rate, Product Quality, Overall Team Effectiveness, Average Product Delivery Time etc. from the years 2022 to 2024 along with key takeaways. Deliver an awe inspiring pitch with this creative successful quality assurance transition techniques to enhance product quality estimated qa key performance indicators slides pdf bundle. Topics like estimated qa key performance indicators after strategy implementation can be discussed with this completely editable template. It is available for immediate download depending on the needs and requirements of the user.
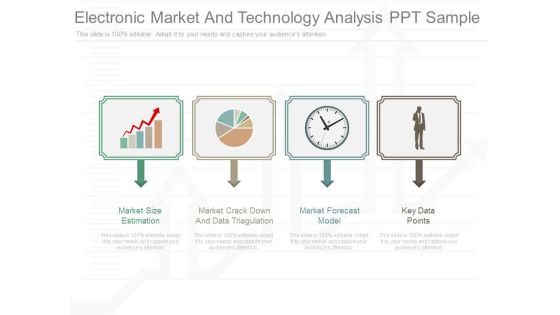
Electronic Market And Technology Analysis Ppt Sample
This is a electrnic market and technology analysis ppt sample. This is a four stage process. The stages in this process are market size estimation, market crack down and data triagulation, market forecast model, key data points.

Data Analytics Work Streams With Its Roles And Responsibilities Rules PDF
This slide highlights the key responsibilities, data work streams and. and data head roles for constructing data analytics project. Here you can discover an assortment of the finest PowerPoint and Google Slides templates. With these templates, you can create presentations for a variety of purposes while simultaneously providing your audience with an eye catching visual experience. Download Data Analytics Work Streams With Its Roles And Responsibilities Rules PDF to deliver an impeccable presentation. These templates will make your job of preparing presentations much quicker, yet still, maintain a high level of quality. Slidegeeks has experienced researchers who prepare these templates and write high quality content for you. Later on, you can personalize the content by editing the Data Analytics Work Streams With Its Roles And Responsibilities Rules PDF.

Estimated Sales Key Performance Indicators In The Company After Strategy Implementation Mockup PDF
This slide shows the future estimated Sales Key Performance Indicators of the company after adopting strategy. These stats are related to Sales Growth, Average Sales Cycle Length, Profit Margin, Customer Churn Rate, Overall Company Sales etc. from the years 2020 to 2022 along with key takeaways. Deliver an awe inspiring pitch with this creative estimated sales key performance indicators in the company after strategy implementation mockup pdf bundle. Topics like performance indicators, sales growth, profit margin, overall company sales, 2020 2022 can be discussed with this completely editable template. It is available for immediate download depending on the needs and requirements of the user.

Deploying Quality Assurance QA Transformation Estimated QA Key Performance Indicators Ideas PDF
This slide shows the estimated QA quality assurance key performance indicators after strategy implementation. These stats are related to active defect rate, automated testing rate, product quality, overall team effectiveness, average product delivery time etc. From the years 2020 to 2022 along with key takeaways.Deliver and pitch your topic in the best possible manner with this Deploying Quality Assurance QA Transformation Estimated QA Key Performance Indicators Ideas PDF Use them to share invaluable insights on Performance Indicators, Automated Testing, Overall Team Effectiveness and impress your audience. This template can be altered and modified as per your expectations. So, grab it now.
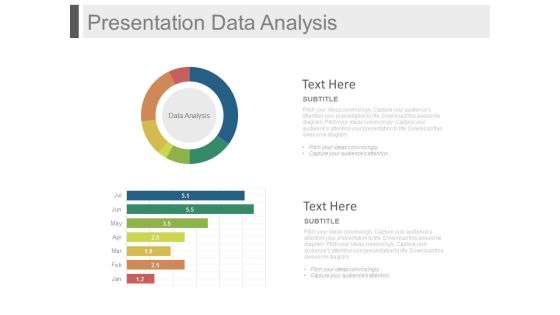
Presentation Data Analysis Ppt Slides
This is a presentation data analysis ppt slides. This is a two stage process. The stages in this process are business, finance, marketing.

Business Intelligence And Big Data Analytics Data Analytics Business Case And Roadmap Template PDF
This slide shows the business processes and key deliverables for developing the data analytics BI project. It starts with assessing and document the current state to identify priorities, analyse the process and ends at developing roadmap to achieve the outcomes. This is a business intelligence and big data analytics data analytics business case and roadmap template pdf template with various stages. Focus and dispense information on five stages using this creative set, that comes with editable features. It contains large content boxes to add your information on topics like current state analysis, identify business priorities, analysis user base, process analysis, roadmap brainstorming. You can also showcase facts, figures, and other relevant content using this PPT layout. Grab it now.

Consulting Diagram Business Dashboard Progress Meter Business Diagram
Be The Doer With Our Consulting Diagram Business Dashboard Progress Meter Business Diagram Powerpoint Templates. Put Your Thoughts Into Practice.
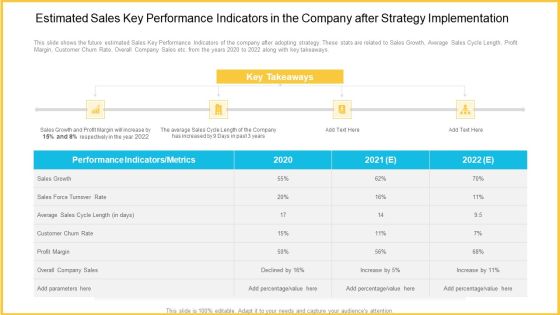
Estimated Sales Key Performance Indicators In The Company After Strategy Implementation Diagrams PDF
This slide shows the future estimated Sales Key Performance Indicators of the company after adopting strategy. These stats are related to Sales Growth, Average Sales Cycle Length, Profit Margin, Customer Churn Rate, Overall Company Sales etc. from the years 2020 to 2022 along with key takeaways. Deliver an awe-inspiring pitch with this creative estimated sales key performance indicators in the company after strategy implementation diagrams pdf. bundle. Topics like sales growth, sales force turnover rate, customer churn rate, profit margin, overall company sales can be discussed with this completely editable template. It is available for immediate download depending on the needs and requirements of the user.
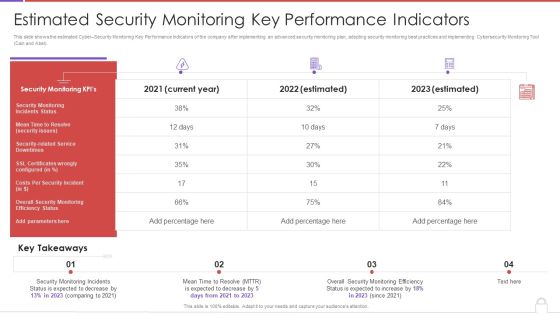
Methods To Develop Advanced Estimated Security Monitoring Key Performance Indicators Structure PDF
This slide shows the estimated Cyber Security Monitoring Key Performance Indicators of the company after implementing an advanced security monitoring plan, adopting security monitoring best practices and implementing Cybersecurity Monitoring Tool Cain and Abel. Deliver an awe inspiring pitch with this creative methods to develop advanced estimated security monitoring key performance indicators structure pdf bundle. Topics like security monitoring kpis, costs per security incident can be discussed with this completely editable template. It is available for immediate download depending on the needs and requirements of the user.

Strategic Management Progress Meter Dashboard Design Marketing Diagram
Be A Donor Of Great Ideas. Display Your Charity On Our Strategic Management Progress Meter Dashboard Design Marketing Diagram Powerpoint Templates.
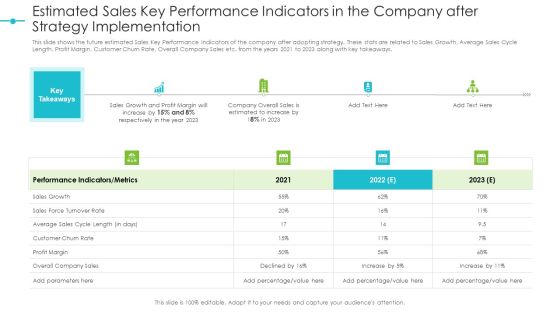
Estimated Sales Key Performance Indicators In The Company After Strategy Implementation Structure PDF
This slide shows the future estimated Sales Key Performance Indicators of the company after adopting strategy. These stats are related to Sales Growth, Average Sales Cycle Length, Profit Margin, Customer Churn Rate, Overall Company Sales etc. from the years 2021 to 2023 along with key takeaways. This is a estimated sales key performance indicators in the company after strategy implementation structure pdf template with various stages. Focus and dispense information on four stages using this creative set, that comes with editable features. It contains large content boxes to add your information on topics like performance, sales, growth, profit margin. You can also showcase facts, figures, and other relevant content using this PPT layout. Grab it now.
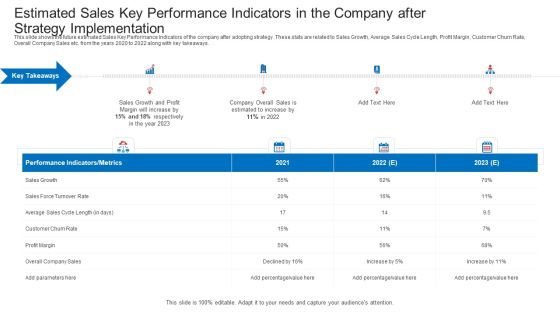
Estimated Sales Key Performance Indicators In The Company After Strategy Implementation Information PDF
This slide shows the future estimated Sales Key Performance Indicators of the company after adopting strategy. These stats are related to Sales Growth, Average Sales Cycle Length, Profit Margin, Customer Churn Rate, Overall Company Sales etc. from the years 2021 to 2023 along with key takeaways. This is a estimated sales key performance indicators in the company after strategy implementation information pdf template with various stages. Focus and dispense information on four stages using this creative set, that comes with editable features. It contains large content boxes to add your information on topics like performance, sales, growth, profit margin. You can also showcase facts, figures, and other relevant content using this PPT layout. Grab it now.

Forecast Analysis Technique IT Random Forest Technique For Classification Model Professional PDF
This slide represents the random forest technique to implement a classification model that simultaneously works on individual subsets of sample data. It also includes its working and benefits, including multiple input handling, overfitting resistance, and so on. From laying roadmaps to briefing everything in detail, our templates are perfect for you. You can set the stage with your presentation slides. All you have to do is download these easy to edit and customizable templates. Forecast Analysis Technique IT Random Forest Technique For Classification Model Professional PDF will help you deliver an outstanding performance that everyone would remember and praise you for. Do download this presentation today.
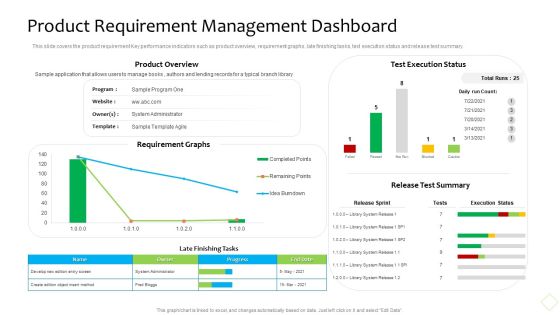
Product Demand Administration Product Requirement Management Dashboard Themes PDF
This slide covers the product requirement Key performance indicators such as product overview, requirement graphs, late finishing tasks, text execution status and release test summary. Deliver and pitch your topic in the best possible manner with this product demand administration product requirement management dashboard themes pdf. Use them to share invaluable insights on develop, progress, system and impress your audience. This template can be altered and modified as per your expectations. So, grab it now.

Budgeting Template 2 Ppt PowerPoint Presentation Portfolio Infographics
This is a budgeting template 2 ppt powerpoint presentation portfolio infographics. This is a three stage process. The stages in this process are table, cost, table, management, analysis.

Industry Analysis And Forecasts For Salon Industry Ppt PowerPoint Presentation Complete Deck With Slides
With well-researched insights and carefully-constructed design, this Industry Analysis And Forecasts For Salon Industry Ppt PowerPoint Presentation Complete Deck With Slides is all that you need for your next business meeting with clients and win them over. Add your data to graphs, charts, and tables that are already ready to display it with stunning visuals and help your audience recall your work. With this PPT Complete Deck, you will be able to display your knowledge of the subject as well as your skills as a communicator. Share your ideas and make an impact on the audience with this PowerPoint Layout and ensure that you are known as a presentation professional. Download this PPT Template Bundle to create the most interesting presentation anyone has ever seen.

Market Dynamics Ppt PowerPoint Presentation Show
This is a market dynamics ppt powerpoint presentation show. This is a four stage process. The stages in this process are competitive landscape, market opportunity description, economic outlook, market dynamics.

Cohort Assessment Metrics For Customer Retention Inspiration PDF
The following slide outlines metrics for cohort analysis aimed at helping businesses build customer relationships and loyalty by analysing actual behavioural data. It covers customer retention rate, churn rate, net incremental revenue, repeat purchase ratio and customer lifetime value. Presenting Cohort Assessment Metrics For Customer Retention Inspiration PDF to dispense important information. This template comprises five stages. It also presents valuable insights into the topics including Churn Rate, Customer Retention Rate, Net Incremental Revenue. This is a completely customizable PowerPoint theme that can be put to use immediately. So, download it and address the topic impactfully.
Social Media Budget Template Ppt PowerPoint Presentation Icon Mockup
This is a social media budget template ppt powerpoint presentation icon mockup. This is a five stage process. The stages in this process are budget category, in house expense, outsource expense, total category.

Social Media Budget Template Ppt PowerPoint Presentation Layouts Deck
This is a social media budget template ppt powerpoint presentation layouts deck. This is a four stage process. The stages in this process are budget category, writing, graphics, video, outsource expense, total category.

Recruitment Budget Ppt PowerPoint Presentation Infographic Template Brochure
This is a recruitment budget ppt powerpoint presentation infographic template brochure. This is a three stage process. The stages in this process are years of experience, fresher, salary budget, no of employees.
Information Visualizations Playbook Business Intelligence And Predictive Analytics Challenges Icons PDF
This template covers the problems while implementing BI and predictive analytics in the organization. The challenges are undefined KPIs and metrics, and unable to hire right data science talent. Presenting Information Visualizations Playbook Business Intelligence And Predictive Analytics Challenges Icons PDF to provide visual cues and insights. Share and navigate important information on two stages that need your due attention. This template can be used to pitch topics like Raw Data Organized, Security Vulnerabilities, Perform Analysis. In addtion, this PPT design contains high resolution images, graphics, etc, that are easily editable and available for immediate download.
Expenditure Assessment Icon For Budget Planning Topics PDF
Presenting Expenditure Assessment Icon For Budget Planning Topics PDF to dispense important information. This template comprises Four stages. It also presents valuable insights into the topics including Expenditure Assessment, Icon For Budget Planning. This is a completely customizable PowerPoint theme that can be put to use immediately. So, download it and address the topic impactfully.
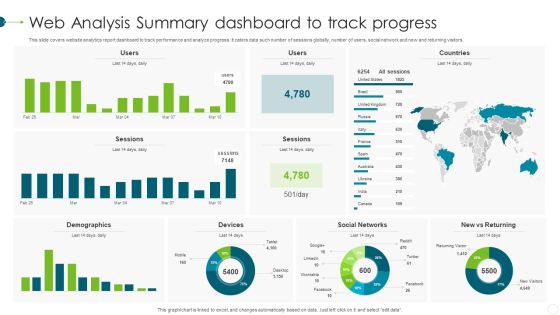
Web Analysis Summary Dashboard To Track Progress Elements PDF
This slide covers website analytics report dashboard to track performance and analyze progress. It caters data such number of sessions globally, number of users, social network and new and returning visitors. Showcasing this set of slides titled Web Analysis Summary Dashboard To Track Progress Elements PDF. The topics addressed in these templates are Demographics, Devices, Social Networks. All the content presented in this PPT design is completely editable. Download it and make adjustments in color, background, font etc. as per your unique business setting.
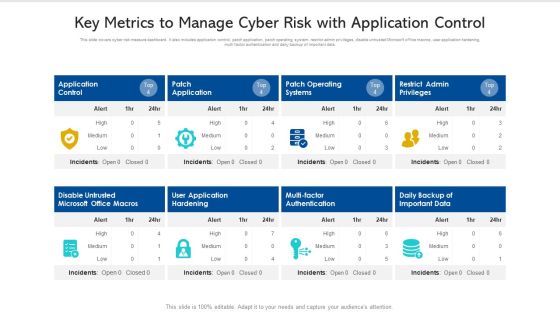
Key Metrics To Manage Cyber Risk With Application Control Ppt PowerPoint Presentation Pictures Slide PDF
This slide covers cyber risk measure dashboard. It also includes application control, patch application, patch operating system, restrict admin privileges, disable untrusted Microsoft office macros, user application hardening, multi factor authentication and daily backup of important data. Pitch your topic with ease and precision using this key metrics to manage cyber risk with application control ppt powerpoint presentation pictures slide pdf. This layout presents information on disable untrusted microsoft office macros, application control, patch operating systems. It is also available for immediate download and adjustment. So, changes can be made in the color, design, graphics or any other component to create a unique layout.

Budgeting Plan Ppt PowerPoint Presentation Show Slide Download
This is a budgeting plan ppt powerpoint presentation show slide download. This is a four stage process. The stages in this process are public relations, web marketing, advertising, press release development, review program.

Product Launch Marketing Budget Template Ppt PowerPoint Presentation Pictures Objects
This is a product launch marketing budget template ppt powerpoint presentation pictures objects. This is a four stage process. The stages in this process are public relations, web marketing, advertising, collateral.

Challenges With IT Metrics While Aligning To IT Business Values Ppt Ideas Slide Download PDF
This template covers the problems while aligning IT metrics to business values. Some of these challenges are fear of transparency, misaligned terminology, analysis lag time, labor or time intensive, etc. This is a challenges with it metrics while aligning to it business values ppt ideas slide download pdf template with various stages. Focus and dispense information on five stages using this creative set, that comes with editable features. It contains large content boxes to add your information on topics like analysis, communicate value, performance, business goals, data. You can also showcase facts, figures, and other relevant content using this PPT layout. Grab it now.
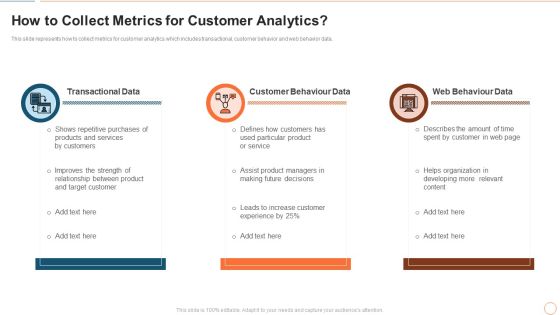
Illustrating Product Leadership Plan Incorporating Innovative Techniques How To Collect Metrics Clipart PDF
This slide represents how to collect metrics for customer analytics which includes transactional, customer behavior and web behavior data. Presenting illustrating product leadership plan incorporating innovative techniques how to collect metrics clipart pdf to provide visual cues and insights. Share and navigate important information on three stages that need your due attention. This template can be used to pitch topics like transactional data, customer behaviour data, web behaviour data. In addtion, this PPT design contains high resolution images, graphics, etc, that are easily editable and available for immediate download.

CYBER Security Breache Response Strategy Enterprise Cyber Risk Management Dashboard Summary PDF
This slide represents the key metrics dashboard representing details related to management of cyber security incidents by an enterprise. It includes key performance indicators such as risk analysis progress, risk rating breakdown etc. Are you searching for a CYBER Security Breache Response Strategy Enterprise Cyber Risk Management Dashboard Summary PDF that is uncluttered, straightforward, and original Its easy to edit, and you can change the colors to suit your personal or business branding. For a presentation that expresses how much effort you have put in, this template is ideal. With all of its features, including tables, diagrams, statistics, and lists, its perfect for a business plan presentation. Make your ideas more appealing with these professional slides. Download CYBER Security Breache Response Strategy Enterprise Cyber Risk Management Dashboard Summary PDF from Slidegeeks today.

Strategy Diagram Meter Design For Business Progress Sales Diagram
Our Strategy Diagram Meter Design For Business Progress Sales Diagram Powerpoint Templates Abhor Doodling. They Never Let The Interest Flag.

Deploying Cyber Security Incident Response Administration Enterprise Cyber Risk Management Dashboard Icons PDF
This slide represents the key metrics dashboard representing details related to management of cyber security incidents by an enterprise. It includes key performance indicators such as risk analysis progress, risk rating breakdown etc. Whether you have daily or monthly meetings, a brilliant presentation is necessary. Deploying Cyber Security Incident Response Administration Enterprise Cyber Risk Management Dashboard Icons PDF can be your best option for delivering a presentation. Represent everything in detail using Deploying Cyber Security Incident Response Administration Enterprise Cyber Risk Management Dashboard Icons PDF and make yourself stand out in meetings. The template is versatile and follows a structure that will cater to your requirements. All the templates prepared by Slidegeeks are easy to download and edit. Our research experts have taken care of the corporate themes as well. So, give it a try and see the results.
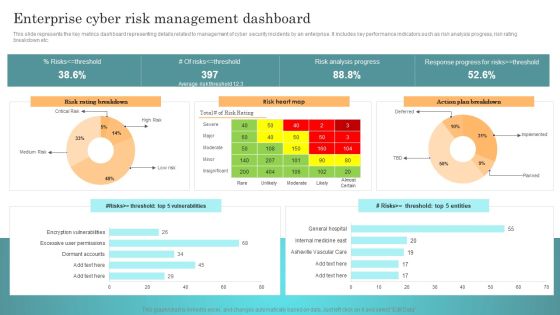
Incident Response Techniques Deployement Enterprise Cyber Risk Management Dashboard Rules PDF
This slide represents the key metrics dashboard representing details related to management of cyber security incidents by an enterprise. It includes key performance indicators such as risk analysis progress, risk rating breakdown etc. Find highly impressive Incident Response Techniques Deployement Enterprise Cyber Risk Management Dashboard Rules PDF on Slidegeeks to deliver a meaningful presentation. You can save an ample amount of time using these presentation templates. No need to worry to prepare everything from scratch because Slidegeeks experts have already done a huge research and work for you. You need to download Incident Response Techniques Deployement Enterprise Cyber Risk Management Dashboard Rules PDF for your upcoming presentation. All the presentation templates are 100 percent editable and you can change the color and personalize the content accordingly. Download now.

Functional Data Analysis To Predict Stock Market Trends Ppt PowerPoint Presentation Pictures Graphic Tips
Presenting this set of slides with name functional data analysis to predict stock market trends ppt powerpoint presentation pictures graphic tips. This is a one stage process. The stages in this process are functional data analysis to predict stock market trends. This is a completely editable PowerPoint presentation and is available for immediate download. Download now and impress your audience.

Customer Decline Of Sales Analysis Dashboard Rules PDF
The following slide presents a key performance indicating dashboards that can be used by managers in order to analyse customer-lost sales. Major key performance indicators are lost deals rate, lost sales rate, customer data analytics, etc. Pitch your topic with ease and precision using this Customer Decline Of Sales Analysis Dashboard Rules PDF. This layout presents information on Customer Data Analytics. It is also available for immediate download and adjustment. So, changes can be made in the color, design, graphics or any other component to create a unique layout.

Methods Of Data Clustering In Predictive Analytics Forward Looking Analysis IT Professional PDF
This slide outlines the two primary information clustering methods used in the predictive analytics clustering model. The methods include K-means and K-nearest neighbor clustering, including the working of both approaches.Slidegeeks is here to make your presentations a breeze with Methods Of Data Clustering In Predictive Analytics Forward Looking Analysis IT Professional PDF With our easy-to-use and customizable templates, you can focus on delivering your ideas rather than worrying about formatting. With a variety of designs to choose from, you are sure to find one that suits your needs. And with animations and unique photos, illustrations, and fonts, you can make your presentation pop. So whether you are giving a sales pitch or presenting to the board, make sure to check out Slidegeeks first.
Reinforcement Learning Techniques And Applications Performance Tracking Dashboard Reinforcement Diagrams PDF
This slide shows the roadmap for the reinforcement learning project, including the list of tasks to be performed from March 2023 to February 2024. The tasks include initializing the values table, observing the current state, choosing an action for that state, and so on. Formulating a presentation can take up a lot of effort and time, so the content and message should always be the primary focus. The visuals of the PowerPoint can enhance the presenters message, so our Reinforcement Learning Techniques And Applications Performance Tracking Dashboard Reinforcement Diagrams PDF was created to help save time. Instead of worrying about the design, the presenter can concentrate on the message while our designers work on creating the ideal templates for whatever situation is needed. Slidegeeks has experts for everything from amazing designs to valuable content, we have put everything into Reinforcement Learning Techniques And Applications Performance Tracking Dashboard Reinforcement Diagrams PDF

Key Features Of Predictive Data Analytics Software Business Analysis Modification Toolkit Graphics PDF
This slide represents the characteristics of predictive data analytics software. It includes features like predictive modeling, predictive scoring and data mining functions that help companies to get better insights.Presenting Key Features Of Predictive Data Analytics Software Business Analysis Modification Toolkit Graphics PDF to provide visual cues and insights. Share and navigate important information on five stages that need your due attention. This template can be used to pitch topics like Automate Analytics, Predictive Modeling, Automatic Preparation. In addtion, this PPT design contains high resolution images, graphics, etc, that are easily editable and available for immediate download.

Comparative Analysis Of Manufacturing Data Analytics Software Solutions Elements PDF
This slide represents the comparison between different software solutions provided for manufacturing analytics. It includes fault prediction, preventive maintenance, demand forecasting, robotization, inventory management , product development etc. Showcasing this set of slides titled Comparative Analysis Of Manufacturing Data Analytics Software Solutions Elements PDF. The topics addressed in these templates are Preventive Maintenance, Inventory Management, Risk Management. All the content presented in this PPT design is completely editable. Download it and make adjustments in color, background, font etc. as per your unique business setting.
 Home
Home