Project Kpi
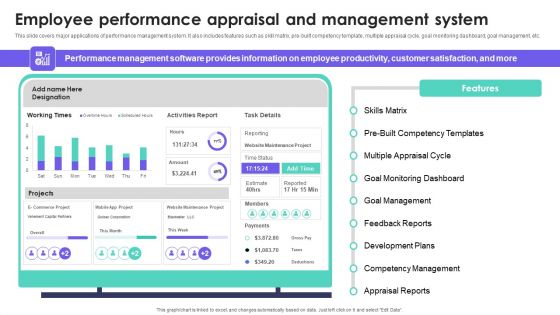
HRMS Execution Plan Employee Performance Appraisal And Management System Infographics PDF
This slide covers major applications of performance management system. It also includes features such as skill matrix, pre-built competency template, multiple appraisal cycle, goal monitoring dashboard, goal management, etc. Take your projects to the next level with our ultimate collection of HRMS Execution Plan Employee Performance Appraisal And Management System Infographics PDF. Slidegeeks has designed a range of layouts that are perfect for representing task or activity duration, keeping track of all your deadlines at a glance. Tailor these designs to your exact needs and give them a truly corporate look with your own brand colors they will make your projects stand out from the rest.
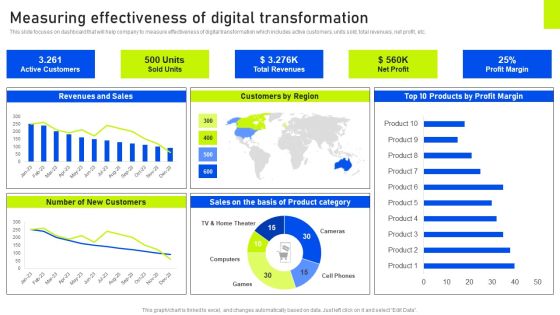
Measuring Effectiveness Of Digital Transformation Ppt Ideas Graphics Download PDF
This slide focuses on dashboard that will help company to measure effectiveness of digital transformation which includes active customers, units sold, total revenues, net profit, etc. Take your projects to the next level with our ultimate collection of Measuring Effectiveness Of Digital Transformation Ppt Ideas Graphics Download PDF. Slidegeeks has designed a range of layouts that are perfect for representing task or activity duration, keeping track of all your deadlines at a glance. Tailor these designs to your exact needs and give them a truly corporate look with your own brand colors they will make your projects stand out from the rest.

Digital Media Streaming Platform Company Profile Disney User Demographics US Diagrams PDF
The following slide highlights the segregation of Disney users based on the individual age and ethnicity for US population. It help streaming platform to develop future strategies based on demographics data analysis Take your projects to the next level with our ultimate collection of Digital Media Streaming Platform Company Profile Disney User Demographics US Diagrams PDF. Slidegeeks has designed a range of layouts that are perfect for representing task or activity duration, keeping track of all your deadlines at a glance. Tailor these designs to your exact needs and give them a truly corporate look with your own brand colors they will make your projects stand out from the rest.

CRM Application Dashboard Account Ppt Pictures Format Ideas PDF
Deliver an awe inspiring pitch with this crm application dashboard account ppt pictures format ideas pdf creative bundle. Topics like value, accounts onboarding, projects can be discussed with this completely editable template. It is available for immediate download depending on the needs and requirements of the user.

Human Resource Management Internal Training Of Employees Ppt Ideas Templates PDF
Presenting this set of slides with name human resource management internal training of employees ppt ideas templates pdf. The topics discussed in these slides are technical skills training data analysis, automation, programming, lean manufacturing training, performance management, cross functional projects handling. This is a completely editable PowerPoint presentation and is available for immediate download. Download now and impress your audience.

Pyramid Showing Key Performance Indicators For IT Department Performance Evaluation Ppt PowerPoint Presentation Show Graphics Design PDF
Persuade your audience using this pyramid showing key performance indicators for it department performance evaluation ppt powerpoint presentation show graphics design pdf. This PPT design covers five stages, thus making it a great tool to use. It also caters to a variety of topics including it roi, team attrition rate, server downtime, number of new features developed, number of projects completed. Download this PPT design now to present a convincing pitch that not only emphasizes the topic but also showcases your presentation skills.
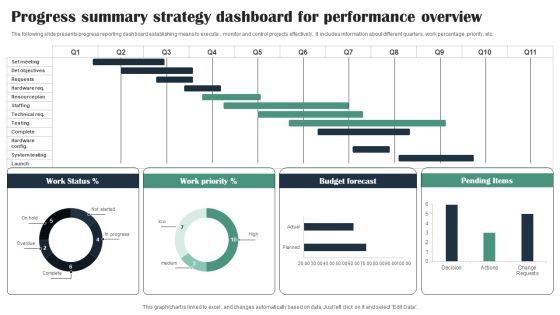
Progress Summary Strategy Dashboard For Performance Overview Diagrams PDF
The following slide presents progress reporting dashboard establishing means to execute , monitor and control projects effectively. It includes information about different quarters, work percentage, priority, etc. Showcasing this set of slides titled Progress Summary Strategy Dashboard For Performance Overview Diagrams PDF. The topics addressed in these templates are Work Status, Work Priority, Budget Forecast. All the content presented in this PPT design is completely editable. Download it and make adjustments in color, background, font etc. as per your unique business setting.
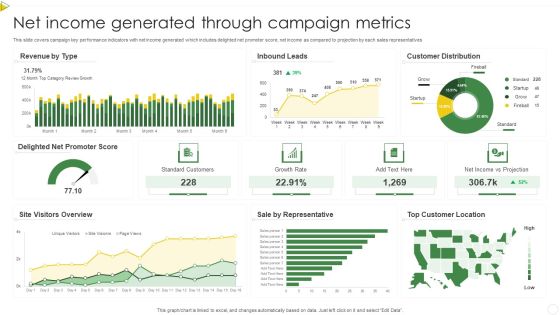
Net Income Generated Through Campaign Metrics Summary PDF
This slide covers campaign key performance indicators with net income generated which includes delighted net promoter score, net income as compared to projection by each sales representatives. Pitch your topic with ease and precision using this Net Income Generated Through Campaign Metrics Summary PDF. This layout presents information on Standard Customers, Growth Rate, Net Income. It is also available for immediate download and adjustment. So, changes can be made in the color, design, graphics or any other component to create a unique layout.

Quarterly Business Review With Performance Metrics And Results Ideas PDF
This slide shows budgeted v or s actual business projection results. It includes forecast based on growth in sales, target customers and average expenses incurred to attract target audience. Showcasing this set of slides titled Quarterly Business Review With Performance Metrics And Results Ideas PDF. The topics addressed in these templates are Sale, Customer, Average Spent. All the content presented in this PPT design is completely editable. Download it and make adjustments in color, background, font etc. as per your unique business setting.
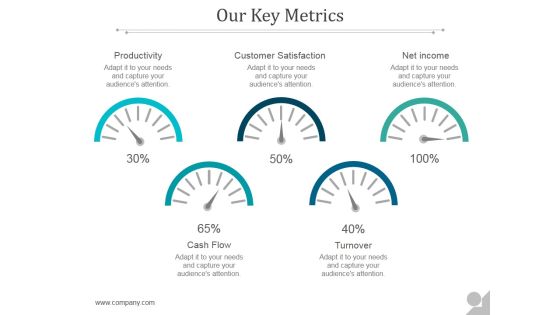
Our Key Metrics Ppt PowerPoint Presentation Examples
This is a our key metrics ppt powerpoint presentation examples. This is a five stage process. The stages in this process are productivity, customer satisfaction, net income, cash flow, turnover.

Location Identification For New Retail Outlet Kpis To Measure Performance Of New Retail Store Pictures PDF
The purpose of this slide is to showcase key performance indicators KPIs through which marketers can evaluate performance of retail store. The metrics mentioned in slide are sales per square foot, average transaction value, customer retention rate, customer conversion rate, and foot traffic. Take your projects to the next level with our ultimate collection of Location Identification For New Retail Outlet Kpis To Measure Performance Of New Retail Store Pictures PDF. Slidegeeks has designed a range of layouts that are perfect for representing task or activity duration, keeping track of all your deadlines at a glance. Tailor these designs to your exact needs and give them a truly corporate look with your own brand colors they will make your projects stand out from the rest
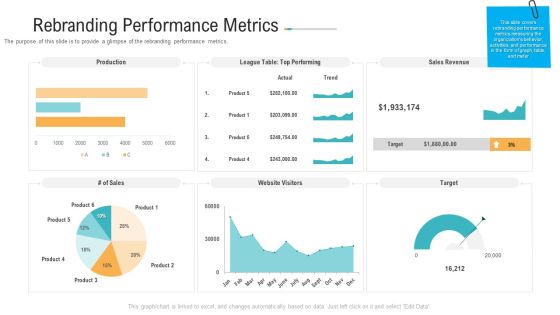
Rebranding Performance Metrics Ppt PowerPoint Presentation Pictures Shapes PDF
The purpose of this slide is to provide a glimpse of the sales projections and forecasting after rebranding.Deliver and pitch your topic in the best possible manner with this rebranding performance metrics ppt powerpoint presentation pictures shapes pdf. Use them to share invaluable insights on product, 2019 to 2021 and impress your audience. This template can be altered and modified as per your expectations. So, grab it now.
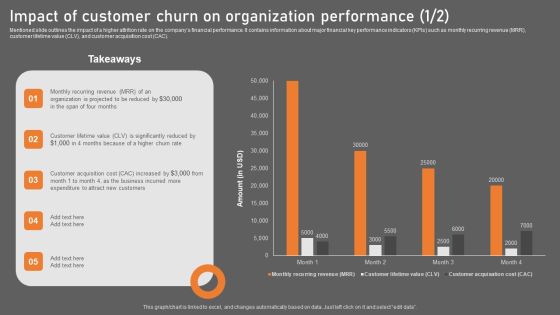
Impact Of Customer Churn On Organization Performance Background PDF
Mentioned slide outlines the impact of a higher attrition rate on the companys financial performance. It contains information about major financial key performance indicators KPIs such as monthly recurring revenue MRR, customer lifetime value CLV, and customer acquisition cost CAC. Take your projects to the next level with our ultimate collection of Impact Of Customer Churn On Organization Performance Background PDF. Slidegeeks has designed a range of layouts that are perfect for representing task or activity duration, keeping track of all your deadlines at a glance. Tailor these designs to your exact needs and give them a truly corporate look with your own brand colors they will make your projects stand out from the rest.

Marketing Success Metrics Introduction To Paid Search Analytics For Improving Template PDF
This slide covers a brief overview of paid search analytics to determine campaign returns. It also includes steps for conducting a PPC audit, such as checking location and target settings, evaluating ads, using extensions, assessing keywords, etc. Take your projects to the next level with our ultimate collection of Marketing Success Metrics Introduction To Paid Search Analytics For Improving Template PDF. Slidegeeks has designed a range of layouts that are perfect for representing task or activity duration, keeping track of all your deadlines at a glance. Tailor these designs to your exact needs and give them a truly corporate look with your own brand colors theyll make your projects stand out from the rest.
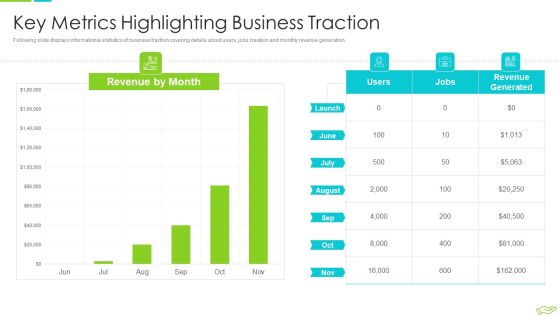
Elevator Pitch Deck To Raise Funds Key Metrics Highlighting Business Traction Clipart PDF
Following slide displays informational statistics of business traction covering details about users, jobs creation and monthly revenue generation. Deliver and pitch your topic in the best possible manner with this elevator pitch deck to raise funds key financial projections for upcoming years pictures pdf. Use them to share invaluable insights on key metrics highlighting business traction and impress your audience. This template can be altered and modified as per your expectations. So, grab it now.

Marketing Success Metrics Major Types Of Marketing Analytics Models Microsoft PDF
This slide covers three types of models to conduct marketing analytics. The mentioned models are descriptive models to identify what happened, predictive models to know what will happen, and prescriptive models to determine how to make it happen. Take your projects to the next level with our ultimate collection of Marketing Success Metrics Major Types Of Marketing Analytics Models Microsoft PDF. Slidegeeks has designed a range of layouts that are perfect for representing task or activity duration, keeping track of all your deadlines at a glance. Tailor these designs to your exact needs and give them a truly corporate look with your own brand colors theyll make your projects stand out from the rest.

Qualified Traffic Generation Through Search Engines Sem Metrics To Track Analyze And Optimize Rules PDF
This slide showcases the search engine marketing metrices to track and analyze results. It includes metrics such as click through rate, impressions share, cost per action, customer lifetime value, return on ad spend and quality score. Take your projects to the next level with our ultimate collection of Qualified Traffic Generation Through Search Engines Sem Metrics To Track Analyze And Optimize Rules PDF. Slidegeeks has designed a range of layouts that are perfect for representing task or activity duration, keeping track of all your deadlines at a glance. Tailor these designs to your exact needs and give them a truly corporate look with your own brand colors they will make your projects stand out from the rest.

How To Boost Brand Recognition Brand Awareness Metrics Volume Of Social Mentions Topics PDF
This slide provides information regarding volume of social or brand mentions as brand awareness metrics. It helps in assessing the frequency of brand name mentioned across online platforms. It also include ways to increase volume of mentions. Take your projects to the next level with our ultimate collection of How To Boost Brand Recognition Brand Awareness Metrics Volume Of Social Mentions Topics PDF. Slidegeeks has designed a range of layouts that are perfect for representing task or activity duration, keeping track of all your deadlines at a glance. Tailor these designs to your exact needs and give them a truly corporate look with your own brand colors theyll make your projects stand out from the rest.

Supply Chain Management Operational Metrics Understanding The Spent Category Brochure PDF
This is a supply chain management operational metrics understanding the spent category brochure pdf. template with various stages. Focus and dispense information on five stages using this creative set, that comes with editable features. It contains large content boxes to add your information on topics like expenditures by the supplier, future demand projections or budgets. You can also showcase facts, figures, and other relevant content using this PPT layout. Grab it now.

Selling Forecasts Dashboard With Revenue Predictions Elements PDF
This slide covers estimated sales projections based on different regions. It includes elements such as potential revenue and predicted revenue, predicted risks, sales forecasted by agents , etc. Showcasing this set of slides titled Selling Forecasts Dashboard With Revenue Predictions Elements PDF. The topics addressed in these templates are Forecasted Value, Potential Revenue, Predicted Risk. All the content presented in this PPT design is completely editable. Download it and make adjustments in color, background, font etc. as per your unique business setting.

Market Analysis Overview And Different Categories Measuring Brand Awareness Through Social Media Platforms Inspiration PDF
The following slide outlines various key performance indicators KPIs through which marketers can evaluate brand awareness on social media channels such as facebook, instagram, linkedin, twitter, and youtube. The metrics mentioned are brand impressions, reach, engagement rate, followers growth, story views, etc. Take your projects to the next level with our ultimate collection of Market Analysis Overview And Different Categories Measuring Brand Awareness Through Social Media Platforms Inspiration PDF. Slidegeeks has designed a range of layouts that are perfect for representing task or activity duration, keeping track of all your deadlines at a glance. Tailor these designs to your exact needs and give them a truly corporate look with your own brand colors they will make your projects stand out from the rest.
Strategy To Enhance Supply Chain Operations Logistics Management Strategy Effectiveness Tracking Sheet Rules PDF
This slide covers the key performance indicator for tracking impact of new logistics management strategy. It includes metrics such as shipping time, order accuracy, lead time, capacity utilization, customer backorder rate, inventory turnover, etc. Take your projects to the next level with our ultimate collection of Strategy To Enhance Supply Chain Operations Logistics Management Strategy Effectiveness Tracking Sheet Rules PDF. Slidegeeks has designed a range of layouts that are perfect for representing task or activity duration, keeping track of all your deadlines at a glance. Tailor these designs to your exact needs and give them a truly corporate look with your own brand colors they will make your projects stand out from the rest.
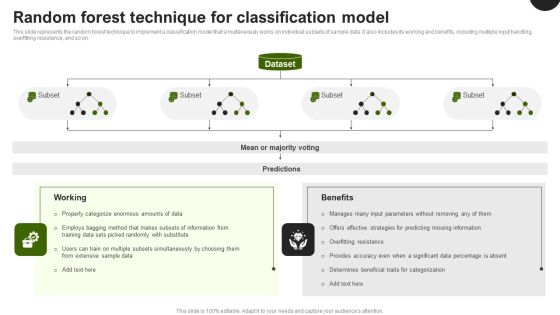
Predictive Analytics In The Age Of Big Data Random Forest Technique For Classification Model Pictures PDF
This slide represents the random forest technique to implement a classification model that simultaneously works on individual subsets of sample data. It also includes its working and benefits, including multiple input handling, overfitting resistance, and so on. Take your projects to the next level with our ultimate collection of Predictive Analytics In The Age Of Big Data Random Forest Technique For Classification Model Pictures PDF. Slidegeeks has designed a range of layouts that are perfect for representing task or activity duration, keeping track of all your deadlines at a glance. Tailor these designs to your exact needs and give them a truly corporate look with your own brand colors they will make your projects stand out from the rest.

Comprehensive Analysis Of Different Data Lineage Classification Key Areas Where Data Lineage Download PDF
This slide talks about the key areas where data lineage can have a significant impact and help businesses to fix errors. It includes strategic decision making, data governance, data migration and optimal use of new and old data sets. Take your projects to the next level with our ultimate collection of Comprehensive Analysis Of Different Data Lineage Classification Key Areas Where Data Lineage Download PDF. Slidegeeks has designed a range of layouts that are perfect for representing task or activity duration, keeping track of all your deadlines at a glance. Tailor these designs to your exact needs and give them a truly corporate look with your own brand colors they will make your projects stand out from the rest

Overview Of Data Lineage By Parsing Technique Deploying Data Lineage IT Designs PDF
This slide depicts the overview of data provenance, including the type of questions it answers, such as the reason behind data generation, method of info generation, time of data generation, and the owner of the generated data. It also covers the provenance model in World Wide Web Consortium W3C.Take your projects to the next level with our ultimate collection of Overview Of Data Lineage By Parsing Technique Deploying Data Lineage IT Designs PDF. Slidegeeks has designed a range of layouts that are perfect for representing task or activity duration, keeping track of all your deadlines at a glance. Tailor these designs to your exact needs and give them a truly corporate look with your own brand colors they all make your projects stand out from the rest.

Marketers Guide To Data Analysis Optimization Major Types Of Marketing Analytics Models Microsoft PDF
This slide covers three types of models to conduct marketing analytics. The mentioned models are descriptive models to identify what happened, predictive models to know what will happen, and prescriptive models to determine how to make it happen. Take your projects to the next level with our ultimate collection of Marketers Guide To Data Analysis Optimization Major Types Of Marketing Analytics Models Microsoft PDF. Slidegeeks has designed a range of layouts that are perfect for representing task or activity duration, keeping track of all your deadlines at a glance. Tailor these designs to your exact needs and give them a truly corporate look with your own brand colors they will make your projects stand out from the rest.
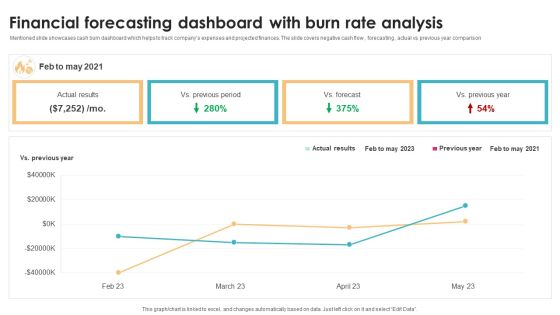
Financial Forecasting Dashboard With Burn Rate Analysis Brochure PDF
Mentioned slide showcases cash burn dashboard which helps to track companys expenses and projected finances. The slide covers negative cash flow , forecasting , actual vs previous year comparison Showcasing this set of slides titled Financial Forecasting Dashboard With Burn Rate Analysis Brochure PDF. The topics addressed in these templates are Previous Year, Analysis, Forecast. All the content presented in this PPT design is completely editable. Download it and make adjustments in color, background, font etc. as per your unique business setting.
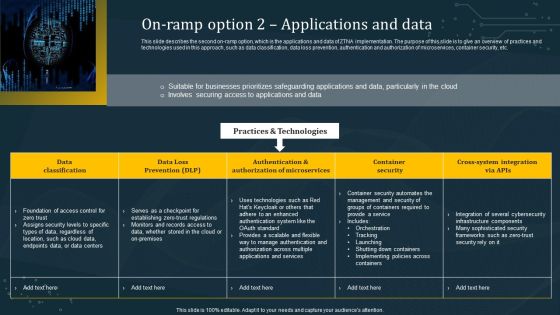
On Ramp Option 2 Applications And Data Template PDF
This slide describes the second on-ramp option, which is the applications and data of ZTNA implementation. The purpose of this slide is to give an overview of practices and technologies used in this approach, such as data classification, data loss prevention, authentication and authorization of microservices, container security, etc. Take your projects to the next level with our ultimate collection of On Ramp Option 2 Applications And Data Template PDF. Slidegeeks has designed a range of layouts that are perfect for representing task or activity duration, keeping track of all your deadlines at a glance. Tailor these designs to your exact needs and give them a truly corporate look with your own brand colors they will make your projects stand out from the rest

Data Stewardship By Business Process Model Microsoft PDF
This slide describes the data stewardship by business process model in which a particular business procedure is allocated to a data steward and can be combined with by function model. It is best for organizations with a great sense of organizational procedures. Take your projects to the next level with our ultimate collection of Data Stewardship By Business Process Model Microsoft PDF. Slidegeeks has designed a range of layouts that are perfect for representing task or activity duration, keeping track of all your deadlines at a glance. Tailor these designs to your exact needs and give them a truly corporate look with your own brand colors they will make your projects stand out from the rest.
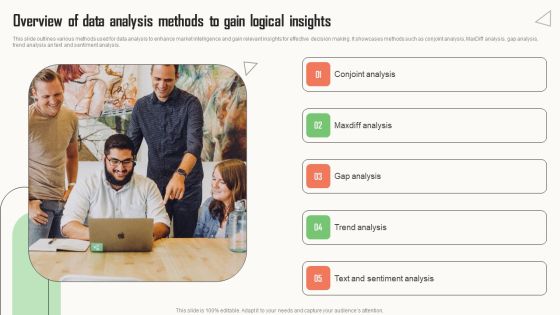
Strategic Market Insight Implementation Guide Overview Of Data Analysis Methods To Gain Logical Insights Themes PDF
This slide outlines various methods used for data analysis to enhance market intelligence and gain relevant insights for effective decision making. It showcases methods such as conjoint analysis, MaxDiff analysis, gap analysis, trend analysis an text and sentiment analysis. Take your projects to the next level with our ultimate collection of Strategic Market Insight Implementation Guide Overview Of Data Analysis Methods To Gain Logical Insights Themes PDF. Slidegeeks has designed a range of layouts that are perfect for representing task or activity duration, keeping track of all your deadlines at a glance. Tailor these designs to your exact needs and give them a truly corporate look with your own brand colors they will make your projects stand out from the rest.

Data Stewardship Program For Healthcare Industry Sample PDF
This slide depicts the overview of data stewardship in the healthcare industry. As the medical industry becomes digital, it generates massive amounts of data and to manage this data, stewards are required. It also contains the roles and responsibilities of healthcare data stewards, such as maintaining data quality, etc. Take your projects to the next level with our ultimate collection of Data Stewardship Program For Healthcare Industry Sample PDF. Slidegeeks has designed a range of layouts that are perfect for representing task or activity duration, keeping track of all your deadlines at a glance. Tailor these designs to your exact needs and give them a truly corporate look with your own brand colors they will make your projects stand out from the rest.

Comprehensive Customer Data Platform Guide Optimizing Promotional Initiatives Email Campaign Performance Evaluation Information PDF
The following slide depicts email campaign performance dashboard to connect with audience and gather real time insights. It includes elements such as highest open rate, active customers, average engagement per customer, daily performance analysis etc. Take your projects to the next level with our ultimate collection of Comprehensive Customer Data Platform Guide Optimizing Promotional Initiatives Email Campaign Performance Evaluation Information PDF. Slidegeeks has designed a range of layouts that are perfect for representing task or activity duration, keeping track of all your deadlines at a glance. Tailor these designs to your exact needs and give them a truly corporate look with your own brand colors they will make your projects stand out from the rest.

Kpis To Evaluate Cyber Security Risk Management Ppt PowerPoint Presentation File Outline PDF
The following slide highlights some key performance indicators to measure the impact of cyber security risk administration to assess its effectiveness and take improved decisions. It includes elements such as level of preparedness, mean time to detect, success rating etc. Take your projects to the next level with our ultimate collection of Kpis To Evaluate Cyber Security Risk Management Ppt PowerPoint Presentation File Outline PDF. Slidegeeks has designed a range of layouts that are perfect for representing task or activity duration, keeping track of all your deadlines at a glance. Tailor these designs to your exact needs and give them a truly corporate look with your own brand colors they will make your projects stand out from the rest.

Tools To Gather Data From Social Media Platforms For Personalization Icons PDF
This slide showcases social media tools that can be used to gather data about consumers to formulate personalized marketing campaigns. Twitter analytics, facebook audience insight and instagram insights are the internal tools that can be used. Take your projects to the next level with our ultimate collection of Tools To Gather Data From Social Media Platforms For Personalization Icons PDF. Slidegeeks has designed a range of layouts that are perfect for representing task or activity duration, keeping track of all your deadlines at a glance. Tailor these designs to your exact needs and give them a truly corporate look with your own brand colors they will make your projects stand out from the rest

Strategic Guidelines To Administer Dashboard To Track Warehouse Shipments And Operating Sample PDF
This slide showcases dashboard that can help organization to track operating cost incurred by organization in different warehousing activities. Its other key elements are - perfect order rate, total shipments by country and on time shipments. Take your projects to the next level with our ultimate collection of Strategic Guidelines To Administer Dashboard To Track Warehouse Shipments And Operating Sample PDF. Slidegeeks has designed a range of layouts that are perfect for representing task or activity duration, keeping track of all your deadlines at a glance. Tailor these designs to your exact needs and give them a truly corporate look with your own brand colors theyll make your projects stand out from the rest.
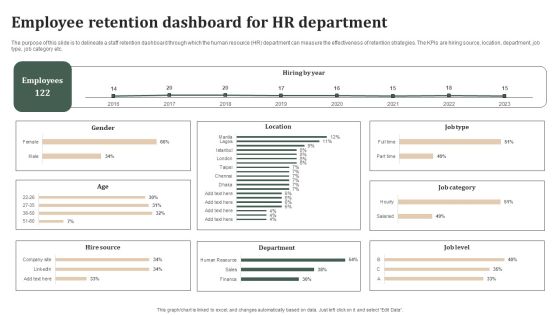
Successful Staff Retention Techniques Employee Retention Dashboard For Hr Department Template PDF
The purpose of this slide is to delineate a staff retention dashboard through which the human resource HR department can measure the effectiveness of retention strategies. The KPIs are hiring source, location, department, job type, job category etc. Take your projects to the next level with our ultimate collection of Successful Staff Retention Techniques Employee Retention Dashboard For Hr Department Template PDF. Slidegeeks has designed a range of layouts that are perfect for representing task or activity duration, keeping track of all your deadlines at a glance. Tailor these designs to your exact needs and give them a truly corporate look with your own brand colors they will make your projects stand out from the rest.

Definitive Guide To Conduct Digital Marketing Inspection Dashboard To Assess Social Posts Content Quality Summary PDF
This slide indicates the Dashboard to Assess Social Posts Content Quality. It provides information regarding the top published articles, story turnaround time, average number of comments per article and digital subscribers gained. Take your projects to the next level with our ultimate collection of Definitive Guide To Conduct Digital Marketing Inspection Dashboard To Assess Social Posts Content Quality Summary PDF. Slidegeeks has designed a range of layouts that are perfect for representing task or activity duration, keeping track of all your deadlines at a glance. Tailor these designs to your exact needs and give them a truly corporate look with your own brand colors they will make your projects stand out from the rest.

Online Marketing Strategy For Lead Generation Dashboard To Track Website Traffic During Performance Icons PDF
This slide showcases dashboard that can help marketers to track the website traffic during execution of performance marketing activities. Its key elements are organic sessions, organic page views, inorganic sessions by month etc. Take your projects to the next level with our ultimate collection of Online Marketing Strategy For Lead Generation Dashboard To Track Website Traffic During Performance Icons PDF. Slidegeeks has designed a range of layouts that are perfect for representing task or activity duration, keeping track of all your deadlines at a glance. Tailor these designs to your exact needs and give them a truly corporate look with your own brand colors they will make your projects stand out from the rest

Financial Forecast And Essential Metrics Dashboard Showing Cash Management Designs PDF
This slide contains the projections of the company financials to predict the future position so that better decisions could be taken for the growth prospective. It also includes ratios, cash balance, inventory analysis , etc. Showcasing this set of slides titled Financial Forecast And Essential Metrics Dashboard Showing Cash Management Designs PDF. The topics addressed in these templates are Days Sales Outstanding, Cash Management Dashboard, Days Inventory Outstanding. All the content presented in this PPT design is completely editable. Download it and make adjustments in color, background, font etc. as per your unique business setting.

Administered Data And Analytic Quality Playbook Search Driven Analytics Challenges Low Diagrams PDF
This template covers the problems while implementing search-driven analytics in the organization. The challenges are failure rate for BI projects and poor user experience stifles adoption.Deliver an awe inspiring pitch with this creative Administered Data And Analytic Quality Playbook Search Driven Analytics Challenges Low Diagrams PDF bundle. Topics like Business Teams, Hardly Addresses, Fundamental Challenges can be discussed with this completely editable template. It is available for immediate download depending on the needs and requirements of the user.
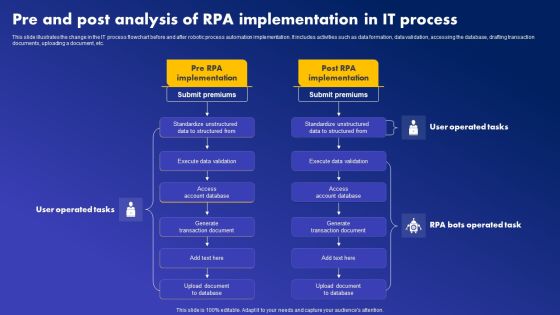
Pre And Post Analysis Of RPA Implementation In It Process Diagrams PDF
This slide illustrates the change in the IT process flowchart before and after robotic process automation implementation. It includes activities such as data formation, data validation, accessing the database, drafting transaction documents, uploading a document, etc. Take your projects to the next level with our ultimate collection of Pre And Post Analysis Of RPA Implementation In It Process Diagrams PDF. Slidegeeks has designed a range of layouts that are perfect for representing task or activity duration, keeping track of all your deadlines at a glance. Tailor these designs to your exact needs and give them a truly corporate look with your own brand colors they will make your projects stand out from the rest

Potential Applications Of Augmented Intelligence Tools Ppt PowerPoint Presentation File Pictures PDF
This slide describes the potential applications of augmented tools in different sectors such as healthcare, finance, retail, manufacturing, and marketing. It also includes the services these tools perform, comprising cleaning data sets, providing predictions, improving decision making, and customer service. Take your projects to the next level with our ultimate collection of Potential Applications Of Augmented Intelligence Tools Ppt PowerPoint Presentation File Pictures PDF. Slidegeeks has designed a range of layouts that are perfect for representing task or activity duration, keeping track of all your deadlines at a glance. Tailor these designs to your exact needs and give them a truly corporate look with your own brand colors they will make your projects stand out from the rest.

Dashboard For Content Delivery Network Ppt Gallery Show PDF
This slide depicts the dashboard for content delivery network which projects the usage of resources, increase in data transfer and usage of CDN. Deliver and pitch your topic in the best possible manner with this dashboard for content delivery network ppt gallery show pdf. Use them to share invaluable insights on dashboard for content delivery network and impress your audience. This template can be altered and modified as per your expectations. So, grab it now.

Distribution Network Dashboard For Content Delivery Network Portrait PDF
This slide depicts the dashboard for content delivery network which projects the usage of resources, increase in data transfer and usage of CDN. Deliver and pitch your topic in the best possible manner with this Distribution Network Dashboard For Content Delivery Network Portrait PDF. Use them to share invaluable insights on Dashboard, Content Delivery Network and impress your audience. This template can be altered and modified as per your expectations. So, grab it now.

Asset Assessment Dashboard Indicating Revenue And Productivity Infographics PDF
This slide showcases asset valuation dashboard highlighting company revenue and productivity index. It provides information about geographical evaluation, development cost, commercial cost, etc.Pitch your topic with ease and precision using this Asset Assessment Dashboard Indicating Revenue And Productivity Infographics PDF. This layout presents information on Projected Development, Productivity Index, Geographical Evaluation. It is also available for immediate download and adjustment. So, changes can be made in the color, design, graphics or any other component to create a unique layout.

Quarterly Sales Performance Action Plan Dashboard Mockup PDF
This slide elaborated about he overall quarterly sales details and the target goal projections that has to be achieved within a stipulated time. Pitch your topic with ease and precision using this Quarterly Sales Performance Action Plan Dashboard Mockup PDF. This layout presents information on Sales, Target, Goal. It is also available for immediate download and adjustment. So, changes can be made in the color, design, graphics or any other component to create a unique layout.

5G Network Operations Structure Of The NR U Plane Radio Protocol Diagrams PDF
This slide represents the layer 2 structure of the New Radio U-Plane radio protocol, including the downlink and uplink. It also comprises the layer 2 components, such as service data adaptation protocol, packet data convergence protocol, RLC, and MAC. Take your projects to the next level with our ultimate collection of 5G Network Operations Structure Of The NR U Plane Radio Protocol Diagrams PDF. Slidegeeks has designed a range of layouts that are perfect for representing task or activity duration, keeping track of all your deadlines at a glance. Tailor these designs to your exact needs and give them a truly corporate look with your own brand colors they will make your projects stand out from the rest.

Regenerative Artificial Intelligence Systems Reinforcement Learning From Human Feedback Sft Model Guidelines PDF
This slide represents the supervised fine tuning model of reinforcement learning. The purpose of this slide is to explain the procedure of developing SFT model. This slide also discusses the various categories of sample data such as simple requests, etc. Take your projects to the next level with our ultimate collection of Regenerative Artificial Intelligence Systems Reinforcement Learning From Human Feedback Sft Model Guidelines PDF. Slidegeeks has designed a range of layouts that are perfect for representing task or activity duration, keeping track of all your deadlines at a glance. Tailor these designs to your exact needs and give them a truly corporate look with your own brand colors they will make your projects stand out from the rest

Unconstrained Market Growth Using Blue Ocean Strategies Three Components Of Humanness Themes PDF
This template cover 3 components of humanness to build humanness into the blue ocean shift process and help people develop the confidence to act. It also includes three elements that address different aspects of our humanness atomization, first hand discovery, and the exercise of fair process. Take your projects to the next level with our ultimate collection of Unconstrained Market Growth Using Blue Ocean Strategies Three Components Of Humanness Themes PDF. Slidegeeks has designed a range of layouts that are perfect for representing task or activity duration, keeping track of all your deadlines at a glance. Tailor these designs to your exact needs and give them a truly corporate look with your own brand colors they will make your projects stand out from the rest.
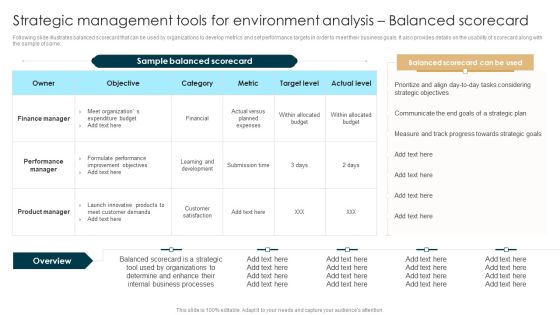
Strategic Management Tools For Environment Analysis Balanced Scorecard Demonstration PDF
Following slide illustrates balanced scorecard that can be used by organizations to develop metrics and set performance targets in order to meet their business goals. It also provides details on the usability of scorecard along with the sample of same. Take your projects to the next level with our ultimate collection of Strategic Management Tools For Environment Analysis Balanced Scorecard Demonstration PDF. Slidegeeks has designed a range of layouts that are perfect for representing task or activity duration, keeping track of all your deadlines at a glance. Tailor these designs to your exact needs and give them a truly corporate look with your own brand colors they will make your projects stand out from the rest.

Brand Positioning And Launch Plan For Emerging Markets Kpis To Track Brand Performance Summary PDF
This slide showcases KPIs that can help organization to track and evaluate the performance of brand in the market. Metrics are - social mentions, customer reviews, conversion rate, email subscriptions, website bounce rate, net promoter score etc. Take your projects to the next level with our ultimate collection of Brand Positioning And Launch Plan For Emerging Markets Kpis To Track Brand Performance Summary PDF. Slidegeeks has designed a range of layouts that are perfect for representing task or activity duration, keeping track of all your deadlines at a glance. Tailor these designs to your exact needs and give them a truly corporate look with your own brand colors they will make your projects stand out from the rest.
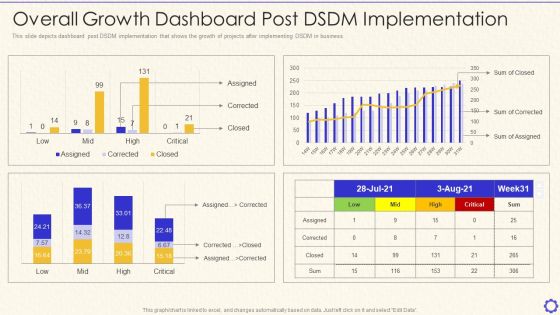
Dynamic System Development Method Tools And Techniques IT Overall Growth Dashboard Template PDF
This slide depicts dashboard post DSDM implementation that shows the growth of projects after implementing DSDM in business. Deliver and pitch your topic in the best possible manner with this dynamic system development method tools and techniques it overall growth dashboard template pdf. Use them to share invaluable insights on overall growth dashboard post dsdm implementation and impress your audience. This template can be altered and modified as per your expectations. So, grab it now.
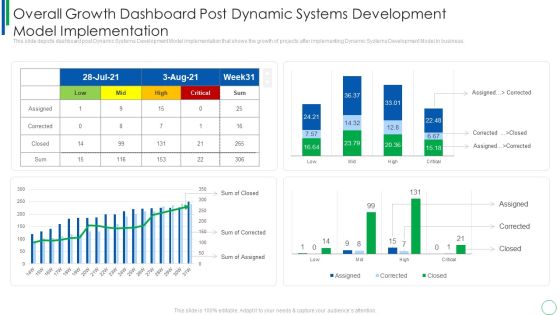
Overall Growth Dashboard Post Dynamic Systems Development Model Implementation Designs PDF
This slide depicts dashboard post Dynamic Systems Development Model implementation that shows the growth of projects after implementing Dynamic Systems Development Model in business. Deliver an awe inspiring pitch with this creative overall growth dashboard post dynamic systems development model implementation designs pdf bundle. Topics like overall growth dashboard post dynamic systems development model implementation can be discussed with this completely editable template. It is available for immediate download depending on the needs and requirements of the user.

Content Delivery Network Edge Server Dashboard For Content Delivery Network Inspiration PDF
This slide depicts the dashboard for content delivery network which projects the usage of resources, increase in data transfer and usage of CDN. Deliver an awe inspiring pitch with this creative Content Delivery Network Edge Server Dashboard For Content Delivery Network Inspiration PDF bundle. Topics like Dashboard, Content Delivery Network can be discussed with this completely editable template. It is available for immediate download depending on the needs and requirements of the user.
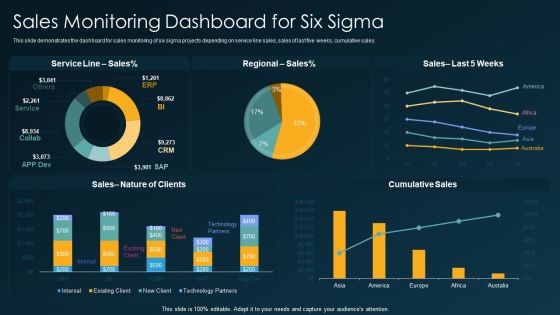
Six Sigma Methodology IT Sales Monitoring Dashboard For Six Sigma Ppt Model Structure PDF
This slide demonstrates the dashboard for sales monitoring of six sigma projects depending on service line sales, sales of last five weeks, cumulative sales. Deliver an awe inspiring pitch with this creative six sigma methodology it sales monitoring dashboard for six sigma ppt model structure pdf bundle. Topics like cumulative sales, regional sales, service line can be discussed with this completely editable template. It is available for immediate download depending on the needs and requirements of the user.
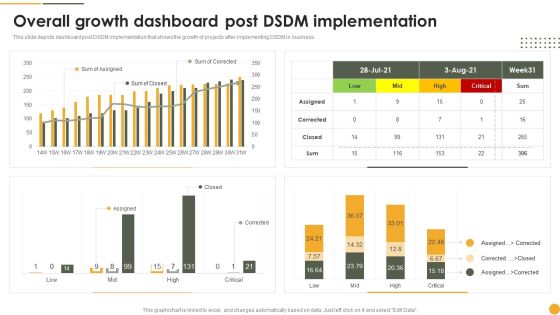
Dynamic Systems Development Approach Overall Growth Dashboard Post DSDM Implementation Pictures PDF
This slide depicts dashboard post DSDM implementation that shows the growth of projects after implementing DSDM in business. Deliver an awe inspiring pitch with this creative Dynamic Systems Development Approach Overall Growth Dashboard Post DSDM Implementation Pictures PDF bundle. Topics like Closed, Corrected, Assigned, Low, High can be discussed with this completely editable template. It is available for immediate download depending on the needs and requirements of the user.

Six Sigma Methodologies For Process Optimization Sales Monitoring Dashboard For Six Sigma Elements PDF
This slide demonstrates the dashboard for sales monitoring of six sigma projects depending on service line sales, sales of last five weeks, cumulative sales. Showcasing this set of slides titled Six Sigma Methodologies For Process Optimization Sales Monitoring Dashboard For Six Sigma Elements PDF. The topics addressed in these templates are Sales, Service Line, Technology Partners. All the content presented in this PPT design is completely editable. Download it and make adjustments in color, background, font etc. as per your unique business setting.
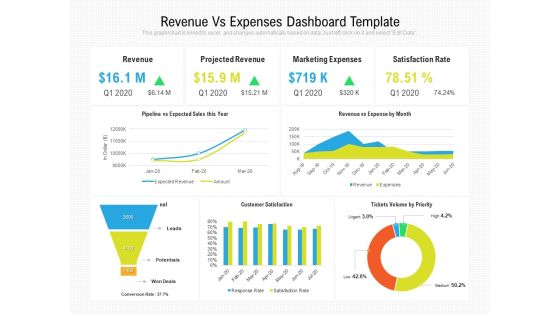
Revenue Vs Expenses Dashboard Template Ppt PowerPoint Presentation Slides Tips PDF
Presenting this set of slides with name revenue vs expenses dashboard template ppt powerpoint presentation slides tips pdf. The topics discussed in these slides are revenue, projected revenue, marketing expenses, satisfaction rate, pipeline vs expected sales this year, revenue vs expense by month, customer satisfaction, tickets volume by priority. This is a completely editable PowerPoint presentation and is available for immediate download. Download now and impress your audience.
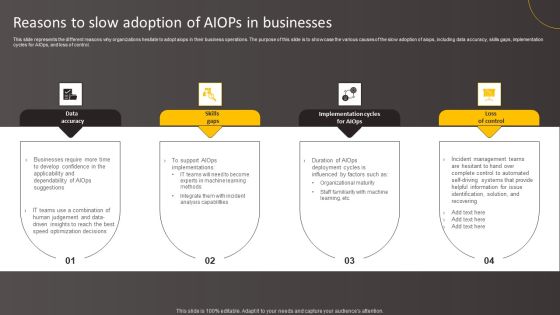
Reasons To Slow Adoption Of Aiops In Businesses Template PDF
This slide represents the different reasons why organizations hesitate to adopt aiops in their business operations. The purpose of this slide is to showcase the various causes of the slow adoption of aiops, including data accuracy, skills gaps, implementation cycles for AIOps, and loss of control. Take your projects to the next level with our ultimate collection of Reasons To Slow Adoption Of Aiops In Businesses Template PDF. Slidegeeks has designed a range of layouts that are perfect for representing task or activity duration, keeping track of all your deadlines at a glance. Tailor these designs to your exact needs and give them a truly corporate look with your own brand colors they will make your projects stand out from the rest

Revamping Firm Presence Through Relaunching Table Of Content Ppt PowerPoint Presentation Summary Layouts PDF
Presenting this set of slides with name revamping firm presence through relaunching table of content ppt powerpoint presentation summary layouts pdf. This is a one stage process. The stages in this process are industry analysis, targeted market, rebranding strategies, launch plan, budget allocation, sales projections and forecasting, rebranding performance metrics. This is a completely editable PowerPoint presentation and is available for immediate download. Download now and impress your audience.
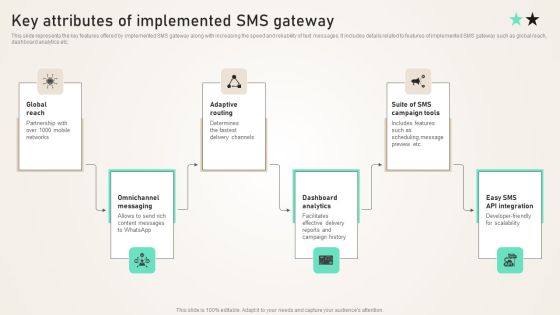
Key Attributes Of Implemented SMS Gateway Ppt PowerPoint Presentation File Portfolio PDF
This slide represents the key features offered by implemented SMS gateway along with increasing the speed and reliability of text messages. It includes details related to features of implemented SMS gateway such as global reach, dashboard analytics etc. Take your projects to the next level with our ultimate collection of Key Attributes Of Implemented SMS Gateway Ppt PowerPoint Presentation File Portfolio PDF. Slidegeeks has designed a range of layouts that are perfect for representing task or activity duration, keeping track of all your deadlines at a glance. Tailor these designs to your exact needs and give them a truly corporate look with your own brand colors they will make your projects stand out from the rest.
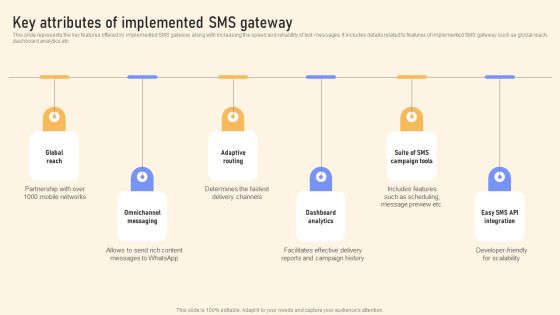
Key Attributes Of Implemented SMS Gateway Ppt PowerPoint Presentation File Example PDF
This slide represents the key features offered by implemented SMS gateway along with increasing the speed and reliability of text messages. It includes details related to features of implemented SMS gateway such as global reach, dashboard analytics etc. Take your projects to the next level with our ultimate collection of Key Attributes Of Implemented SMS Gateway Ppt PowerPoint Presentation File Example PDF. Slidegeeks has designed a range of layouts that are perfect for representing task or activity duration, keeping track of all your deadlines at a glance. Tailor these designs to your exact needs and give them a truly corporate look with your own brand colors they will make your projects stand out from the rest.

Bridge Skill Gap Post Effective Performance Management System Implementation Rules PDF
The following slide depicts the projected employee skill progress post implementing updated improvement strategies, It includes elements such as negotiation skills, time management, decision making, problem solving, data analytics etc. There are so many reasons you need a Bridge Skill Gap Post Effective Performance Management System Implementation Rules PDF. The first reason is you can not spend time making everything from scratch, Thus, Slidegeeks has made presentation templates for you too. You can easily download these templates from our website easily.

Product Development Status Icon With Bulb Ideas PDF
The following slide showcases dashboard that helps to track key performance indicators of product development. Key metrics covered overall progress, planning, design, development, testing, risks, summary, average handle time, overdue tasks, upcoming deadlines and projected launch date. Showcasing this set of slides titled Product Development Status Icon With Bulb Ideas PDF. The topics addressed in these templates are Design, Development, Planning. All the content presented in this PPT design is completely editable. Download it and make adjustments in color, background, font etc. as per your unique business setting.

Company Financial Forecast And Essential Metrics Ppt Model Design Templates PDF
This slide shows the projections of the financials of a company with the key performance indicators to know exactly where the business stands and what needs to be enhanced or reduced to make the business profitable. Showcasing this set of slides titled Company Financial Forecast And Essential Metrics Ppt Model Design Templates PDF. The topics addressed in these templates are Budget, Income, Expense, 2018 To 2022. All the content presented in this PPT design is completely editable. Download it and make adjustments in color, background, font etc. as per your unique business setting.

Income Statement Showing Financial Forecast And Essential Metrics Structure PDF
This slide displays the income statement of an organization with the projections of next year revenue and net income. It shows that there will more revenue as compared to the previous years and hence it will generate more income. Presenting Income Statement Showing Financial Forecast And Essential Metrics Structure PDF to dispense important information. This template comprises two stages. It also presents valuable insights into the topics including Revenue, Operating Expenses, Operating Income. This is a completely customizable PowerPoint theme that can be put to use immediately. So, download it and address the topic impactfully.

Cash Flow Financial Forecast And Essential Metrics Ppt Summary Files PDF
This slide contains the cash flow projection of the company for the year 2022 to know where exactly and how much cash is going out and coming in from the sources. Presenting Cash Flow Financial Forecast And Essential Metrics Ppt Summary Files PDF to dispense important information. This template comprises two stages. It also presents valuable insights into the topics including Cash Flow Summary, 2020 to 2022, Gross Margin, Total Revenue. This is a completely customizable PowerPoint theme that can be put to use immediately. So, download it and address the topic impactfully.

Five Year Financial Forecast And Essential Metrics Ppt Infographics Shapes PDF
This slide showcases five-year projection of the company to analyze its growth and financing needs and capital expenditures requirements. It also includes the KPIs such as number of customers, revenue , expenses and cashflow. Presenting Five Year Financial Forecast And Essential Metrics Ppt Infographics Shapes PDF to dispense important information. This template comprises five stages. It also presents valuable insights into the topics including Number Customers, Revenue, Expenses, Cash Flow, 2018 To 2022. This is a completely customizable PowerPoint theme that can be put to use immediately. So, download it and address the topic impactfully.

IT Value Story Significant To Corporate Leadership Delivery Metrics Service Delivery Graphics PDF
This template covers service delivery metrics aligned to a business value, such as percentage of projects on time, on budget, on spec, and percentage of business facing services meeting service level agreements slas. Deliver and pitch your topic in the best possible manner with this it value story significant to corporate leadership delivery metrics service delivery graphics pdf. Use them to share invaluable insights on measure, metrics, resourcing, service and impress your audience. This template can be altered and modified as per your expectations. So, grab it now.
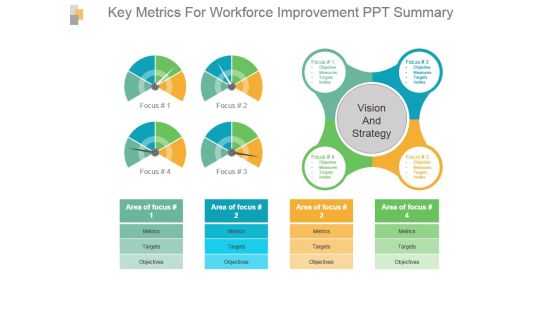
Key Metrics For Workforce Improvement Ppt Summary
This is a key metrics for workforce improvement ppt summary. This is a four stage process. The stages in this process are vision and strategy, metrics, targets, objectives, area of focus.

Application Development Best Practice Tools And Templates Jira Dashboard For Agile Software Structure PDF
This slide covers the progress towards next milestone, projects work status, high risk items, workload details per person, work added vs work completed over time graph. Deliver and pitch your topic in the best possible manner with this application development best practice tools and templates jira dashboard for agile software structure pdf. Use them to share invaluable insights on jira dashboard for agile software teams work status and impress your audience. This template can be altered and modified as per your expectations. So, grab it now.

3 Month Digital Advertising Strategy With Budget Allocation Icons PDF
This slide highlights digital advertising plan which is helpful to enhance online presence of business. It showcases business goals, marketing strategies adopted, key performance indications, projected budget and time duration.Persuade your audience using this 3 Month Digital Advertising Strategy With Budget Allocation Icons PDF. This PPT design covers one stages, thus making it a great tool to use. It also caters to a variety of topics including Paid Advertising, Marketing Alignment, Lead Response. Download this PPT design now to present a convincing pitch that not only emphasizes the topic but also showcases your presentation skills.
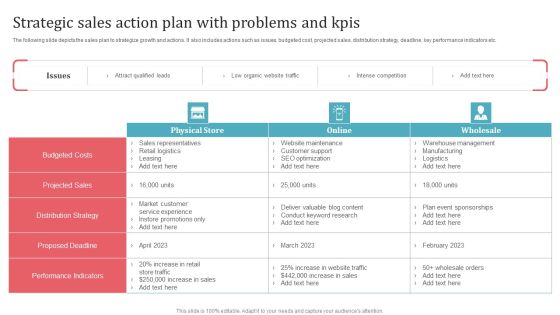
Strategic Sales Action Plan With Problems And Kpis Guidelines PDF
The following slide depicts the sales plan to strategize growth and actions. It also includes actions such as issues, budgeted cost, projected sales, distribution strategy, deadline, key performance indicators etc. Pitch your topic with ease and precision using this Strategic Sales Action Plan With Problems And Kpis Guidelines PDF. This layout presents information on Physical Store, Online, Wholesale. It is also available for immediate download and adjustment. So, changes can be made in the color, design, graphics or any other component to create a unique layout.
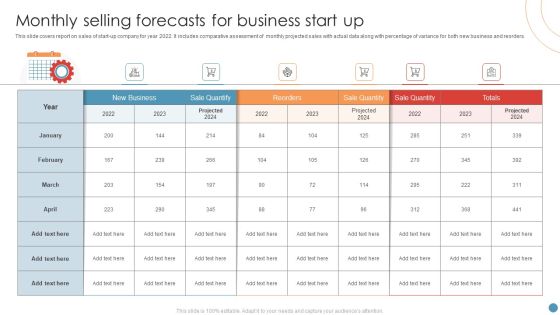
Monthly Selling Forecasts For Business Start Up Pictures PDF
This slide covers report on sales of start up company for year 2022. It includes comparative assessment of monthly projected sales with actual data along with percentage of variance for both new business and reorders. Showcasing this set of slides titled Monthly Selling Forecasts For Business Start Up Pictures PDF. The topics addressed in these templates are Sale Quantify, Business. All the content presented in this PPT design is completely editable. Download it and make adjustments in color, background, font etc. as per your unique business setting.

Data Interpretation And Analysis Playbook Search Driven Analytics Challenges Low Bi Adoption Rate And Poor Demonstration PDF
This template covers the problems while implementing search-driven analytics in the organization. The challenges are failure rate for BI projects and poor user experience stifles adoption. Presenting data interpretation and analysis playbook search driven analytics challenges low bi adoption rate and poor demonstration pdf to provide visual cues and insights. Share and navigate important information on two stages that need your due attention. This template can be used to pitch topics like business, data visualization, fundamental challenges. In addtion, this PPT design contains high resolution images, graphics, etc, that are easily editable and available for immediate download.
Tracking Performance Of Cloud Storage Deployment Dashboard Portrait PDF
The following slide highlights implementation of cloud storage performance tracking dashboard to improve innovation, to attain faster time to market. It includes components such as pinned folders, storage usage, recently used files, documents, images, videos, music, fonts, projects etc. Showcasing this set of slides titled Tracking Performance Of Cloud Storage Deployment Dashboard Portrait PDF. The topics addressed in these templates are Storage Usage, Dashboard, Tracking. All the content presented in this PPT design is completely editable. Download it and make adjustments in color, background, font etc. as per your unique business setting.

Strategic Market Summary Assessment Dashboard To Build Entry Planning Ppt Layouts Background Image PDF
The following slide highlights the KPIs of existing market to analyze and form entry plan for new market segment. It includes KPAs such as overview, competition, market share and size etc. Persuade your audience using this Strategic Market Summary Assessment Dashboard To Build Entry Planning Ppt Layouts Background Image PDF. This PPT design covers one stages, thus making it a great tool to use. It also caters to a variety of topics including Market Overview, Website Traffic, Projected Budget. Download this PPT design now to present a convincing pitch that not only emphasizes the topic but also showcases your presentation skills.

Dashboard Of Investment Summary With Group Wise And Yearly Total Investment Download PDF
This slide shows dashboard for stakeholders to provide visibility into programs, projects and portfolio aligned to purpose or aim. It includes yearly , group wise total investment and rate of return. Showcasing this set of slides titled Dashboard Of Investment Summary With Group Wise And Yearly Total Investment Download PDF. The topics addressed in these templates are Dashboard Of Investment Summary, Group Wise, Yearly Total Investment. All the content presented in this PPT design is completely editable. Download it and make adjustments in color, background, font etc. as per your unique business setting.

Controlling Customer Retention Preventing Churn Through Predictive Analytics Ppt Model Format PDF
Projecting the probability of future outcomes, events based on current and historical data. It utilizes different statistical techniques such as machine learning, pattern recognition through data mining, etc. This is a controlling customer retention preventing churn through predictive analytics ppt model format pdf template with various stages. Focus and dispense information on one stages using this creative set, that comes with editable features. It contains large content boxes to add your information on topics like preventing churn through predictive analytics. You can also showcase facts, figures, and other relevant content using this PPT layout. Grab it now.

Dashboard For Content Delivery Network Ppt PowerPoint Presentation File Styles PDF
This slide depicts the dashboard for content delivery network which projects the usage of resources, increase in data transfer and usage of CDN. From laying roadmaps to briefing everything in detail, our templates are perfect for you. You can set the stage with your presentation slides. All you have to do is download these easy to edit and customizable templates. Dashboard For Content Delivery Network Ppt PowerPoint Presentation File Styles PDF will help you deliver an outstanding performance that everyone would remember and praise you for. Do download this presentation today.

Key Components Of Enterprise Architectural Framework Clipart PDF
This slideshows the architecture to help businesses in connecting strategies with operations and projects in strong and meaningful ways. It includes details related to business mission and vision, strategies, key metrics, value streams etc. Pitch your topic with ease and precision using this Key Components Of Enterprise Architectural Framework Clipart PDF. This layout presents information on Strategies, Value Streams, Business Mission And Vision. It is also available for immediate download and adjustment. So, changes can be made in the color, design, graphics or any other component to create a unique layout.

Bridge Skill Gap Post Effective Performance Management System Implementation Demonstration PDF
The following slide depicts the projected employee skill progress post implementing updated improvement strategies, It includes elements such as negotiation skills, time management, decision making, problem solving, data analytics etc. Boost your pitch with our creative Bridge Skill Gap Post Effective Performance Management System Implementation Demonstration PDF. Deliver an awe-inspiring pitch that will mesmerize everyone. Using these presentation templates you will surely catch everyones attention. You can browse the ppts collection on our website. We have researchers who are experts at creating the right content for the templates. So you do not have to invest time in any additional work. Just grab the template now and use them.

Explainable Artificial Intelligence XAI From DARPA Designs PDF
This slide depicts the explainable artificial intelligence framework from the Defense Advanced Research Projects Agency of the United States of America. It includes components such as training data, novel machine-learning processes, explainable models, and so on. There are so many reasons you need a Explainable Artificial Intelligence XAI From DARPA Designs PDF. The first reason is you can not spend time making everything from scratch, Thus, Slidegeeks has made presentation templates for you too. You can easily download these templates from our website easily.

Implementation Steps Establish Basic Automation Processes Slides PDF
This slide covers various KPIs that need to be measured to achieve organizational goals. It includes metrics such as salespersons performance report, number of leads converted, leads generated through campaigns, monthly sales report, number of unresolved cases, etc. Deliver and pitch your topic in the best possible manner with this Implementation Steps Establish Basic Automation Processes Slides PDF. Use them to share invaluable insights on Defined Through, Sales Managers, Projects Notifying and impress your audience. This template can be altered and modified as per your expectations. So, grab it now.

Initiatives To Enhance Environmental Compliance Plan Introduction PDF
The slide showcases suggestions to help EH and S managers enhance their environmental efforts in organizational projects and re-invent companys environmental compliance strategy. It covers aspects such as strategic tips, initiatives and associated benefits. Persuade your audience using this Initiatives To Enhance Environmental Compliance Plan Introduction PDF. This PPT design covers three stages, thus making it a great tool to use. It also caters to a variety of topics including Routine Internal Audits, Organizations, Consistent Data. Download this PPT design now to present a convincing pitch that not only emphasizes the topic but also showcases your presentation skills.

Defining Work And Set Responsibilities Of Team Members Ideas PDF
This slide highlights roles and responsibilities of team members associated with quality risk management. This is a building projects risk landscape vendor supplier analysis dashboard guidelines pdf template with various stages. Focus and dispense information on four stages using this creative set, that comes with editable features. It contains large content boxes to add your information on topics like defining work and set responsibilities of team members. You can also showcase facts, figures, and other relevant content using this PPT layout. Grab it now.
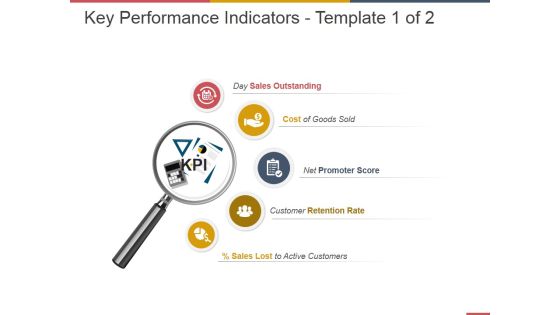
Key Performance Indicators Template 1 Ppt PowerPoint Presentation Portfolio
This is a key performance indicators template 1 ppt powerpoint presentation portfolio. This is a five stage process. The stages in this process are sales outstanding, cost of goods sold, promoter score, retention rate, active customers.

Business Analysis Data Charts And Reports Ppt Powerpoint Presentation Ideas Portrait
This is a business analysis data charts and reports ppt powerpoint presentation ideas portrait. This is a three stage process. The stages in this process are business metrics, business kpi, business dashboard.

Calculator With Business Reports For Operational Efficiency Ppt Powerpoint Presentation Ideas Infographic Template
This is a calculator with business reports for operational efficiency ppt powerpoint presentation ideas infographic template. This is a four stage process. The stages in this process are business metrics, business kpi, business dashboard.

Running Facebook Advertisement Campaign To Boost Sales Ppt PowerPoint Presentation File Portfolio PDF
The following slide outlines overview of Facebook ad campaign that can assist brands in increasing product or service revenue. The slide provides information about campaign goals, ad format, projected expenditure, target audience, content techniques, and key performance indicators KPIs. The Running Facebook Advertisement Campaign To Boost Sales Ppt PowerPoint Presentation File Portfolio PDF is a compilation of the most recent design trends as a series of slides. It is suitable for any subject or industry presentation, containing attractive visuals and photo spots for businesses to clearly express their messages. This template contains a variety of slides for the user to input data, such as structures to contrast two elements, bullet points, and slides for written information. Slidegeeks is prepared to create an impression.
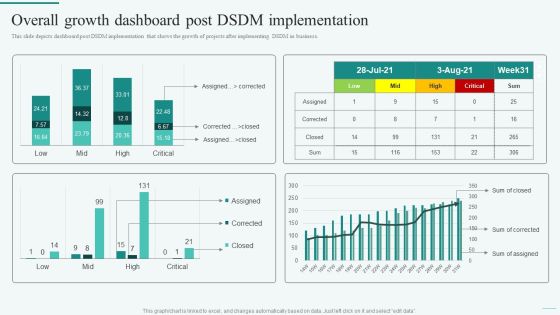
Overall Growth Dashboard Post DSDM Implementation Integration Of Dynamic System To Enhance Processes Designs PDF
This slide depicts dashboard post DSDM implementation that shows the growth of projects after implementing DSDM in business.Here you can discover an assortment of the finest PowerPoint and Google Slides templates. With these templates, you can create presentations for a variety of purposes while simultaneously providing your audience with an eye-catching visual experience. Download Overall Growth Dashboard Post DSDM Implementation Integration Of Dynamic System To Enhance Processes Designs PDF to deliver an impeccable presentation. These templates will make your job of preparing presentations much quicker, yet still, maintain a high level of quality. Slidegeeks has experienced researchers who prepare these templates and write high-quality content for you. Later on, you can personalize the content by editing the Overall Growth Dashboard Post DSDM Implementation Integration Of Dynamic System To Enhance Processes Designs PDF.

Deploying Content Distribution Network System Dashboard For Content Delivery Network Mockup PDF
This slide depicts the dashboard for content delivery network which projects the usage of resources, increase in data transfer and usage of CDN. Find highly impressive Deploying Content Distribution Network System Dashboard For Content Delivery Network Mockup PDF on Slidegeeks to deliver a meaningful presentation. You can save an ample amount of time using these presentation templates. No need to worry to prepare everything from scratch because Slidegeeks experts have already done a huge research and work for you. You need to download Deploying Content Distribution Network System Dashboard For Content Delivery Network Mockup PDF for your upcoming presentation. All the presentation templates are 100 percent editable and you can change the color and personalize the content accordingly. Download now

Strategic Marketing For Hair And Beauty Salon To Increase Examining Impact Of Clients Formats PDF
This slide analyzes the relationship between frequency of client visits and business revenue. It includes two tables showcasing current projections and what if analysis covering metrics such as average weekly service sales, average number of visits per year, number of new clients per month, etc. Boost your pitch with our creative Strategic Marketing For Hair And Beauty Salon To Increase Examining Impact Of Clients Formats PDF. Deliver an awe-inspiring pitch that will mesmerize everyone. Using these presentation templates you will surely catch everyones attention. You can browse the ppts collection on our website. We have researchers who are experts at creating the right content for the templates. So you do not have to invest time in any additional work. Just grab the template now and use them.

Essential Factors To Develop Sales Remuneration Strategy Ppt Gallery Graphics PDF
The following slide highlights the essential factors to develop sales commission scheme. It illustrates company goals, roles in team, budget and industry, on target earnings, sales team kpi, company culture and payout. Persuade your audience using this Essential Factors To Develop Sales Remuneration Strategy Ppt Gallery Graphics PDF. This PPT design covers seven stages, thus making it a great tool to use. It also caters to a variety of topics including Company Goals, Budget And Industry, On Target Earnings, Sales Team KPI. Download this PPT design now to present a convincing pitch that not only emphasizes the topic but also showcases your presentation skills.

Steps Of Yearly Operations Planning Process Ppt PowerPoint Presentation Gallery Template PDF
The following slide showcases various steps of annual operations planning process. It includes key steps like gather diversified team, analyze precious years, set realistic goals, determine KPI, prepare monthly budgets, plan for future and revisit regularly. Pitch your topic with ease and precision using this Steps Of Yearly Operations Planning Process Ppt PowerPoint Presentation Gallery Template PDF. This layout presents information on Analyze Previous Years, Set Realistic Objectives, Determine KPI. It is also available for immediate download and adjustment. So, changes can be made in the color, design, graphics or any other component to create a unique layout.
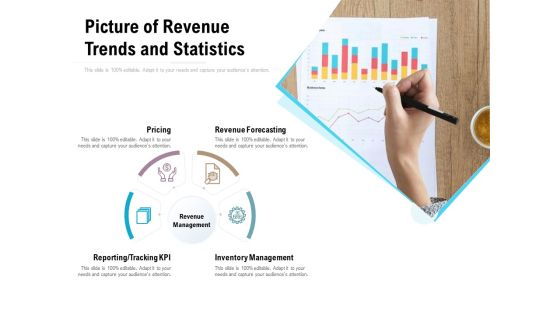
Picture Of Revenue Trends And Statistics Ppt PowerPoint Presentation Ideas Backgrounds
Presenting this set of slides with name picture of revenue trends and statistics ppt powerpoint presentation ideas backgrounds. This is a four stage process. The stages in this process are pricing, revenue forecasting, inventory management, reporting, tracking kpi, revenue management. This is a completely editable PowerPoint presentation and is available for immediate download. Download now and impress your audience.

Revenue Planning Framework With Inventory Management Ppt PowerPoint Presentation Show Smartart
Presenting this set of slides with name revenue planning framework with inventory management ppt powerpoint presentation show smartart. This is a four stage process. The stages in this process are revenue forecasting, pricing, inventory management, reporting, tracking kpi. This is a completely editable PowerPoint presentation and is available for immediate download. Download now and impress your audience.

Essential Key Performance Indicators In Investment Summary Demonstration PDF
The following slide showcases dashboard of portfolio summary with important key performance indicators to provide an oversight of the project. Key metrics covered are cost, work, variance, active risk and issues. Showcasing this set of slides titled Essential Key Performance Indicators In Investment Summary Demonstration PDF. The topics addressed in these templates are Cost, Active Risks, Projects. All the content presented in this PPT design is completely editable. Download it and make adjustments in color, background, font etc. as per your unique business setting.
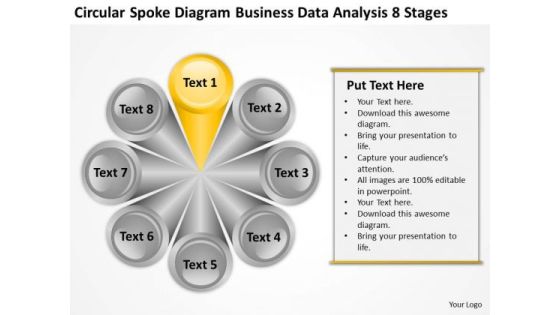
Diagram Business Data Analysis 8 Stages Ppt For Plan PowerPoint Templates
We present our diagram business data analysis 8 stages ppt for plan PowerPoint templates.Download our Process and Flows PowerPoint Templates because Our PowerPoint Templates and Slides will give you great value for your money. Be assured of finding the best projection to highlight your words. Present our Circle Charts PowerPoint Templates because Our PowerPoint Templates and Slides will let you Leave a lasting impression to your audiences. They possess an inherent longstanding recall factor. Use our Business PowerPoint Templates because Our PowerPoint Templates and Slides are like the strings of a tennis racquet. Well strung to help you serve aces. Present our Marketing PowerPoint Templates because You should Press the right buttons with our PowerPoint Templates and Slides. They will take your ideas down the perfect channel. Download our Shapes PowerPoint Templates because Our PowerPoint Templates and Slides help you pinpoint your timelines. Highlight the reasons for your deadlines with their use.Use these PowerPoint slides for presentations relating to Provider, plan, vector, diagram, circle, insurance, graphic, service, graph, wheel, illustration, chart, round, primary, specialist, clipart, care, choosing, clip, blue, text, physician, maintenance, , organization, art, preferred, point, deductible, business. The prominent colors used in the PowerPoint template are Orange, Gray, Black.
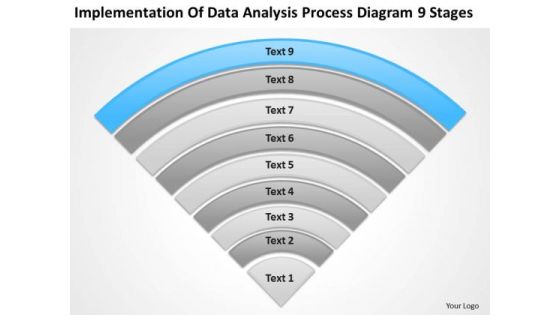
Implementation Of Data Analysis Process Diagram 9 Stages Ppt Business Plan PowerPoint Templates
We present our implementation of data analysis process diagram 9 stages ppt business plan PowerPoint templates.Download and present our Process and Flows PowerPoint Templates because You are an avid believer in ethical practices. Highlight the benefits that accrue with our PowerPoint Templates and Slides. Present our Triangles PowerPoint Templates because Our PowerPoint Templates and Slides will Activate the energies of your audience. Get their creative juices flowing with your words. Present our Business PowerPoint Templates because It will Raise the bar of your Thoughts. They are programmed to take you to the next level. Present our Shapes PowerPoint Templates because Our PowerPoint Templates and Slides will give you great value for your money. Be assured of finding the best projection to highlight your words. Present our Marketing PowerPoint Templates because You can Be the star of the show with our PowerPoint Templates and Slides. Rock the stage with your ideas.Use these PowerPoint slides for presentations relating to Color, print, plate, paint, diagram, chart, process, gamma, press, isolated, semicircle, white, sample, spectrum, pantone, template, circle, sampler, guide, graphic, printout, technology, , computer, management, palette, illustration, spectral, object, system, round, design, selection, choice, rainbow, chooser. The prominent colors used in the PowerPoint template are Blue, Gray, Black.
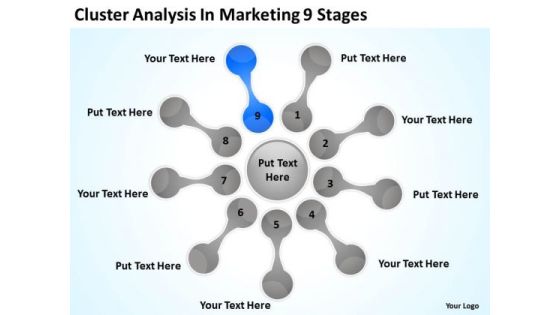
Cluster Analysis In Marketing 9 Stages Actual Business Plan Examples PowerPoint Slides
We present our cluster analysis in marketing 9 stages actual business plan examples PowerPoint Slides.Download and present our Business PowerPoint Templates because Our PowerPoint Templates and Slides are the chords of your song. String them along and provide the lilt to your views. Download and present our Flow Charts PowerPoint Templates because Our PowerPoint Templates and Slides will provide weight to your words. They will bring out the depth of your thought process. Download and present our Process and Flows PowerPoint Templates because Our PowerPoint Templates and Slides are conceived by a dedicated team. Use them and give form to your wondrous ideas. Download and present our Marketing PowerPoint Templates because Our PowerPoint Templates and Slides will give you great value for your money. Be assured of finding the best projection to highlight your words. Download and present our Shapes PowerPoint Templates because Our PowerPoint Templates and Slides will let you Illuminate the road ahead to Pinpoint the important landmarks along the way.Use these PowerPoint slides for presentations relating to Mapping, vector, chart, flow, flowchart, process, model, step, tool, blank, processdiagram, concept, topic, presentation, relate, circle, graphic, data, report, marketing, idea, circlepattern, team, management, graph, cycle, illustration, connection, processchart,direction, plans, color, text, phase, organization, control, connect, link, explanation, mapping, present. The prominent colors used in the PowerPoint template are Blue, Gray, Black.
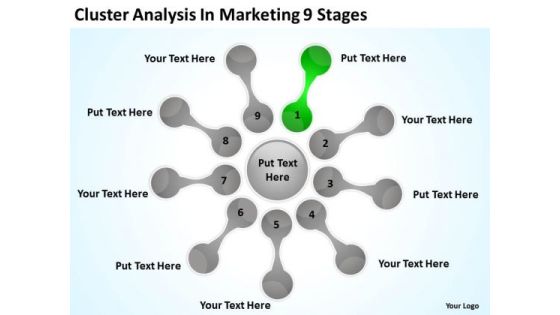
Cluster Analysis In Marketing 9 Stages Basic Business Plan Outline PowerPoint Templates
We present our cluster analysis in marketing 9 stages basic business plan outline PowerPoint templates.Present our Process and Flows PowerPoint Templates because It is Aesthetically crafted by artistic young minds. Our PowerPoint Templates and Slides are designed to display your dexterity. Download our Flow Charts PowerPoint Templates because Our PowerPoint Templates and Slides will give you great value for your money. Be assured of finding the best projection to highlight your words. Use our Marketing PowerPoint Templates because Our PowerPoint Templates and Slides will weave a web of your great ideas. They are gauranteed to attract even the most critical of your colleagues. Download our Shapes PowerPoint Templates because It will let you Set new benchmarks with our PowerPoint Templates and Slides. They will keep your prospects well above par. Use our Business PowerPoint Templates because They will Put your wonderful verbal artistry on display. Our PowerPoint Templates and Slides will provide you the necessary glam and glitter.Use these PowerPoint slides for presentations relating to Mapping, vector, chart, flow, flowchart, process, model, step, tool, blank, processdiagram, concept, topic, presentation, relate, circle, graphic, data, report, marketing, idea, circlepattern, team, management, graph, cycle, illustration, connection, processchart,direction, plans, color, text, phase, organization, control, connect, link, explanation, mapping, present. The prominent colors used in the PowerPoint template are Gray, Green, White.
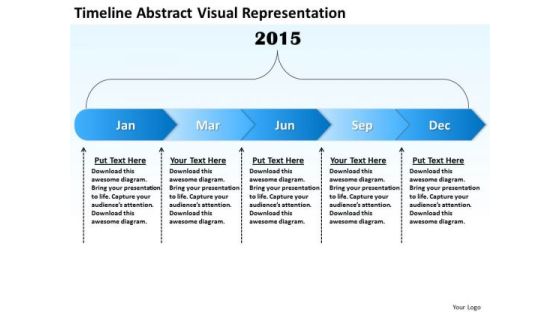
Business Process Flow Diagrams Timeline Abstract Visual Representation Ppt PowerPoint Slides
We present our business process flow diagrams timeline abstract visual representation ppt PowerPoint Slides.Use our Business PowerPoint Templates because Our PowerPoint Templates and Slides will give you great value for your money. Be assured of finding the best projection to highlight your words. Download and present our Process and Flows PowerPoint Templates because Our PowerPoint Templates and Slides will fulfill your every need. Use them and effectively satisfy the desires of your audience. Download our Shapes PowerPoint Templates because Our PowerPoint Templates and Slides help you pinpoint your timelines. Highlight the reasons for your deadlines with their use. Download our Arrows PowerPoint Templates because Our PowerPoint Templates and Slides are designed to help you succeed. They have all the ingredients you need. Use our Shapes PowerPoint Templates because Our PowerPoint Templates and Slides has conjured up a web of all you need with the help of our great team. Use them to string together your glistening ideas.Use these PowerPoint slides for presentations relating to abstract, algorithm, algorithmic, analysis, analyze, chart, cluster, clustering, connections, data, dataset, decision, depth, edge, elements, else, equal, graph, layers, level, messaging, mining,multiple, networking, nodes, objects, parent, path, pen, representation, root, route, routing, sampling, science, scientific, social, structure, subset, system, technology, traverse, visual. The prominent colors used in the PowerPoint template are Blue, Blue light, White.
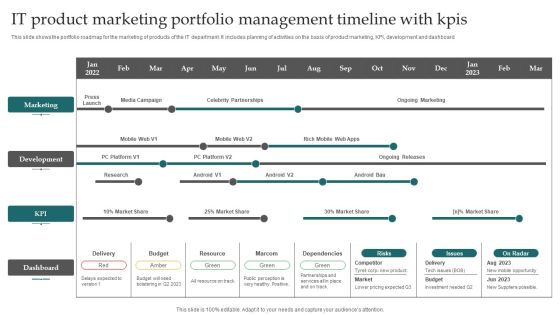
IT Product Marketing Portfolio Management Timeline With Kpis Elements PDF
This slide shows the portfolio roadmap for the marketing of products of the IT department. It includes planning of activities on the basis of product marketing, KPI, development and dashboard. Showcasing this set of slides titled IT Product Marketing Portfolio Management Timeline With Kpis Elements PDF. The topics addressed in these templates are Marketing, Development, Budget. All the content presented in this PPT design is completely editable. Download it and make adjustments in color, background, font etc. as per your unique business setting.
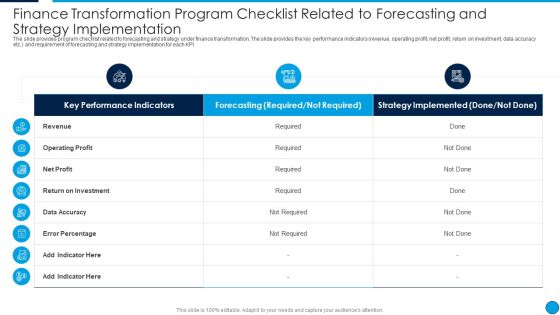
Summary Finance Transformation Program Checklist Related To Forecasting Clipart PDF
The slide provides program checklist related to forecasting and strategy under finance transformation. The slide provides the key performance indicators revenue, operating profit, net profit, return on investment, data accuracy etc. and requirement of forecasting and strategy implementation for each KPI. Deliver and pitch your topic in the best possible manner with this Summary Finance Transformation Program Checklist Related To Forecasting Clipart PDF. Use them to share invaluable insights on Key Performance Indicators, Forecasting Required, Not Required, Strategy Implemented, Return On Investment and impress your audience. This template can be altered and modified as per your expectations. So, grab it now.
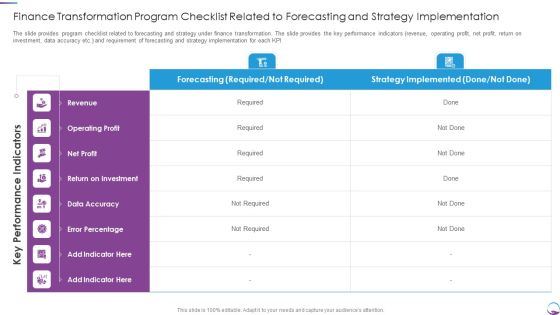
Finance Transformation Program Checklist Related To Forecasting And Strategy Implementation Pictures PDF
The slide provides program checklist related to forecasting and strategy under finance transformation. The slide provides the key performance indicators revenue, operating profit, net profit, return on investment, data accuracy etc. and requirement of forecasting and strategy implementation for each KPI. Deliver and pitch your topic in the best possible manner with this Finance Transformation Program Checklist Related To Forecasting And Strategy Implementation Pictures PDF. Use them to share invaluable insights on Finance Transformation Program Checklist Related To Forecasting And Strategy Implementation and impress your audience. This template can be altered and modified as per your expectations. So, grab it now.
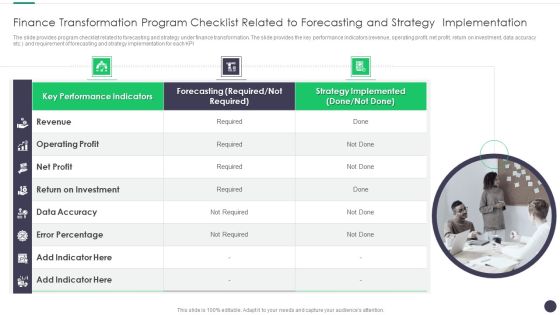
Finance And Accounting Online Conversion Plan Finance Transformation Program Brochure PDF
The slide provides program checklist related to forecasting and strategy under finance transformation. The slide provides the key performance indicators revenue, operating profit, net profit, return on investment, data accuracy etc. and requirement of forecasting and strategy implementation for each KPI. This is a Finance And Accounting Online Conversion Plan Finance Transformation Program Brochure PDF template with various stages. Focus and dispense information on one stage using this creative set, that comes with editable features. It contains large content boxes to add your information on topics like Performance Indicators, Strategy Implemented, Revenue. You can also showcase facts, figures, and other relevant content using this PPT layout. Grab it now.
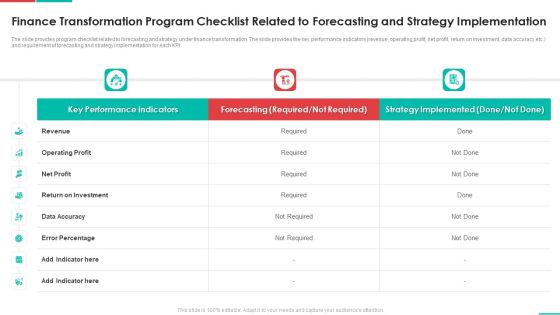
Roadmap For Financial Accounting Transformation Finance Transformation Program Checklist Related Themes PDF
The slide provides program checklist related to forecasting and strategy under finance transformation. The slide provides the key performance indicators revenue, operating profit, net profit, return on investment, data accuracy etc. and requirement of forecasting and strategy implementation for each KPI. Deliver and pitch your topic in the best possible manner with this roadmap for financial accounting transformation finance transformation program checklist related themes pdf. Use them to share invaluable insights on revenue, operating profit, net profit, return on investment, data accuracy and impress your audience. This template can be altered and modified as per your expectations. So, grab it now.

Real Estate Outlook Ppt PowerPoint Presentation Layout
This is a real estate outlook ppt powerpoint presentation layout. This is a one stage process. The stages in this process are business, marketing, management, real estate, innovation.

Key Performance Indicators Template 2 Ppt PowerPoint Presentation Microsoft
This is a key performance indicators template 2 ppt powerpoint presentation microsoft. This is a four stage process. The stages in this process are business, table, marketing, strategy, data.

Small Business Network Diagram 3d Man With Lots Of Question PowerPoint Slides
We present our small business network diagram 3d man with lots of question PowerPoint Slides.Download our People PowerPoint Templates because Our PowerPoint Templates and Slides will help you be quick off the draw. Just enter your specific text and see your points hit home. Use our Symbol PowerPoint Templates because They will Put the wind in your sails. Skim smoothly over the choppy waters of the market. Present our Signs PowerPoint Templates because Our PowerPoint Templates and Slides are focused like a searchlight beam. They highlight your ideas for your target audience. Present our Business PowerPoint Templates because You can Create a matrix with our PowerPoint Templates and Slides. Feel the strength of your ideas click into place. Use our Shapes PowerPoint Templates because You can Hit a home run with our PowerPoint Templates and Slides. See your ideas sail into the minds of your audience.Use these PowerPoint slides for presentations relating to 3d, Afraid, Analyze, Answer, Ask, Business, Confusion, Cover, Decision, Discovery, Emotion, Fear, Find, Forecasting, Head, Hide, Human, Idea, Information, Isolated, Issue, Man, Mark, Mystery, Nervous, Problem, Puzzled, Question, Research, Risk, Scared, Search, Sign, Solution, Strategy, Symbol, Think, Trouble, Uncertainty, Work, Worry. The prominent colors used in the PowerPoint template are Yellow, White, Gray. PowerPoint presentation experts tell us our small business network diagram 3d man with lots of question PowerPoint Slides effectively help you save your valuable time. Professionals tell us our Cover PowerPoint templates and PPT Slides are visually appealing. People tell us our small business network diagram 3d man with lots of question PowerPoint Slides provide you with a vast range of viable options. Select the appropriate ones and just fill in your text. Presenters tell us our Analyze PowerPoint templates and PPT Slides have awesome images to get your point across. Professionals tell us our small business network diagram 3d man with lots of question PowerPoint Slides provide great value for your money. Be assured of finding the best projection to highlight your words. We assure you our Ask PowerPoint templates and PPT Slides are designed by a team of presentation professionals.

Business Organizational Chart Examples Render Of Humans Under Magnifying 1 PowerPoint Templates
We present our business organizational chart examples render of humans under magnifying 1 PowerPoint templates.Download our People PowerPoint Templates because You have a driving passion to excel in your field. Our PowerPoint Templates and Slides will prove ideal vehicles for your ideas. Download and present our Magnifier Glasses PowerPoint Templates because It can Bubble and burst with your ideas. Download our Shapes PowerPoint Templates because Our PowerPoint Templates and Slides have the Brilliant backdrops. Guaranteed to illuminate the minds of your audience. Present our Success PowerPoint Templates because Our PowerPoint Templates and Slides will Activate the energies of your audience. Get their creative juices flowing with your words. Use our Business PowerPoint Templates because Our PowerPoint Templates and Slides help you pinpoint your timelines. Highlight the reasons for your deadlines with their use.Use these PowerPoint slides for presentations relating to 3d, Best Candidate, Business, Business Network, Candidate, Career, Career Builder, Career Choice, Character, Choice, Choosing, Discovery, Employment Issues, Found, Head Hunter, Human, Human Resources, Isolated, Job, Job Search, Job Searching, Magnify, Magnifying Glass, Man, Occupation, People, Recruitment, Render, Research, Searching, Selection, Unemployment. The prominent colors used in the PowerPoint template are Purple, Yellow, Gray. PowerPoint presentation experts tell us our business organizational chart examples render of humans under magnifying 1 PowerPoint templates will impress their bosses and teams. Professionals tell us our Candidate PowerPoint templates and PPT Slides provide great value for your money. Be assured of finding the best projection to highlight your words. People tell us our business organizational chart examples render of humans under magnifying 1 PowerPoint templates will help them to explain complicated concepts. Presenters tell us our Candidate PowerPoint templates and PPT Slides will make the presenter successul in his career/life. Professionals tell us our business organizational chart examples render of humans under magnifying 1 PowerPoint templates are specially created by a professional team with vast experience. They diligently strive to come up with the right vehicle for your brilliant Ideas. We assure you our Business PowerPoint templates and PPT Slides are topically designed to provide an attractive backdrop to any subject.

Business Development Process Flowchart Man Highlighted Over Magnifying Glass PowerPoint Templates
We present our business development process flowchart man highlighted over magnifying glass PowerPoint templates.Download and present our Symbol PowerPoint Templates because Our PowerPoint Templates and Slides will let you Clearly mark the path for others to follow. Download and present our People PowerPoint Templates because You can Score a slam dunk with our PowerPoint Templates and Slides. Watch your audience hang onto your every word. Download and present our Business PowerPoint Templates because Our PowerPoint Templates and Slides will give good value for money. They also have respect for the value of your time. Use our Magnifier Glasses PowerPoint Templates because Our PowerPoint Templates and Slides will steer your racing mind. Hit the right buttons and spur on your audience. Download and present our Shapes PowerPoint Templates because It will let you Set new benchmarks with our PowerPoint Templates and Slides. They will keep your prospects well above par.Use these PowerPoint slides for presentations relating to 3d, Abstract, Analyzing, Background, Blue, Boss, Business, Concept, Discovery, Employment, Enlarge, Examine, Find, Focus, Glass, Human, Illustration, Individuality, Inspect, Inspection, Investigation, Isolated, Job, Leader, Leadership, Lens, Look, Magnifier, Magnify, Magnifying, Men, People, Person, Quest, Red, Research, Resources, Row, Search, Selection, Series, Solution, Symbol, Team, Teamwork. The prominent colors used in the PowerPoint template are Blue, Gray, Black. PowerPoint presentation experts tell us our business development process flowchart man highlighted over magnifying glass PowerPoint templates help you meet deadlines which are an element of today's workplace. Just browse and pick the slides that appeal to your intuitive senses. Use our Concept PowerPoint templates and PPT Slides are second to none. You can be sure our business development process flowchart man highlighted over magnifying glass PowerPoint templates provide great value for your money. Be assured of finding the best projection to highlight your words. Presenters tell us our Concept PowerPoint templates and PPT Slides are effectively colour coded to prioritise your plans They automatically highlight the sequence of events you desire. You can be sure our business development process flowchart man highlighted over magnifying glass PowerPoint templates will get their audience's attention. Professionals tell us our Concept PowerPoint templates and PPT Slides are readymade to fit into any presentation structure.

Change Metrics To Analyze Status By Priority Formats PDF
The following slide displays dashboard for real time tracking of major change kpis of the organization. It includes elements such as requests, projects, open, approved, review, in- progress, etc. Pitch your topic with ease and precision using this Change Metrics To Analyze Status By Priority Formats PDF This layout presents information on Project, Request Statistics, Priority. It is also available for immediate download and adjustment. So, changes can be made in the color, design, graphics or any other component to create a unique layout.

Asset Usage And Monitoring With Resource Management Plan Optimize Resource Utilization Clipart PDF
This slides shows the optimize resource utilization scenario output which includes key metrics, included projects, excluded projects, optimizing suggestions, etc.Deliver and pitch your topic in the best possible manner with this asset usage and monitoring with resource management plan optimize resource utilization clipart pdf Use them to share invaluable insights on included projects, excluded projects, optimizing suggestions and impress your audience. This template can be altered and modified as per your expectations. So, grab it now.

Business Opportunity Dashboard With Customer Metrics Information PDF
This Slide illustrates market opportunity dashboard with customer metrics which contains favorable net promoter score NPS, standard customers, growth rate, cumulative average of customer location, net income vs projection, customer distribution, sales by representatives, etc. Pitch your topic with ease and precision using this Business Opportunity Dashboard With Customer Metrics Information PDF. This layout presents information on Customer Distribution, Growth Rate, Top Customers Locations. It is also available for immediate download and adjustment. So, changes can be made in the color, design, graphics or any other component to create a unique layout.

Five Warehouse Key Efficiency Management Indicators Analysis Table Demonstration PDF
This slide shows the table representing the key metrics for measurement of performance of warehouse system of an organization. It includes data related to five activities of receiving, put away, storage, order picking and shipping of products. Showcasing this set of slides titled Five Warehouse Key Efficiency Management Indicators Analysis Table Demonstration PDF. The topics addressed in these templates are Activity, Received, Storage. All the content presented in this PPT design is completely editable. Download it and make adjustments in color, background, font etc. as per your unique business setting.

Seven Stages Web Data Analysis Identify Key Performance Indicators Ppt PowerPoint Presentation Infographics Example Topics Cpb
This is a seven stages web data analysis identify key performance indicators ppt powerpoint presentation infographics example topics cpb. This is a seven stage process. The stages in this process are data analysis, analytics architecture, analytics framework.

Cost Reporting Dashboard Example Powerpoint Slides
This is a cost reporting dashboard example powerpoint slides. This is a five stage process. The stages in this process are cost, quality, project, process planning, analysis.
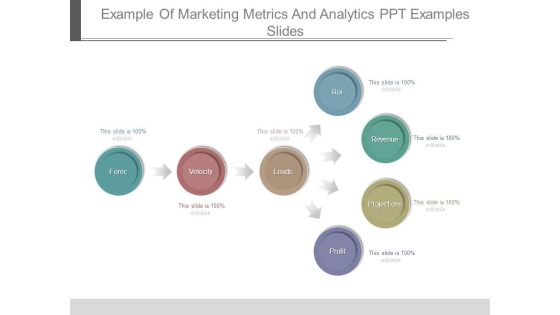
Example Of Marketing Metrics And Analytics Ppt Examples Slides
This is a example of marketing metrics and analytics ppt examples slides. This is a seven stage process. The stages in this process are forec, velocity, leads, roi, revenue, projections, profit.

Business To Business Model Flat Pricing Model Ppt File Grid PDF
This slide shows business to business B2B flat pricing model. It provides information about unlimited projects, company dashboard, unlimited users, team projects, storage space, unlimited clients, etc. Persuade your audience using this Business To Business Model Flat Pricing Model Ppt File Grid PDF. This PPT design covers six stages, thus making it a great tool to use. It also caters to a variety of topics including Unlimited Project, Unlimited Users, Team Projects. Download this PPT design now to present a convincing pitch that not only emphasizes the topic but also showcases your presentation skills.

Key Business Metrics To Track Ecommerce User On Boarding Success Pictures PDF
This slide signifies the key organisation metric to measure ecommerce onboading plan. It covers information about kpis, key description, projection, actual and variance. Pitch your topic with ease and precision using this Key Business Metrics To Track Ecommerce User On Boarding Success Pictures PDF. This layout presents information on Key Description, Projection, Variance. It is also available for immediate download and adjustment. So, changes can be made in the color, design, graphics or any other component to create a unique layout.
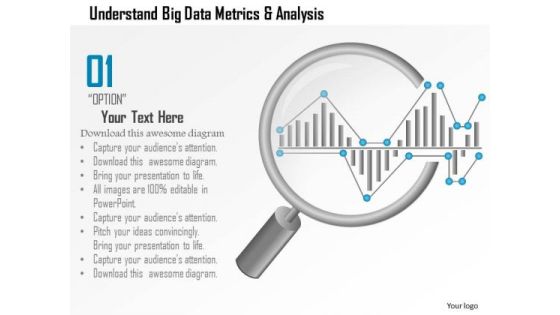
Business Diagram Understand Big Data Metrics And Analysis Showing By Magnifying Glass Ppt Slide
This PPT slide has been designed with big data metrics and magnifying glass. This diagram helps to portray concept of data analysis and data search. Download this diagram to make professional presentations.

Critical Drivers Of Organizational Success Example Ppt Slide Template
This is a critical drivers of organizational success example ppt slide template. This is a seven stage process. The stages in this process are sale, productivity, expense control, cash flow, regulatory compliance, customer service, developmental projects.

Customer Acquisition Management Ppt PowerPoint Presentation Files
This is a customer acquisition management ppt powerpoint presentation files. This is a four stage process. The stages in this process are build connections, assess specific needs of project, execute campaigns, response management.

Information Studies Dashboard For Data Science Implementation Structure PDF
This slide depicts the dashboard for data integration in the business, and it is showing real time details about expenses, profits, margins percentage, and new addition projects. Deliver an awe inspiring pitch with this creative Information Studies Dashboard For Data Science Implementation Structure PDF bundle. Topics like New Additions Projects, Margin, Expenses can be discussed with this completely editable template. It is available for immediate download depending on the needs and requirements of the user.

Enterprise Governance Business Management Kpis Metrics Demonstration PDF
Deliver and pitch your topic in the best possible manner with this enterprise governance business management kpis metrics demonstration pdf. Use them to share invaluable insights on new clients, delayed projects, gross profit margin and impress your audience. This template can be altered and modified as per your expectations. So, grab it now.

Predictive Analytics Steps Ppt PowerPoint Presentation Styles Guidelines
This is a predictive analytics steps ppt powerpoint presentation styles guidelines. This is a six stage process. The stages in this process are define project, data collection, data analysis, statistics, stages, benefits.

Predictive Analytics Steps Ppt PowerPoint Presentation Portfolio Template
This is a predictive analytics steps ppt powerpoint presentation portfolio template. This is a six stage process. The stages in this process are define project, benefits, stages, statistics, data analysis.
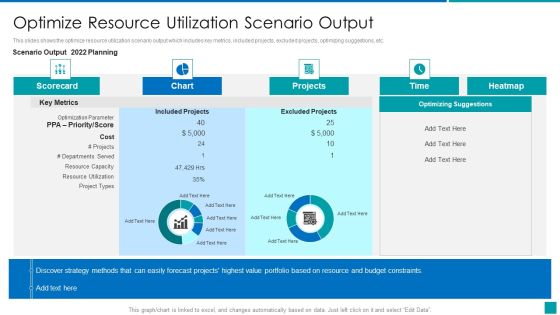
Optimize Resource Utilization Scenario Output Rules PDF
This slides shows the optimize resource utilization scenario output which includes key metrics, included projects, excluded projects, optimizing suggestions, etc. Deliver and pitch your topic in the best possible manner with this Optimize Resource Utilization Scenario Output Rules PDF. Use them to share invaluable insights on Portfolio, Strategy, Budget, Resource and impress your audience. This template can be altered and modified as per your expectations. So, grab it now.
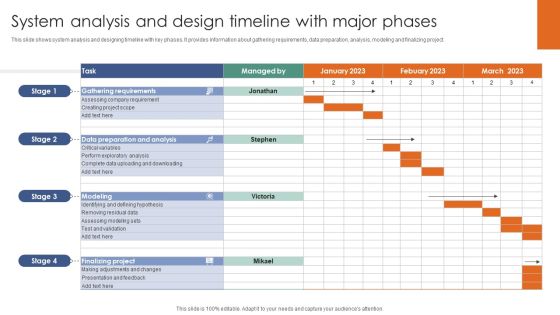
System Analysis And Design Timeline With Major Phases Ppt Pictures Slide Portrait PDF
This slide shows system analysis and designing timeline with key phases. It provides information about gathering requirements, data preparation, analysis, modeling and finalizing project. Showcasing this set of slides titled System Analysis And Design Timeline With Major Phases Ppt Pictures Slide Portrait PDF. The topics addressed in these templates are Modeling, Finalizing Project, Gathering Requirements. All the content presented in this PPT design is completely editable. Download it and make adjustments in color, background, font etc. as per your unique business setting.

Business Strategy Development Process Business Management Kpis Metrics Clients Introduction PDF
Deliver an awe inspiring pitch with this creative business strategy development process business management kpis metrics clients introduction pdf bundle. Topics like delayed projects, ports, new clients, new orders can be discussed with this completely editable template. It is available for immediate download depending on the needs and requirements of the user.

Dashboard To Track Energy Efficiency After Campaign Implementation Pictures PDF
This slide consists of a Dashboard which can be used to track energy saving which will be used by managers to track effectiveness of program implementation. The key performance indicators include electric vs gas allocation, equipment activity, changes in costs, budget load etc. Showcasing this set of slides titled Dashboard To Track Energy Efficiency After Campaign Implementation Pictures PDF. The topics addressed in these templates are Equipment Activity, Budget Load, Cost Projection. All the content presented in this PPT design is completely editable. Download it and make adjustments in color, background, font etc. as per your unique business setting.

Sales Forecasting Analysis Powerpoint Slide Ideas
This is a sales forecasting analysis powerpoint slide ideas. This is a three stage process. The stages in this process are collect and analysis data, calculate sales forecast, determine forecasting method.
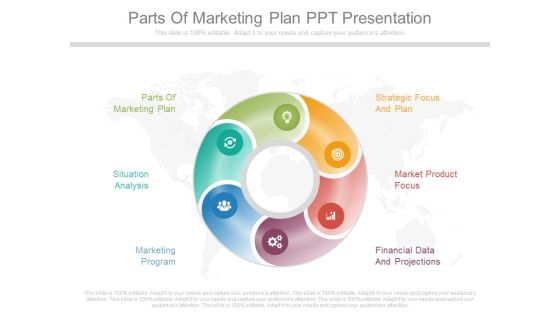
Parts Of Marketing Plan Ppt Presentation
This is a parts of marketing plan ppt presentation. This is a six stage process. The stages in this process are parts of marketing plan, strategic focus and plan, situation analysis, market product focus, marketing program, financial data and projections.
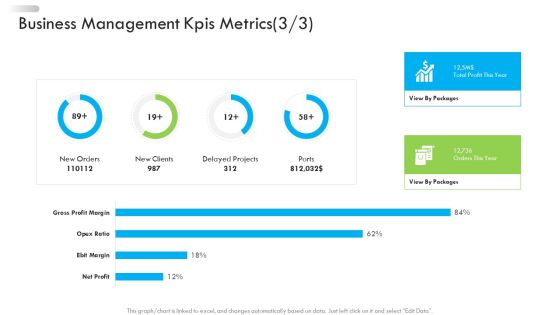
Enterprise Tactical Planning Enterprise Tactical Planning Business Management Kpis Metrics Ports Formats PDF
Deliver an awe-inspiring pitch with this creative enterprise tactical planning enterprise tactical planning business management kpis metrics ports formats pdf bundle. Topics like delayed projects, ports, new clients, gross profit margin, net profit can be discussed with this completely editable template. It is available for immediate download depending on the needs and requirements of the user.
External Analysis Labour Market Forecasts Ppt PowerPoint Presentation Icon Guidelines
This is a external analysis labour market forecasts ppt powerpoint presentation icon guidelines. This is a seven stage process. The stages in this process are labour market characteristic, tables, data, analysis, planning.

Business Analyst Key Skills Diagram Powerpoint Ideas
This is a business analyst key skills diagram powerpoint ideas. This is a four stage process. The stages in this process are business analysis role skills and abilities, business analysis role, personal underlying competencies and characteristics, techniques and tools experiences and skills, data and process modelling, requirements workshops, prototyping, interviewing, metrics and key performance indicators, vendor and software assessment.

Forecast Analysis Technique IT Methods Of Data Clustering In Predictive Modeling Formats PDF
This slide outlines the two primary information clustering methods used in the predictive analytics clustering model. The methods include K means and K nearest neighbor clustering, including the working of both approaches. Create an editable Forecast Analysis Technique IT Methods Of Data Clustering In Predictive Modeling Formats PDF that communicates your idea and engages your audience. Whether you are presenting a business or an educational presentation, pre designed presentation templates help save time. Forecast Analysis Technique IT Methods Of Data Clustering In Predictive Modeling Formats PDF is highly customizable and very easy to edit, covering many different styles from creative to business presentations. Slidegeeks has creative team members who have crafted amazing templates. So, go and get them without any delay.
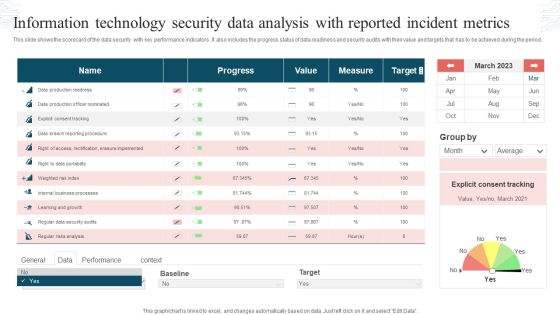
Information Technology Security Data Analysis With Reported Incident Metrics Rules PDF
This slide shows the scorecard of the data security with key performance indicators. It also includes the progress status of data readiness and security audits with their value and targets that has to be achieved during the period. Pitch your topic with ease and precision using this Information Technology Security Data Analysis With Reported Incident Metrics Rules PDF. This layout presents information on Progress, Value, Measure, Target. It is also available for immediate download and adjustment. So, changes can be made in the color, design, graphics or any other component to create a unique layout.

Forecasted Impact Of Strategies On Key Performance Indicators Slides PDF
Mentioned slide provides information about predicted affects on marketing communication strategies on business metrics. It includes KPIs such as website visit, blog traffic, conversion rate, social share, click through rate, bounce rate, impression, etc. Boost your pitch with our creative Forecasted Impact Of Strategies On Key Performance Indicators Slides PDF. Deliver an awe inspiring pitch that will mesmerize everyone. Using these presentation templates you will surely catch everyones attention. You can browse the ppts collection on our website. We have researchers who are experts at creating the right content for the templates. So you do not have to invest time in any additional work. Just grab the template now and use them.

Data Breach Prevention Recognition Organization Compliance Metrics Themes PDF
This slide covers the metrics that measure what you are doing with the awareness project, exactly how you will train and how. Such metrics are of particular importance for purposes of compliance and monitoring. Deliver an awe-inspiring pitch with this creative data breach prevention recognition organization compliance metrics themes pdf bundle. Topics like organization compliance metrics can be discussed with this completely editable template. It is available for immediate download depending on the needs and requirements of the user.

Business Assessment Outline Business Management KPIS Metrics Ratio Ppt Model Layout Ideas PDF
Deliver and pitch your topic in the best possible manner with this business assessment outline business management kpis metrics ratio ppt model layout ideas pdf. Use them to share invaluable insights on gross profit margin, opex ratio, ebit margin, net profit, new orders, delayed projects, new clients and impress your audience. This template can be altered and modified as per your expectations. So, grab it now.
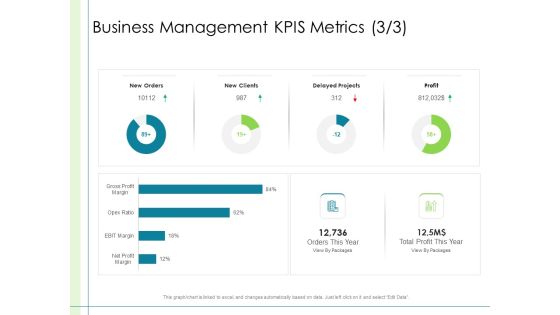
In Depth Business Assessment Business Management Kpis Metrics Profit Ppt PowerPoint Presentation Show Layouts PDF
Deliver and pitch your topic in the best possible manner with this in depth business assessment business management kpis metrics profit ppt powerpoint presentation show layouts pdf. Use them to share invaluable insights on gross profit margin, opex ratio, ebit margin, net profit, new orders, delayed projects, new clients and impress your audience. This template can be altered and modified as per your expectations. So, grab it now.

Annual Financial Budget Analysis Example Of Ppt
This is a annual financial budget analysis example of ppt. This is a five stage process. The stages in this process are business, strategy, finance, planning, compare.
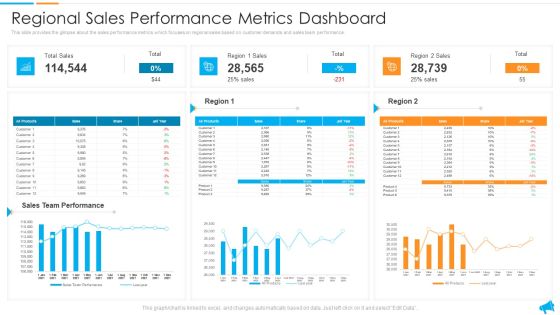
Strategy For Regional Economic Progress Outlining Regional Sales Performance Metrics Dashboard Designs PDF
This slide provides the glimpse about the sales performance metrics which focuses on regional sales based on customer demands and sales team performance. Deliver and pitch your topic in the best possible manner with this strategy for regional economic progress outlining regional sales performance metrics dashboard designs pdf. Use them to share invaluable insights on sales team performance, regional sales performance metrics dashboard and impress your audience. This template can be altered and modified as per your expectations. So, grab it now.

Organization Compliance Metrics Pictures PDF
This slide covers the metrics that measure what you are doing with the awareness project, exactly how you will train and how. Such metrics are of particular importance for purposes of compliance and monitoring.Presenting organization compliance metrics pictures pdf. to provide visual cues and insights. Share and navigate important information on one stage that need your due attention. This template can be used to pitch topics like training completion, communication methods. In addtion, this PPT design contains high resolution images, graphics, etc, that are easily editable and available for immediate download.

Customer Relationship Management Dashboard CRM Application Dashboard Risk Guidelines PDF
Deliver an awe inspiring pitch with this creative customer relationship management dashboard crm application dashboard risk guidelines pdf bundle. Topics like about to renew, accounts at risk, ongoing project, ongoing accounts can be discussed with this completely editable template. It is available for immediate download depending on the needs and requirements of the user.

Administrative Regulation Business Management KPIs Metrics Ration Ppt PowerPoint Presentation Professional Background Image PDF
Deliver and pitch your topic in the best possible manner with this administrative regulation business management kpis metrics ration ppt powerpoint presentation professional background image pdf. Use them to share invaluable insights on gross profit margin, opex ratio, ebit margin, net profit, new orders, delayed projects, new clients and impress your audience. This template can be altered and modified as per your expectations. So, grab it now.
Technology Upgradation Action Plan Dashboard For Issues Tracking Ppt Portfolio Graphics Pictures PDF
This slide shows the issues tracking the dashboard for the business transition project. It provides details of multiple issues faced by users to keep records for effective management of the project. Deliver an awe inspiring pitch with this creative Technology Upgradation Action Plan Dashboard For Issues Tracking Ppt Portfolio Graphics Pictures PDF bundle. Topics like Issues Failed Verification, Immediate Issues, High Churn Issues, Suspect Requirements, Failed Test Runs can be discussed with this completely editable template. It is available for immediate download depending on the needs and requirements of the user.
Information Technology Change Implementation Plan Dashboard For Issues Tracking Clipart PDF
This slide shows the issues tracking the dashboard for the business transition project. It provides details of multiple issues faced by users to keep records for effective management of the project. Deliver an awe inspiring pitch with this creative Information Technology Change Implementation Plan Dashboard For Issues Tracking Clipart PDF bundle. Topics like Issues Failed Verification, Immediate Issues, High Churn Issues, Suspect Requirements, Failed Test Runs can be discussed with this completely editable template. It is available for immediate download depending on the needs and requirements of the user.

Change Execution Plan Dashboard For Issues Tracking Ppt PowerPoint Presentation Gallery Background Images PDF
This slide shows the issues tracking the dashboard for the business transition project. It provides details of multiple issues faced by users to keep records for effective management of the project. Deliver and pitch your topic in the best possible manner with this Change Execution Plan Dashboard For Issues Tracking Ppt PowerPoint Presentation Gallery Background Images PDF. Use them to share invaluable insights on Employee Wise Issues, Overall Issues Status, High Churn Issue and impress your audience. This template can be altered and modified as per your expectations. So, grab it now.
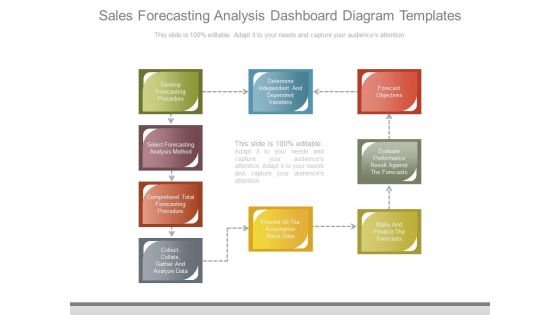
Sales Forecasting Analysis Dashboard Diagram Templates
This is a sales forecasting analysis dashboard diagram templates. This is a nine stage process. The stages in this process are develop forecasting procedure, select forecasting analysis method, comprehend total forecasting procedure, collect collate gather and analyze data, determine independent and dependent variables, present all the assumption about data, forecast objectives, evaluate performance result against the forecasts, make and finalize the forecasts.
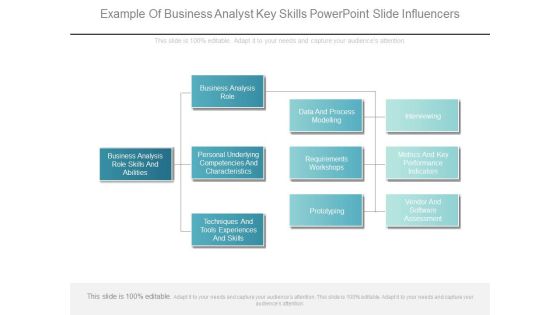
Example Of Business Analyst Key Skills Powerpoint Slide Influencers
This is a example of business analyst key skills powerpoint slide influencers. This is a three stage process. The stages in this process are business analysis role skills and abilities, business analysis role, personal underlying competencies and characteristics, techniques and tools experiences and skills, data and process modelling, requirements workshops, prototyping, interviewing, metrics and key performance indicators, vendor and software assessment.

Cost Comparison Analysis Powerpoint Slide Deck
This is a cost comparison analysis powerpoint slide deck. This is a two stage process. The stages in this process are cost comparison, business, strategy, marketing.

Consumer Portfolio Dashboard With Budget Details Ppt PowerPoint Presentation Styles Graphics Tutorials PDF
Presenting this set of slides with name consumer portfolio dashboard with budget details ppt powerpoint presentation styles graphics tutorials pdf. The topics discussed in these slides are portfolio summary, portfolio owner, budget, projects, estimated cost across portfolios. This is a completely editable PowerPoint presentation and is available for immediate download. Download now and impress your audience.

Setting Campaign Metrics Ppt PowerPoint Presentation Slide Download
This is a setting campaign metrics ppt powerpoint presentation slide download. This is a five stage process. The stages in this process are icons, process, strategy, business, marketing, management.

Forecast Analysis Technique IT Regression Model For Predictive Modeling Mockup PDF
This slide represents the regression model of predictive analytics that is most commonly used in statistical analysis. This model is used to identify patterns in large amounts of data and works by calculating a formula. Crafting an eye catching presentation has never been more straightforward. Let your presentation shine with this tasteful yet straightforward Forecast Analysis Technique IT Regression Model For Predictive Modeling Mockup PDF template. It offers a minimalistic and classy look that is great for making a statement. The colors have been employed intelligently to add a bit of playfulness while still remaining professional. Construct the ideal Forecast Analysis Technique IT Regression Model For Predictive Modeling Mockup PDF that effortlessly grabs the attention of your audience Begin now and be certain to wow your customers.

Collection Of Quality Assurance PPT Quality Assurance Vs Control With Key Metrics Rules PDF
This slide distinguished quality assurance and quality control based on focus, character, starting point, tools and measures. It also covers information about key metrics of both. Deliver an awe inspiring pitch with this creative collection of quality assurance ppt quality assurance vs control with key metrics rules pdf bundle. Topics like planning, project, quality metrics, requirement can be discussed with this completely editable template. It is available for immediate download depending on the needs and requirements of the user.
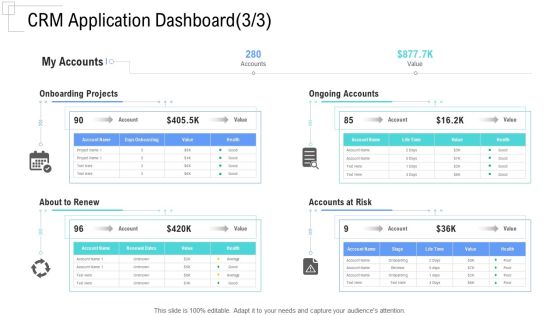
Managing Customer Experience CRM Application Dashboard Accounts Introduction PDF
Deliver and pitch your topic in the best possible manner with this managing customer experience crm application dashboard accounts introduction pdf. Use them to share invaluable insights on onboarding projects, ongoing accounts, about to renew, accounts at risk and impress your audience. This template can be altered and modified as per your expectations. So, grab it now.

CRM Application Dashboard Value Customer Relationship Management CRM Introduction PDF
Deliver and pitch your topic in the best possible manner with this crm application dashboard value customer relationship management crm introduction pdf. Use them to share invaluable insights on ongoing accounts, ongoing project, value, risk and impress your audience. This template can be altered and modified as per your expectations. So, grab it now.
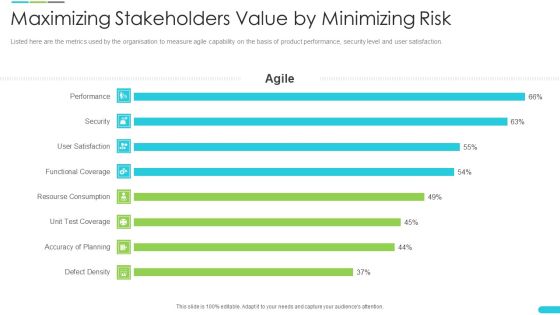
Discipline Agile Delivery Software Development Maximizing Stakeholders Value By Minimizing Risk Metrics Pictures PDF
This graph includes various factors that deal with the disciplined agile delivery resulting decrease in risk and increase in value throughout the project. Deliver an awe-inspiring pitch with this creative discipline agile delivery software development maximizing stakeholders value by minimizing risk metrics pictures pdf bundle. Topics like maximizing stakeholders value by minimizing risk can be discussed with this completely editable template. It is available for immediate download depending on the needs and requirements of the user.
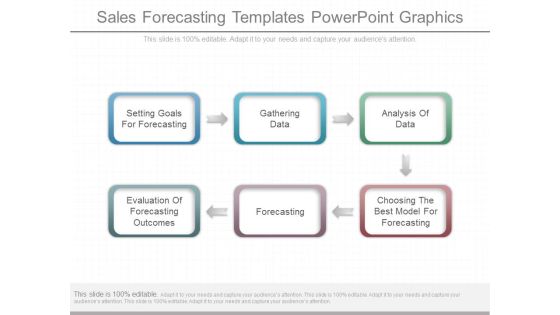
Sales Forecasting Templates Powerpoint Graphics
This is a sales forecasting templates powerpoint graphics. This is a six stage process. The stages in this process are setting goals for forecasting, gathering data, analysis of data, evaluation of forecasting outcomes, forecasting, choosing the best model for forecasting.
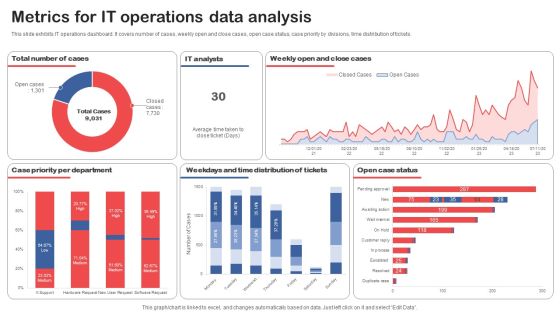
Metrics For IT Operations Data Analysis Topics PDF
This slide exhibits IT operations dashboard. It covers number of cases, weekly open and close cases, open case status, case priority by divisions, time distribution of tickets. Pitch your topic with ease and precision using this Metrics For IT Operations Data Analysis Topics PDF. This layout presents information on Case Priority Per Department, Distribution Of Tickets, Open Case Status. It is also available for immediate download and adjustment. So, changes can be made in the color, design, graphics or any other component to create a unique layout.

Submit Data Collection Request Ppt Design Templates
This is a submit data collection request ppt design templates. This is a thirteen stage process. The stages in this process are refine data collection approach and schedule, submit data collection request, organize and kick of projects, currently being used for future use metric, critical reporting requirements definition, meet with and interview president and executive leadership, currents state assessment gap and analysis and process capability, conduct key stakeholders alignment meeting, conduct vision workshop with executive leadership, information and data assessment, internal reporting requirements, future state capability vision, implementation considerations and high level plan.

Predictive Data Model Introduction To Predictive Analytics Technology Introduction PDF
This slide represents the predictive analytics introduction that is used for forecasts action, behaviors, and trends using recent and past information. It performs the operations such as data mining, text analytics, statistics, and modeling on structured and unstructured data. Find highly impressive Predictive Data Model Introduction To Predictive Analytics Technology Introduction PDF on Slidegeeks to deliver a meaningful presentation. You can save an ample amount of time using these presentation templates. No need to worry to prepare everything from scratch because Slidegeeks experts have already done a huge research and work for you. You need to download Predictive Data Model Introduction To Predictive Analytics Technology Introduction PDF for your upcoming presentation. All the presentation templates are 100 percent editable and you can change the color and personalize the content accordingly. Download now

Predictive Data Model Overview Of Predictive Analytics Framework Summary PDF
This slide outlines the overview of the predictive analytics framework and its components, including wide area network, OpenFlow, forecasting, software-defined networking controller, predictive models, elastic cluster, data acquisition and application servers. Coming up with a presentation necessitates that the majority of the effort goes into the content and the message you intend to convey. The visuals of a PowerPoint presentation can only be effective if it supplements and supports the story that is being told. Keeping this in mind our experts created Predictive Data Model Overview Of Predictive Analytics Framework Summary PDF to reduce the time that goes into designing the presentation. This way, you can concentrate on the message while our designers take care of providing you with the right template for the situation.

Customer Relationship Management Action Plan CRM Application Dashboard Icon Themes PDF
Deliver an awe inspiring pitch with this creative customer relationship management action plan crm application dashboard icon themes pdf bundle. Topics like onboarding projects, accounts at risk, ongoing accounts can be discussed with this completely editable template. It is available for immediate download depending on the needs and requirements of the user.
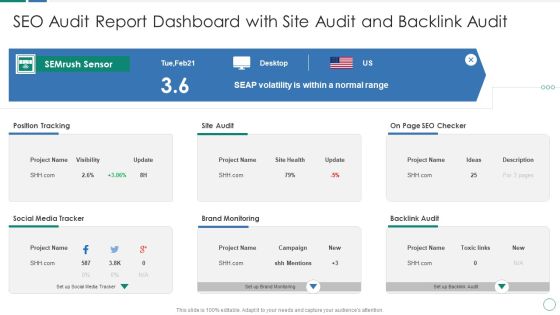
SEO Audit Report Dashboard With Site Audit And Backlink Audit Summary PDF
Deliver an awe inspiring pitch with this creative SEO Audit Report Dashboard With Site Audit And Backlink Audit Summary PDF bundle. Topics like Position Tracking Site, Audit Page SEO, Checker Backlink Audit, Brand Monitoring Project, Social Media Tracker can be discussed with this completely editable template. It is available for immediate download depending on the needs and requirements of the user.

Data Interpretation And Analysis Playbook Business Intelligence And Predictive Analytics Challenges Template PDF
This template covers the problems while implementing BI and predictive analytics in the organization. The challenges are undefined KPIs and metrics, and unable to hire right data science talent. Presenting data interpretation and analysis playbook business intelligence and predictive analytics challenges template pdf to provide visual cues and insights. Share and navigate important information on two stages that need your due attention. This template can be used to pitch topics like security vulnerabilities, operationalizing, perform analysis, deployed. In addtion, this PPT design contains high resolution images, graphics, etc, that are easily editable and available for immediate download.
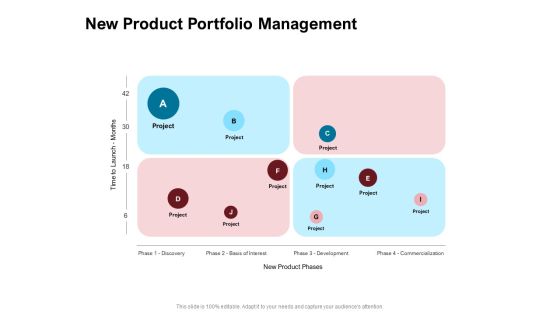
New Product Development Performance Evaluation New Product Portfolio Management Ppt PowerPoint Presentation Outline Templates PDF
Presenting this set of slides with name new product development performance evaluation new product portfolio management ppt powerpoint presentation outline templates pdf. This is a four stage process. The stages in this process are project, discovery, basis interest, development, commercialization. This is a completely editable PowerPoint presentation and is available for immediate download. Download now and impress your audience.

Product Portfolio Management For New Product Development New Product Portfolio Management Diagrams PDF
Presenting this set of slides with name product portfolio management for new product development new product portfolio management diagrams pdf. This is a four stage process. The stages in this process are project, discovery, basis interest, development, commercialization. This is a completely editable PowerPoint presentation and is available for immediate download. Download now and impress your audience.
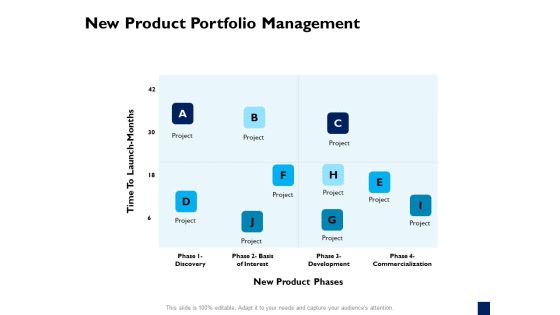
Evaluation Criteria Of New Product Development Process New Product Portfolio Management Clipart PDF
Presenting this set of slides with name evaluation criteria of new product development process new product portfolio management clipart pdf. This is a four stage process. The stages in this process are project, discovery, basis interest, development, commercialization. This is a completely editable PowerPoint presentation and is available for immediate download. Download now and impress your audience.

Data Quality Kpis Assessment Metrics Icon Topics PDF
Showcasing this set of slides titled Data Quality Kpis Assessment Metrics Icon Topics PDF. The topics addressed in these templates are Data Quality Kpis, Assessment Metrics Icon. All the content presented in this PPT design is completely editable. Download it and make adjustments in color, background, font etc. as per your unique business setting.

Quantitative Data Analysis Icon For Predictive Modelling Ppt Ideas Images PDF
Presenting Quantitative Data Analysis Icon For Predictive Modelling Ppt Ideas Images PDF to dispense important information. This template comprises one stages. It also presents valuable insights into the topics including Quantitative Data, Analysis Icon, Predictive Modelling. This is a completely customizable PowerPoint theme that can be put to use immediately. So, download it and address the topic impactfully.

Data Interpretation And Analysis Playbook Table Of Contents For Data Interpretation And Analysis Playbook Rules PDF
Deliver an awe inspiring pitch with this creative data interpretation and analysis playbook table of contents for data interpretation and analysis playbook rules pdf bundle. Topics like six critical elements, data management framework, solutions to the barriers, data management in bi projects, final thoughts can be discussed with this completely editable template. It is available for immediate download depending on the needs and requirements of the user.

Forecast Analysis Technique IT Introduction To Predictive Modeling Technology Portrait PDF
This slide represents the predictive analytics introduction that is used for forecasts action, behaviors, and trends using recent and past information. It performs the operations such as data mining, text analytics, statistics, and modeling on structured and unstructured data. Boost your pitch with our creative Forecast Analysis Technique IT Introduction To Predictive Modeling Technology Portrait PDF. Deliver an awe inspiring pitch that will mesmerize everyone. Using these presentation templates you will surely catch everyones attention. You can browse the ppts collection on our website. We have researchers who are experts at creating the right content for the templates. So you do not have to invest time in any additional work. Just grab the template now and use them.

Calculate Facebook Key Performance Indicator Performance Sample PDF
Pitch your topic with ease and precision using this calculate facebook key performance indicator performance sample pdf. This layout presents information on calculate facebook key performance indicator performance. It is also available for immediate download and adjustment. So, changes can be made in the color, design, graphics or any other component to create a unique layout.

CRM Implementation Strategy Implementation Data Transmission And Metrics Slides PDF
This slide showcases the Implementation with process automation which includes assignment and workflow approach, data transmission and setting up metrics with CRM software.Deliver and pitch your topic in the best possible manner with this CRM Implementation Strategy Implementation Data Transmission And Metrics Slides PDF Use them to share invaluable insights on Data Transmission, Performance Review, Review Activities and impress your audience. This template can be altered and modified as per your expectations. So, grab it now.

Administered Data And Analytic Quality Playbook Business Intelligence And Predictive Download PDF
This template covers the problems while implementing BI and predictive analytics in the organization. The challenges are undefined KPIs and metrics, and unable to hire right data science talent. Deliver and pitch your topic in the best possible manner with this Administered Data And Analytic Quality Playbook Business Intelligence And Predictive Download PDF Use them to share invaluable insights on Common Misconception, Operationalizing, Production Deployment and impress your audience. This template can be altered and modified as per your expectations. So, grab it now.

 Home
Home